8 Strange Things in Today’s Inflation Report
While consumer prices declined more than expected in October, there were some odd parts of the inflation report that stood out more than others.
The consumer price index climbed 3.2% in October from the previous year, which was a decline from September’s 3.7% increase. Growth from the prior month was flat, the Bureau of Labor Statistics said on Tuesday. Economists surveyed by FactSet were expecting gains of 3.3% for the year and 0.1% for the month.
“We need to see more months with soft inflation data, but the stock and bond market is celebrating today. We’re set up nicely for a year-end rally,” Gina Bolvin, president of Bolvin Wealth Management Group, wrote on Tuesday. The Dow Jones Industrial Average rose 461 points, or 1.3%. The S&P 500 gained 1.8% while the Nasdaq Composite jumped 2.1%.
Many investors and economists are focusing on data points such as how the gasoline index decreased from September, or how shelter costs increased. But digging deeper into the report provides some interesting—and arguably strange—details of prices that have changed drastically in the past month.
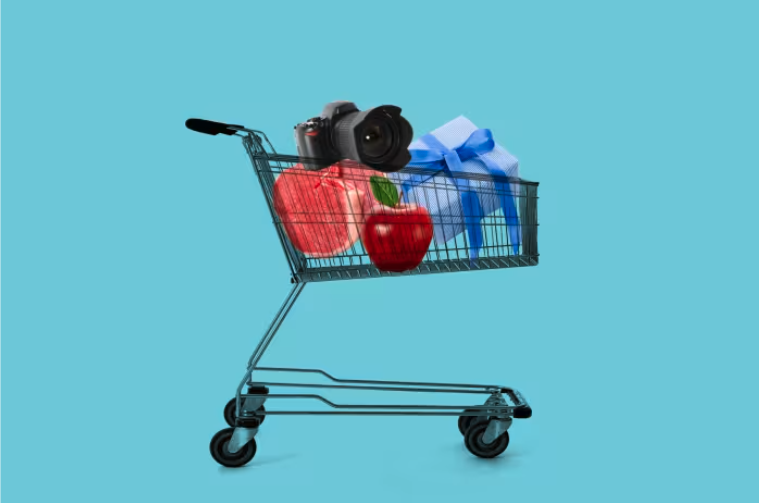
Overall food prices increased 0.3% in October from September. While that number might not be too noteworthy, there were certain food items that stuck out. For one, the price of uncooked beef roasts increased 4.1% from the previous month, while the cost of pork chops rose 3.5%. According to reports from the Agriculture Department, total cattle and hog inventory has been declining in recent months.
But while beef roasts and pork chops cost more for the American consumer, prices for apples dropped a whopping 7.9% in October from September.
It wasn’t only food that had some funky results. The prices of laundry equipment declined 5% in the month while photographic equipment and supplies increased 6.8%.
For sports fans, admission prices for sporting events jumped 3.6% from the previous month.
“These are things that could be affected by seasonal factors,” Raymond James’ Chief Economist Eugenio Aleman tells Barron’s. The National Hockey League began its regular season schedule on Oct. 10 while the National Basketball Association began its season on Oct. 24.
For people who are looking to buy their loved one a new jacket for the holiday season, women’s outerwear prices dropped 5.9%. But wrapping that coat will cost more as the price of stationary, stationary supplies, and gift wraps was up 3.5%.
Aleman said that these individual items—while interesting outliers—aren’t heavily weighted when looking at the total report.
“There are some of these items that are so small in the overall CPI that basically it’s probably not affecting much of the direction of the overall core CPI,” Aleman said.
Even if these items aren’t heavily weighted against the total inflation outcome, consumers are sure to notice these changes as they head into stores during the holiday season.
This stylish family home combines a classic palette and finishes with a flexible floorplan
Just 55 minutes from Sydney, make this your creative getaway located in the majestic Hawkesbury region.
Continued stagflation and cost of living pressures are causing couples to think twice about starting a family, new data has revealed, with long term impacts expected
Australia is in the midst of a ‘baby recession’ with preliminary estimates showing the number of births in 2023 fell by more than four percent to the lowest level since 2006, according to KPMG. The consultancy firm says this reflects the impact of cost-of-living pressures on the feasibility of younger Australians starting a family.
KPMG estimates that 289,100 babies were born in 2023. This compares to 300,684 babies in 2022 and 309,996 in 2021, according to the Australian Bureau of Statistics (ABS). KPMG urban economist Terry Rawnsley said weak economic growth often leads to a reduced number of births. In 2023, ABS data shows gross domestic product (GDP) fell to 1.5 percent. Despite the population growing by 2.5 percent in 2023, GDP on a per capita basis went into negative territory, down one percent over the 12 months.
“Birth rates provide insight into long-term population growth as well as the current confidence of Australian families,” said Mr Rawnsley. “We haven’t seen such a sharp drop in births in Australia since the period of economic stagflation in the 1970s, which coincided with the initial widespread adoption of the contraceptive pill.”
Mr Rawnsley said many Australian couples delayed starting a family while the pandemic played out in 2020. The number of births fell from 305,832 in 2019 to 294,369 in 2020. Then in 2021, strong employment and vast amounts of stimulus money, along with high household savings due to lockdowns, gave couples better financial means to have a baby. This led to a rebound in births.
However, the re-opening of the global economy in 2022 led to soaring inflation. By the start of 2023, the Australian consumer price index (CPI) had risen to its highest level since 1990 at 7.8 percent per annum. By that stage, the Reserve Bank had already commenced an aggressive rate-hiking strategy to fight inflation and had raised the cash rate every month between May and December 2022.
Five more rate hikes during 2023 put further pressure on couples with mortgages and put the brakes on family formation. “This combination of the pandemic and rapid economic changes explains the spike and subsequent sharp decline in birth rates we have observed over the past four years,” Mr Rawnsley said.
The impact of high costs of living on couples’ decision to have a baby is highlighted in births data for the capital cities. KPMG estimates there were 60,860 births in Sydney in 2023, down 8.6 percent from 2019. There were 56,270 births in Melbourne, down 7.3 percent. In Perth, there were 25,020 births, down 6 percent, while in Brisbane there were 30,250 births, down 4.3 percent. Canberra was the only capital city where there was no fall in the number of births in 2023 compared to 2019.
“CPI growth in Canberra has been slightly subdued compared to that in other major cities, and the economic outlook has remained strong,” Mr Rawnsley said. “This means families have not been hurting as much as those in other capital cities, and in turn, we’ve seen a stabilisation of births in the ACT.”
This stylish family home combines a classic palette and finishes with a flexible floorplan
Just 55 minutes from Sydney, make this your creative getaway located in the majestic Hawkesbury region.


