Art Market Dip Last Year Reflects Lack of Supply, Not Demand

 3 min
3 min
The global market for art may have been softer last year against a more volatile economic backdrop, but trends detailed within the latest annual report from Art Basel and UBS released earlier this week continue to show collectors are willing to buy.
Scanning a chart within the report of sales since 2009 reveals an ebb-and-flow in the overall market, but surprising consistency in the value of transactions and an uptick in volume.
The year-to-year differences, such as the 4% dip in market value to US$65 billion last year, are mostly driven by the number and outcome of big-ticket sales, which declined across auction houses and galleries in 2023.
How many high-value works of art come to market in a given year, however, often has less to do with buying interest from collectors during shaky economic conditions and more to do with the willingness of sellers to part with paintings or sculptures during a time of perceived weakness, according to Matthew Newton, art advisory specialist at UBS Family Office Solutions in New York.
“I don’t think we see an unwillingness to buy those works when they do come to market,” Newton says.
When the economy is weak, estates with less discretion over timing often are the main consignors of expensive art. For example, last fall in New York, Sotheby’s sold works owned by Emily Fisher Landau , a long-time patron who amassed a collection bursting with masterpieces that hadn’t appeared at an auction before.
Sotheby’s single-owner auction of the Fisher Landau collection led to the US$139.4 million sale of Pablo Picasso’s Femme à la montre (the second highest price for a Picasso work at auction); the US$41 million sale of Jasper Johns’ Flags ; and the record US$18.7 million sale of Agenes Martin’s Grey Stone II —prices that were within or exceeded expectations.
“People are still willing to make trophy purchases,” Newton says. “I don’t think there’s a lack of demand, it’s about a lack of supply.”
Rising interest rates since 2022 arguably could be another factor in slower high-end sales, since wealthy individuals finance about 29% of their art collections, on average, while the ultra-wealthy (those with a net worth above US$50 million) finance as much as 39%, according to a separate report on global collecting trends published late last year from Art Basel and UBS.
But Newton doesn’t believe higher rates played a significant role in the art market last year. The wealthy typically borrow money for business or investment opportunities; if they have a US$500 million art collection on their walls, borrowing against it can be a good source of liquidity. Any impact it has on the market would be “within the margin of error,” Newton says.
Another chart in the report tracks sales growth from 2009 through 2023 in five segments of the auction market, from works sold below US$50,000 to those achieving US$10 million or more. The results show the performance of most works of art that are sold—that is, those that fall below the US$10 million level—has been “relatively flat over a decade plus,” Newton says. “It’s really those works that are over US$10 million … that’s where we see growth in the art market.”
At auction, the US$10 million-plus segment fell a substantial 25% in 2023 from the previous year, but overall, the sales trend for those ultra-expensive paintings since 2009 has been on an upward trajectory. That’s no accident, considering the population of billionaires who fuel those sales has also continued to rise, with their wealth doubling over the last 10 years to about US$13.1 billion, according to the report.
“It’s a relatively very small group of people who can spend over US$10 million on artwork,” Newton says. Of those who can afford to, not everyone does, meaning a few individuals can alter total sales for the whole market.
In part, that’s because global art sales are relatively small even at US$65 billion. Consider the global private-equity market—another place where the wealthiest individuals place their money—was estimated to reach US$16.3 trillion last year, according to London data firm Preqin.
“$65 billion … that’s obviously a lot of money,” he says. “On the other hand, that’s the entire art market—it’s like less than half the net worth of a few individuals.”
Newton says he often reminds clients that not that much art that exists in the world is sold. “What is traded is a very, very small percentage of the work that’s out there.”
 Copyright 2020, Dow Jones & Company, Inc. All Rights Reserved Worldwide. LEARN MORE




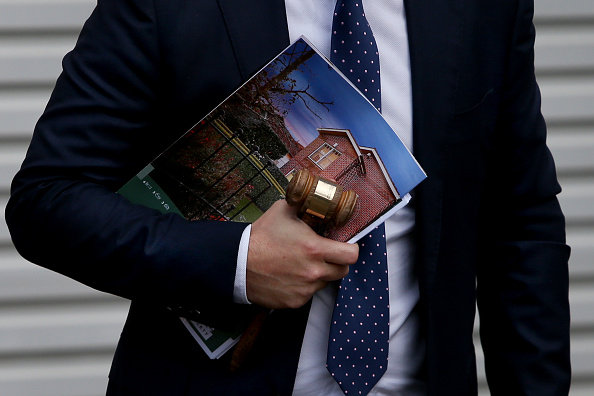
Victorian auction buyers will soon receive a piece of information that has traditionally been withheld until bidding reaches it: the vendor’s reserve price. Under new property-sale and underquoting laws, agents must publish the agreed reserve at least seven days before an auction or fixed-date sale. Most changes begin on 1 October 2026 and apply to …
Continue reading “Victoria’s New Auction Rules Will Force Reserve Prices Into the Open”
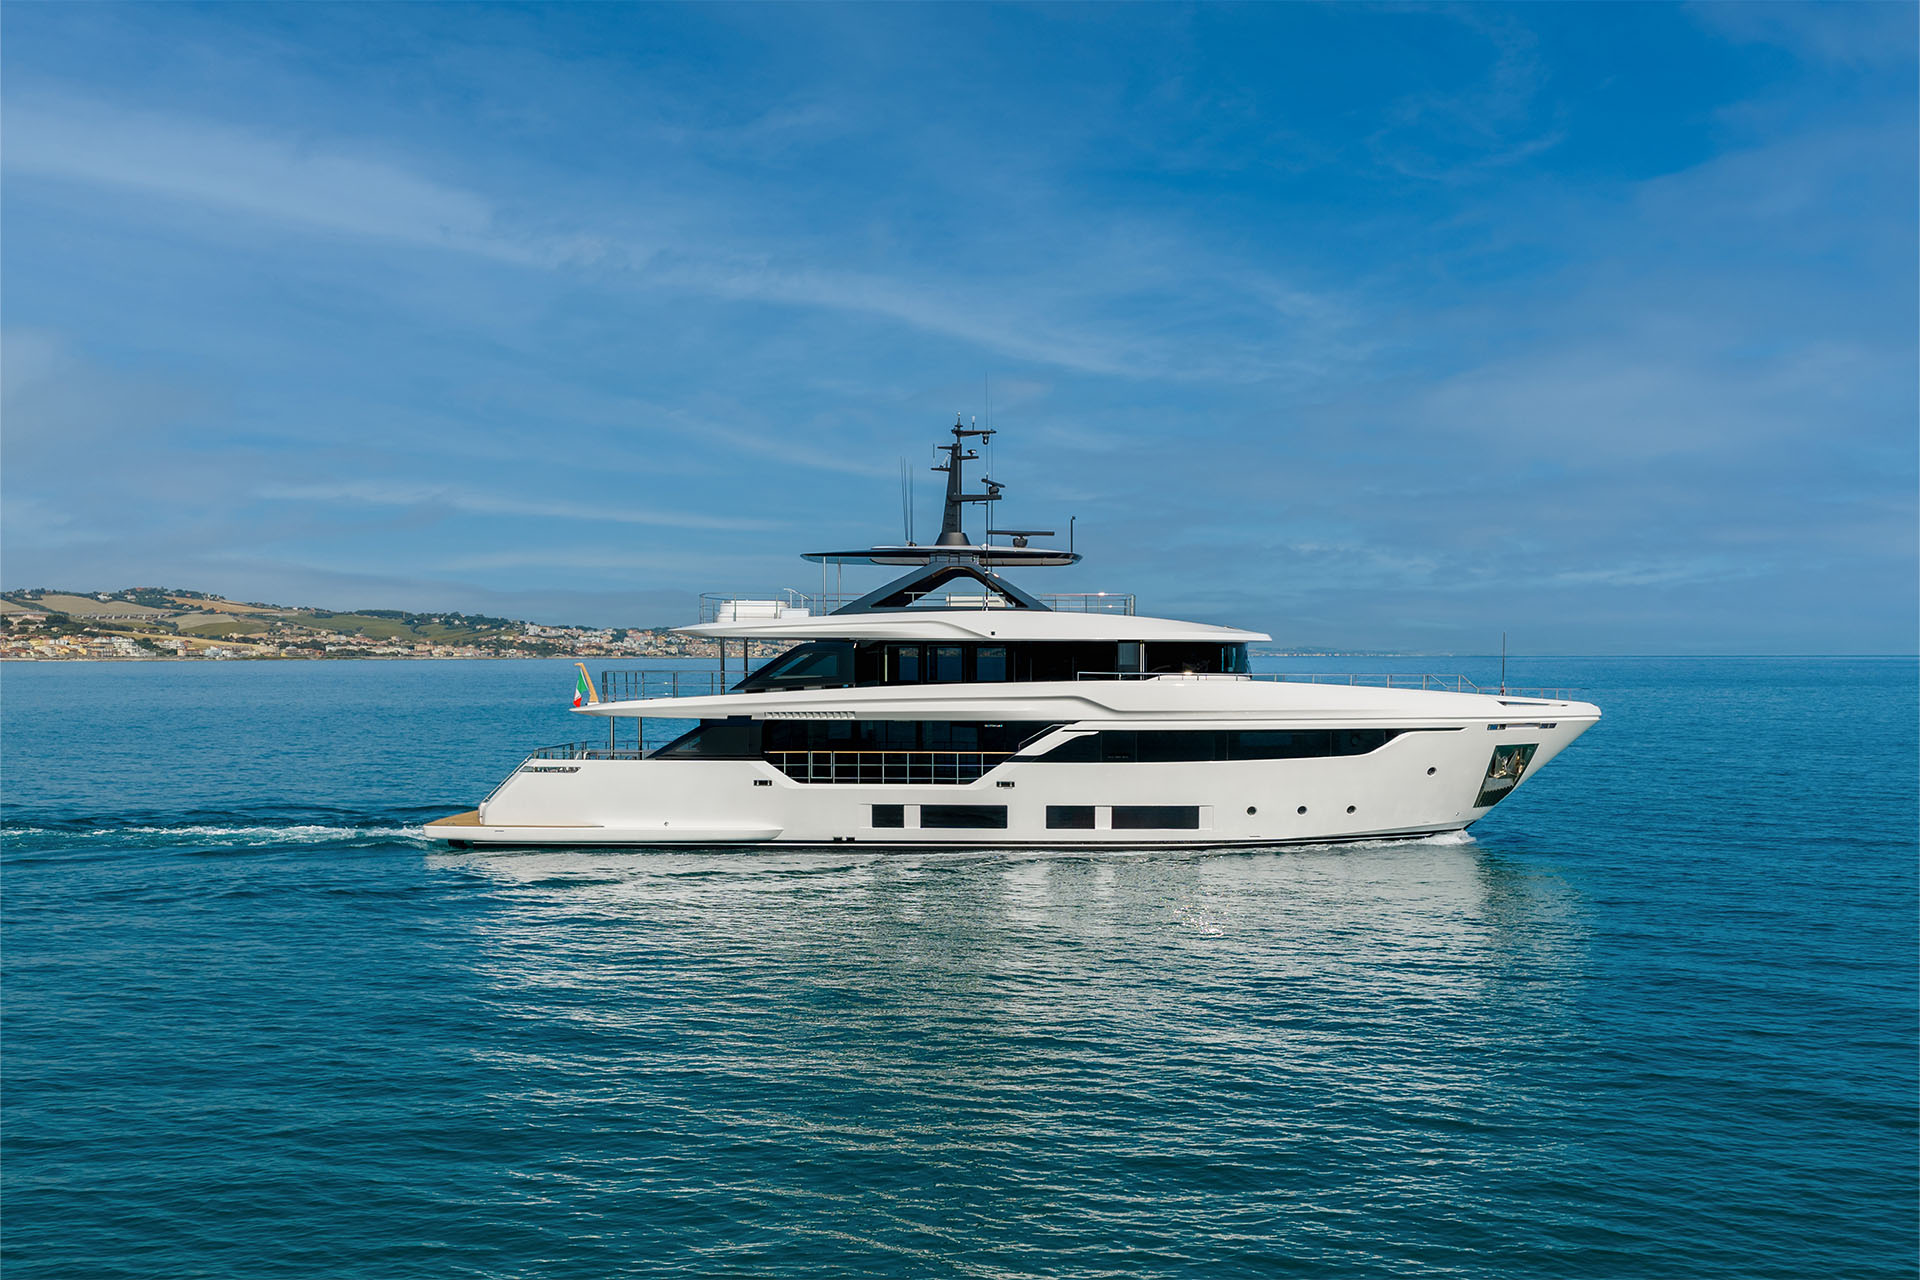
Four decks, 34.5 metres and a made-to-measure interior: step aboard the new Custom Line Navetta 35, unveiled at Cannes.
The ASX 200 rose about 0.27% as energy and materials advanced. Woodside and gold miners gained while financials and technology weakened.
2 min
The Australian sharemarket rebounded from its lowest close in three months on Wednesday, with energy and materials companies leading a cautious recovery.
The S&P/ASX 200 finished approximately 23 points, or 0.27 per cent, higher at 8,695.6 on 16 September. A second data source placed the closing index at 8,696.5, up 24 points or 0.28 per cent. The official close should be confirmed through a licensed feed before publication.
The broader All Ordinaries added 25.2 points, or 0.28 per cent, to 8,874.5.
Energy was the strongest sector, rising 2.19 per cent as Australian producers reflected the previous overnight increase in global oil prices. Woodside gained 2.84 per cent. Brent had settled near US$108.75 a barrel before the local session, although it later traded around US$107.68.
Materials advanced 1.28 per cent and provided the largest positive contribution to the index. Gold producers featured prominently among the strongest stocks, with Pantoro rising 9.3 per cent and St Barbara gaining 8.18 per cent. BCI Minerals added 7.48 per cent.
Financials fell 0.37 per cent, detracting from the benchmark despite earlier strength. Rate expectations remained a significant influence after Westpac joined the other major banks in forecasting a possible Reserve Bank increase in November. Higher rates can expand bank margins in some circumstances but also raise funding costs and increase the risk of loan stress and slower credit growth.
Technology remained weak. Life360 declined 5.46 per cent, while healthcare names that had rallied during Tuesday’s sell-off gave back ground. 4DMedical lost 5.35 per cent and Telix Pharmaceuticals fell 4.96 per cent.
James Hardie dropped 5.23 per cent. Codan moved against the weaker technology tone, gaining 7.51 per cent.
The session produced positive breadth, with more advancers than decliners among the largest 250 stocks, but the broader backdrop remains unsettled. Oil prices have revived inflation concerns, bond yields are elevated and investors are assessing the prospect of further monetary tightening in Australia and the United States.
The rebound therefore recovered only part of Tuesday’s 0.9 per cent decline. For Thursday, investors will be watching overnight central-bank developments, energy markets and whether gains can broaden beyond resources.
Market dashboard — 16 September 2026
S&P/ASX 200* Approximately 8,695.6, up 23.1 points or 0.27 per cent; verify the official closing print
All Ordinaries: 8,874.5, up 25.2 points or 0.28 per cent
Best-performing sector: Energy, up 2.19 per cent
Materials: Up 1.28 per cent
Weak sector: Financials, down 0.37 per cent
Leading mover: Pantoro, up 9.30 per cent
Notable large-cap mover: Woodside, up 2.84 per cent
Notable loser: Sunrise Energy Metals, down 6.22 per cent
Life360: Down 5.46 per cent
Australian dollar: About US71.3 cents in the preceding market snapshot
Gold: Approximately US$4,375 an ounce in the afternoon snapshot
Brent crude: Approximately US$107.68 a barrel in the afternoon snapshot
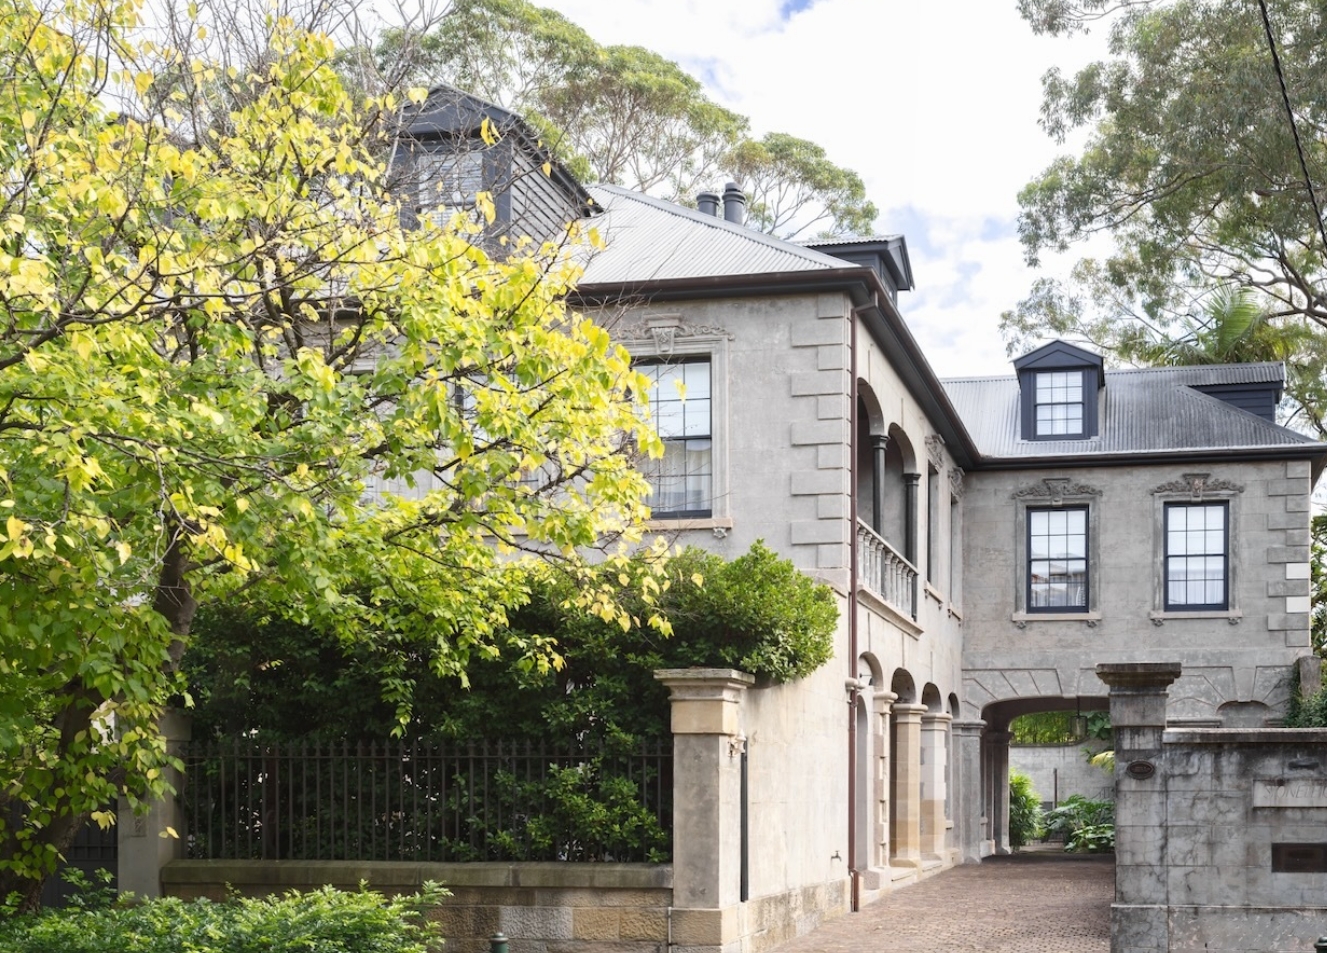
The 1860s Darlinghurst mansion Stoneleigh could become Sydney’s most expensive home ever sold under the hammer when it goes to auction. Clint Ballard is giving buyers a $28 million guide for the heritage-listed mansion on Darley Street, opposite Iona, the former home of Hollywood royalty Baz Luhrmann. Stoneleigh is being offered for sale for the …

On October 2, acclaimed chef Dan Arnold will host an exclusive evening, unveiling a Michelin-inspired menu in a rare masterclass of food, storytelling and flavour.