Social-Media Influencers Aren’t Getting Rich—They’re Barely Getting By
Platforms are paying less for popular posts, brands are pickier about partnerships and a possible TikTok ban looms

 9 min
9 min
Many people dream of becoming social-media stars like YouTube’s MrBeast or TikTok’s Charli D’Amelio . But for most who pursue careers as content creators, just making ends meet is a lofty goal.
Clint Brantley has been a full-time creator for three years, posting videos on TikTok, YouTube and Twitch where he comments on news and trends related to the online game “ Fortnite .” Despite having more than 400,000 followers, and posts that average 100,000 views, his income last year was less than the median annual pay for full-time U.S. workers in 2023—$58,084, based on Bureau of Labor Statistics data .

The 29-year-old is hesitant to commit to an apartment lease because the money he gets, mainly from online tips and sponsorship deals, arrives randomly and could vanish at any moment. For now, he’s living with his mom in Washington state.
“I’m vulnerable,” he says.
Earning a decent, reliable income as a social-media creator is a slog—and it’s getting harder. Platforms are doling out less money for popular posts and brands are being pickier about what they want out of sponsorship deals. The real possibility of TikTok potentially shutting down in 2025 is adding to creators’ anxiety over whether they can afford to stick with the job for the long haul.
Few overnight sensations
Hundreds of millions of people around the globe regularly post videos and photos to entertain or educate social-media users. About 50 million earn money from it, according to a 2023 report from Goldman Sachs . The investment bank expects the number of creator-earners to grow at an annual rate of 10% to 20% through 2028, crowding the field even further. The Labor Department doesn’t track wages for these creators, also known as influencers.
It can take months or years to earn money as a creator, often through a combination of direct revenue from social-media platforms, sponsorship deals, merchandise sales and affiliate links. But those who stick with it eventually see some returns, surveys show. Creators say that’s because you can learn what kind of posts most resonate with an audience, which can lead to more followers and, in turn, more moneymaking opportunities.
But money doesn’t mean big bucks . Last year, 48% of creator-earners made $15,000 or less, according to NeoReach, an influencer marketing agency. Only 13% made more than $100,000.
The gap reflects multiple factors, including whether creators work full- or part-time, the kind of content they put out and when they started. People who jumped into the space during the height of Covid-19 lockdowns—and who focused on a niche such as fashion, investing or lifestyle hacks—say they benefited from the surge in social-media use during that time.
A small number of creators shot to fame, propelling the occupation to the top of career wish lists for many teens (and adults). But behind the scenes, creators say the job is gruelling. They need to constantly produce compelling posts or risk losing momentum. They spend their days planning, filming and editing posts while also working to make inroads with advertisers and interacting with fans.
“It is a lot more work than most people realise,” says Emarketer analyst Jasmine Enberg. “Creators who make a living doing it have been at it for many years. Most are not overnight sensations.”
Like other self-employed professionals, creators don’t get paid time off, healthcare benefits, retirement contributions and other perks that companies typically provide for their workers. That reality, coupled with stubbornly high inflation and mortgage rates , is making it more difficult to get by as a creator.

“Everything is more expensive, especially groceries,” says Jason Cooper of Mobile, Ala.
A few years ago, Cooper dreamed up a sassy sock puppet named Sock Cop, who cracks dad jokes in live and recorded videos for TikTok and Twitch . He currently makes $500 to $600 a month, almost entirely from tips.
He thinks he could probably haul in a lot more if he went full-time. But with no guarantee, the 37-year-old father doesn’t want to quit his marketing job and risk losing health coverage. He now spends a few hours in the evening and on weekends on Sock Cop. If he had more time, he would feel the need to constantly make videos.
“You’ve got to feed the beast,” says Cooper.
Shrinking platform payouts
TikTok’s $1 billion creator fund, which ran from 2020 to 2023, doled out money to eligible creators for posting to the platform. Others joined in . YouTube’s TikTok competitor, Shorts, allowed creators to earn anywhere from $100 to $10,000 a month with its temporary fund. Instagram’s Reels Play bonus program rewarded creators with fluctuating payouts. Snapchat ’s Spotlight rewards program gave $1 million a day to the platform’s top creators.
Today, the platforms have revamped or completely changed how they pay creators—doing away with their funds.
Qualifications for TikTok’s current rewards program include having an account with at least 10,000 followers with a minimum of 100,000 views in the past month. Instagram is currently testing a seasonal, invitation-only program that rewards creators for sharing Reels and photos.
YouTube debuted an ad-revenue share model last year, in which qualifying creators with more than 1,000 subscribers and 10 million public Shorts views in the past 90 days receive 45% of revenue from ads that occur between posts. Snapchat has a program that gives creators who meet certain criteria, such as having at least 50,000 followers and 25 million monthly views, a portion of the ad revenue that appears between Stories. Its Spotlight program also continues to dole out money to creators.
Creators who opt into these programs or bonuses aren’t guaranteed a significant payday.
Yuval Ben-Hayun originally became popular on TikTok in 2020 because of his posts about the word-puzzle game Wordle. The 29-year-old New Yorker eventually expanded into linguistic and other education content, and by early 2023, was able to support himself and his bills of over $4,000 a month.
TikTok had closed its fund by then but was testing its creator rewards program. Ben-Hayun said in March he received about $200 to $400 per million views, and it’s steadily declined since then—even as his follower count reached 2.9 million.
The followers are still there, but the money isn’t. He recently hit a new low, receiving only $120 for a video with 10 million views.
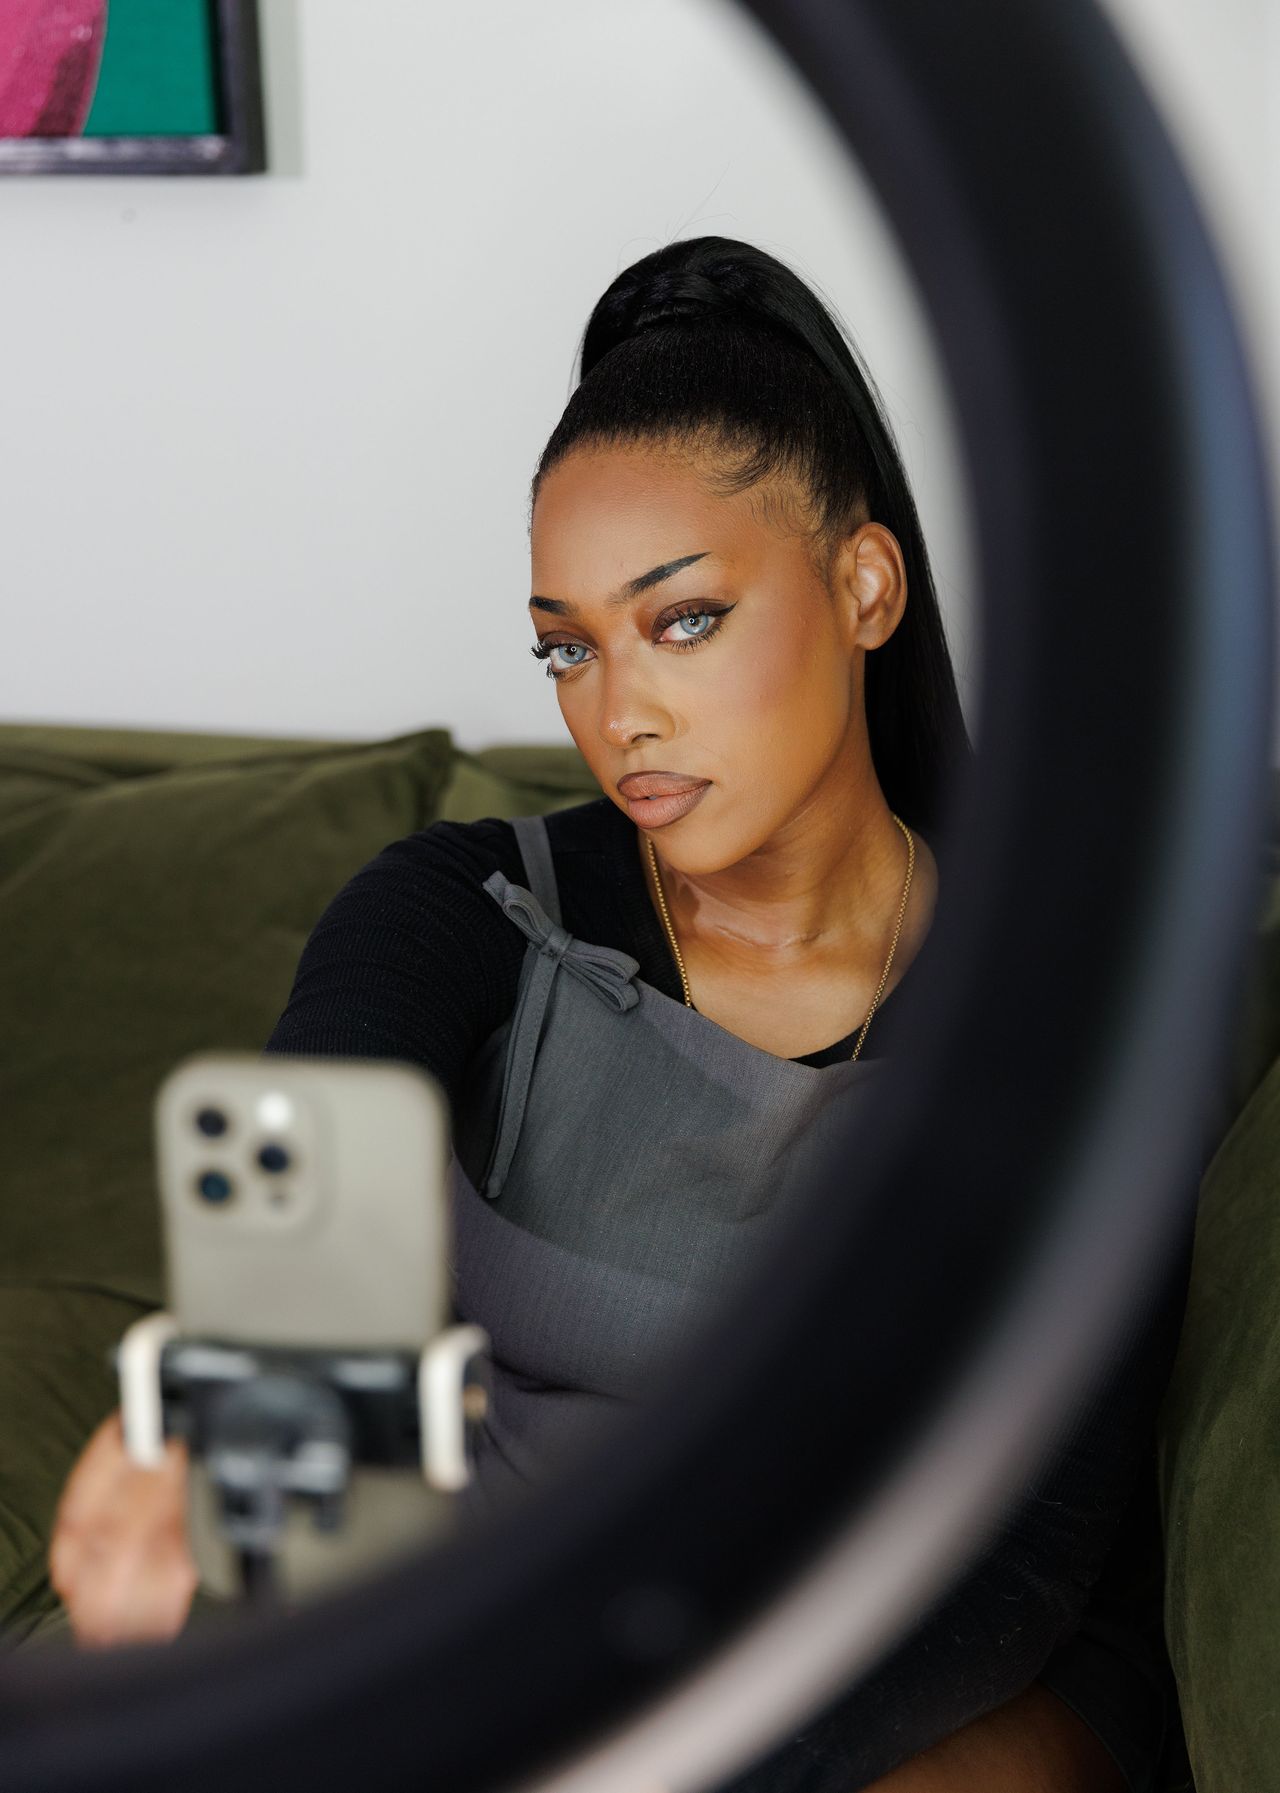
Danisha Carter is frustrated that TikTok and other platforms sold the idea of content creation as a job, but later withdrew the financial incentives. Thanks to creators’ efforts, she says, consumers are now hooked on social feeds, bringing the platforms billions of dollars in annual revenue.
The 26-year-old has 1.8 million TikTok followers, and her posts about beauty and exercise, along with opinions on topics ranging from dating to online bullying, regularly receive hundreds of thousands of views. TikTok has paid her a total of $12,000, Carter says. She sells merchandise for additional income, bringing in about $5,000 last year.
“Creators should be paid a fair percentage based on what the apps are making off creators,” says Carter. “There should be more transparency into how we’re paid, and it should be consistent.”
A TikTok spokeswoman declined to comment.
YouTube said it paid more than $70 billion to creators, artists and media companies in the past three years, and more than 25% of channels in the ad-revenue share model are now making money through it. “We remain committed to putting our full energy into what matters most for our creators, viewers and advertisers,” a spokeswoman said.
A future without TikTok?
Many creators and advertisers credit TikTok, which pioneered the short-form video genre, with driving stronger engagement than its industry peers. TikTok has gained more than 170 million users in the U.S. since its launch in 2016—including, Pew Research Center says, a third of American adults. They spend an average of 78 minutes a day on the app, according to market-intelligence firm Sensor Tower.
TikTok may not be available in the U.S. for much longer, at least not in its current form. In April, President Biden signed a bill into law that will force a sale or ban of the app by Jan. 19, 2025. U.S. lawmakers have expressed worries that TikTok poses a national security risk. TikTok’s parent company, Beijing-based ByteDance, has said it can’t and won’t sell its U.S. operations by the deadline.
ByteDance sued the U.S. government, alleging the new law violates its First Amendment rights. Several U.S. creators also sued. The U.S. Court of Appeals for the District of Columbia Circuit will hear arguments in September for both cases.
“To lose TikTok would be kind of devastating,” says Brandon Granberg , a 31-year-old creator from Bayville, N.J., known for interacting with strangers in public places in silly ways.
Granberg struggled for years to attract viewers on the app before one viral post two years ago took his follower count from 5,000 to more than one million. Recently he made $1,000 from a TikTok program that launched last year called TikTok Creative Challenge, which allows creators to earn money by making video ads for brands that don’t appear on their personal profiles. He also earned $2,800 for producing four TikTok videos promoting a website for people with foot fetishes. Granberg says he found it creepy, but did it because he needed the money.
While he hasn’t landed many other sponsored posts, he’s grown his income significantly by making marketing videos for small businesses over the past year. Most clients find Granberg on TikTok. “If it gets banned, it will definitely hurt me,” he says.
Changing tastes and algorithms
This year, U.S. social-media creators as a whole are expected to make $13.7 billion, according to Emarketer. The research firm projects the majority of that—$8.14 billion, or 59%—will come from brand sponsorships.
Advertisers have always led in compensating creators, paying out far more money than the social-media platforms and fans who buy merchandise or dole out tips. But these days, advertisers expect more from creators than just large followings, according to agency and talent representatives. They want to see evidence of strong engagement in the form of saved and shared posts, plus the demographics of creators’ audiences.
“Brands are looking at metrics that are far less predictable for creators and also very difficult to price yourself on,” says Sarah Peretz, a business-strategy consultant in Los Angeles who helps creators negotiate partnerships and deals with advertisers.
Some brands are more controlling than in the past, says Sarah Steele, a 34-year-old creator in Tulsa, Okla., who started making TikTok videos about being a working mom in 2020. “Now it’s, ‘We’re paying you and this is what we want you to say.’ ”
Earlier this year, Steele says an advertiser insisted she cite legal disclaimers in a series of sponsored Instagram posts. “It felt like I was reading off a teleprompter,” she says. “As a consumer it even turned me off to the brand a little bit.”
Creators, meanwhile, are having a tougher time attracting viewers, thanks to algorithm changes and other factors beyond their control. And while more advertisers are looking to partner with creators than in the past, “increased activity leads to increased competition,” says Peretz.
Another change is that advertisers now prefer to work with just a handful of creators on long-lasting deals rather than experiment with several on one-off projects, says Jess Hunichen, of Shine Talent Group.
Hunichen co-founded the talent-management agency in 2015, when TikTok didn’t exist and influencer marketing was still relatively new. Back then, an average deal size between an influencer and brand was usually below $1,000. Now, the average deal per campaign is around $10,000, she says.
Worth the hustle
Ronit Halmos of Los Angeles began making TikTok videos earlier this year that she describes as quick-reviews of restaurants, bars and more “with some sass and attitude.”
The 27-year-old, a full-time technology recruiter, recently landed her first advertiser deal. A kombucha brand asked her to make a 30-second post featuring her take on a line of flavours. Though it ended up getting less attention from viewers than her usual fare, she made $1,500 from about 30 minutes of work.
Tyler Haven , a 27-year-old traveling around the Pacific Northwest, charges $250 to $300 to make promotional videos that brands can post to their own social channels, and around $1,200 for posts that appear on either his Instagram account with more than 41,000 followers or his TikTok account with more than 10,000 followers.
Since January, he’s been posting videos documenting his “van-life” with his wife, Oak Haven: Their primary residence is a fully paid, fully decked-out 2004 Mercedes Sprinter T1N.
Haven said it’s been easy to grow his following organically. He believes it’s because his posts don’t depict some unattainable, picture-perfect life.
He quit his job in June to pursue full-time content creation.
“Even if I were to make $2,000 a month, which is absolutely nothing—that’s less than most people’s rent—I could live on that,” Haven says.

 Copyright 2020, Dow Jones & Company, Inc. All Rights Reserved Worldwide. LEARN MORE





A record-breaking $11 million sale at The Centennial Collection has set a new benchmark for luxury apartment living in Bondi Junction.

As interest rates, inflation and market sentiment fluctuate, investors are being urged to focus on data, not panic.


The Federal Budget may have softened some of its proposed tax reforms, but it has exposed a bigger issue: too many families are relying on wealth structures that no longer reflect the realities of modern life.
3 min
For many Australians, the 2026 Federal Budget initially felt like a direct challenge to the way wealth is created, held and transferred between generations.
The headlines were immediate: changes to capital gains tax, reforms to discretionary trusts, restrictions on negative gearing and increased scrutiny of investment structures. Unsurprisingly, affluent families, business owners and investors began asking the same question:
Is the way we hold our wealth still fit for purpose?
In recent days, the government has announced several significant amendments following industry consultation and public feedback, including exempting testamentary trusts from the proposed 30 per cent minimum tax and expanding capital gains tax concessions for small businesses.
The backdown is welcome. But it also highlights something much bigger.
This Budget has accelerated a conversation that many Australian families have been postponing for years.
The conversation is not really about tax. It is about wealth stewardship.
For decades, Australians have built wealth through businesses, property, investments and careful long-term planning. Yet many families have not revisited the legal structures surrounding those assets in years, sometimes decades.
We often see clients who have spent years building significant wealth, only to discover their legal arrangements no longer reflect their current circumstances.
Their children are now adults. They may own multiple properties.
They may have sold a business, entered a second marriage, become grandparents or accumulated digital assets that did not exist when their original estate plans were prepared.
The trust that distributes income may need to be reconsidered. The bucket company may no longer be so attractive.
The Budget has simply exposed a reality that already existed: wealth structures cannot remain static while life continues to evolve.
Importantly, trusts themselves are not the issue.
Trusts are legitimate planning tools that provide flexibility, protection and continuity. When used appropriately, they allow families to adapt to changing circumstances over time.
And neither is tax the issue, really. Getting the fundamentals right is more important for long-term, sustainable wealth than a few favourable tax treatments around the edges.

The real issue is complacency.
Too often, families create structures and assume the job is done. It isn’t.
Estate planning is no longer a document you sign once and file away in a drawer. It is an ongoing process that should evolve alongside your life.
We are also seeing a broader shift in how Australians define wealth itself. It is no longer just the family home and an investment portfolio.
Modern wealth includes businesses, digital assets, cryptocurrency, intellectual property, frequent flyer points and increasingly complex family arrangements.
At the same time, Australians are living longer than ever before, meaning wealth may need to support multiple generations simultaneously. This creates new responsibilities and new risks.
How do you help your children enter the property market without exposing family wealth to relationship breakdowns?
How do you structure wealth so that it remains a source of opportunity rather than future conflict?
These are the questions families should be asking now.
The recent debate surrounding testamentary trusts also serves as an important reminder that policy decisions can have unintended consequences for vulnerable Australians. It is encouraging that the government has listened to feedback and clarified its position.
But the lesson remains: the wealth landscape is changing.
Increasingly, governments, regulators and tax authorities are paying closer attention to how wealth is held and transferred. That means families cannot afford to adopt a “set-and-forget” approach to their structures.
The families who will be best placed for the future are not necessarily those with the greatest wealth.
They are the families with the greatest clarity. Clarity around ownership, succession and governance. And clarity around how wealth will transition from one generation to the next.
Ultimately, preserving wealth is not about avoiding change.
It is about preparing for it.
Because the greatest risk is not change itself.
It is losing the ability to respond to it.
Anthony Hunt is Co-Founder of Wealth Lawyers and former COO of Westpac Private Bank. He advises business owners, investors and affluent Australian families on wealth protection, succession planning and intergenerational wealth transfer

In the lead-up to the country’s biggest dog show, a third-generation handler prepares a gaggle of premier canines vying for the top prize.

Now complete, Ophora at Tallawong offers luxury finishes, 10-year defect insurance and standout value from $475,000.