Eurozone Inflation Picks Up Pace in Blow to Rate-Cut Hopes
Consumer prices were 2.6% higher on year in July, picking up pace from 2.5% in June

 < 1 min
Inflation unexpectedly heated up in the eurozone this month, presenting a fresh challenge to policymakers looking for signs that eurozone price rises are easing sustainably.
Consumer prices were 2.6% higher on year in July, picking up pace from in June, according to EU figures released Wednesday. That defied economists’ expectations for a slight decrease in inflation over the month, and leaves the rate further from the European Central Bank’s elusive 2% target. Inflation heated up over the month in Germany, France and Italy, the eurozone’s three largest economies.
Core inflation, which strips out the often volatile effects of food and energy prices, meanwhile stayed stable, against expectations for a slight decrease. But services, a key focus for policymakers at the European Central Bank, did fall slightly.
That decline makes a cut to interest rates the most likely outcome in September, said Franziska Palmas, an economist at Capital Economics.
Still, the higher headline rate may give pause to the central bank as it mulls its next steps on the direction of interest rates in the 20-member eurozone.
The ECB cut interest rates in the currency union for the first time in five years last month, but has refused to be drawn on when and how quickly it will continue to lower rates from their current heights. Markets still expect a second cut to rates at the bank’s next policy meeting in September, but with less certainty than earlier in the summer.
“Until services inflation falls more significantly, the ECB is likely to continue to ease policy only slowly,” Palmas said.
 Copyright 2020, Dow Jones & Company, Inc. All Rights Reserved Worldwide. LEARN MORE




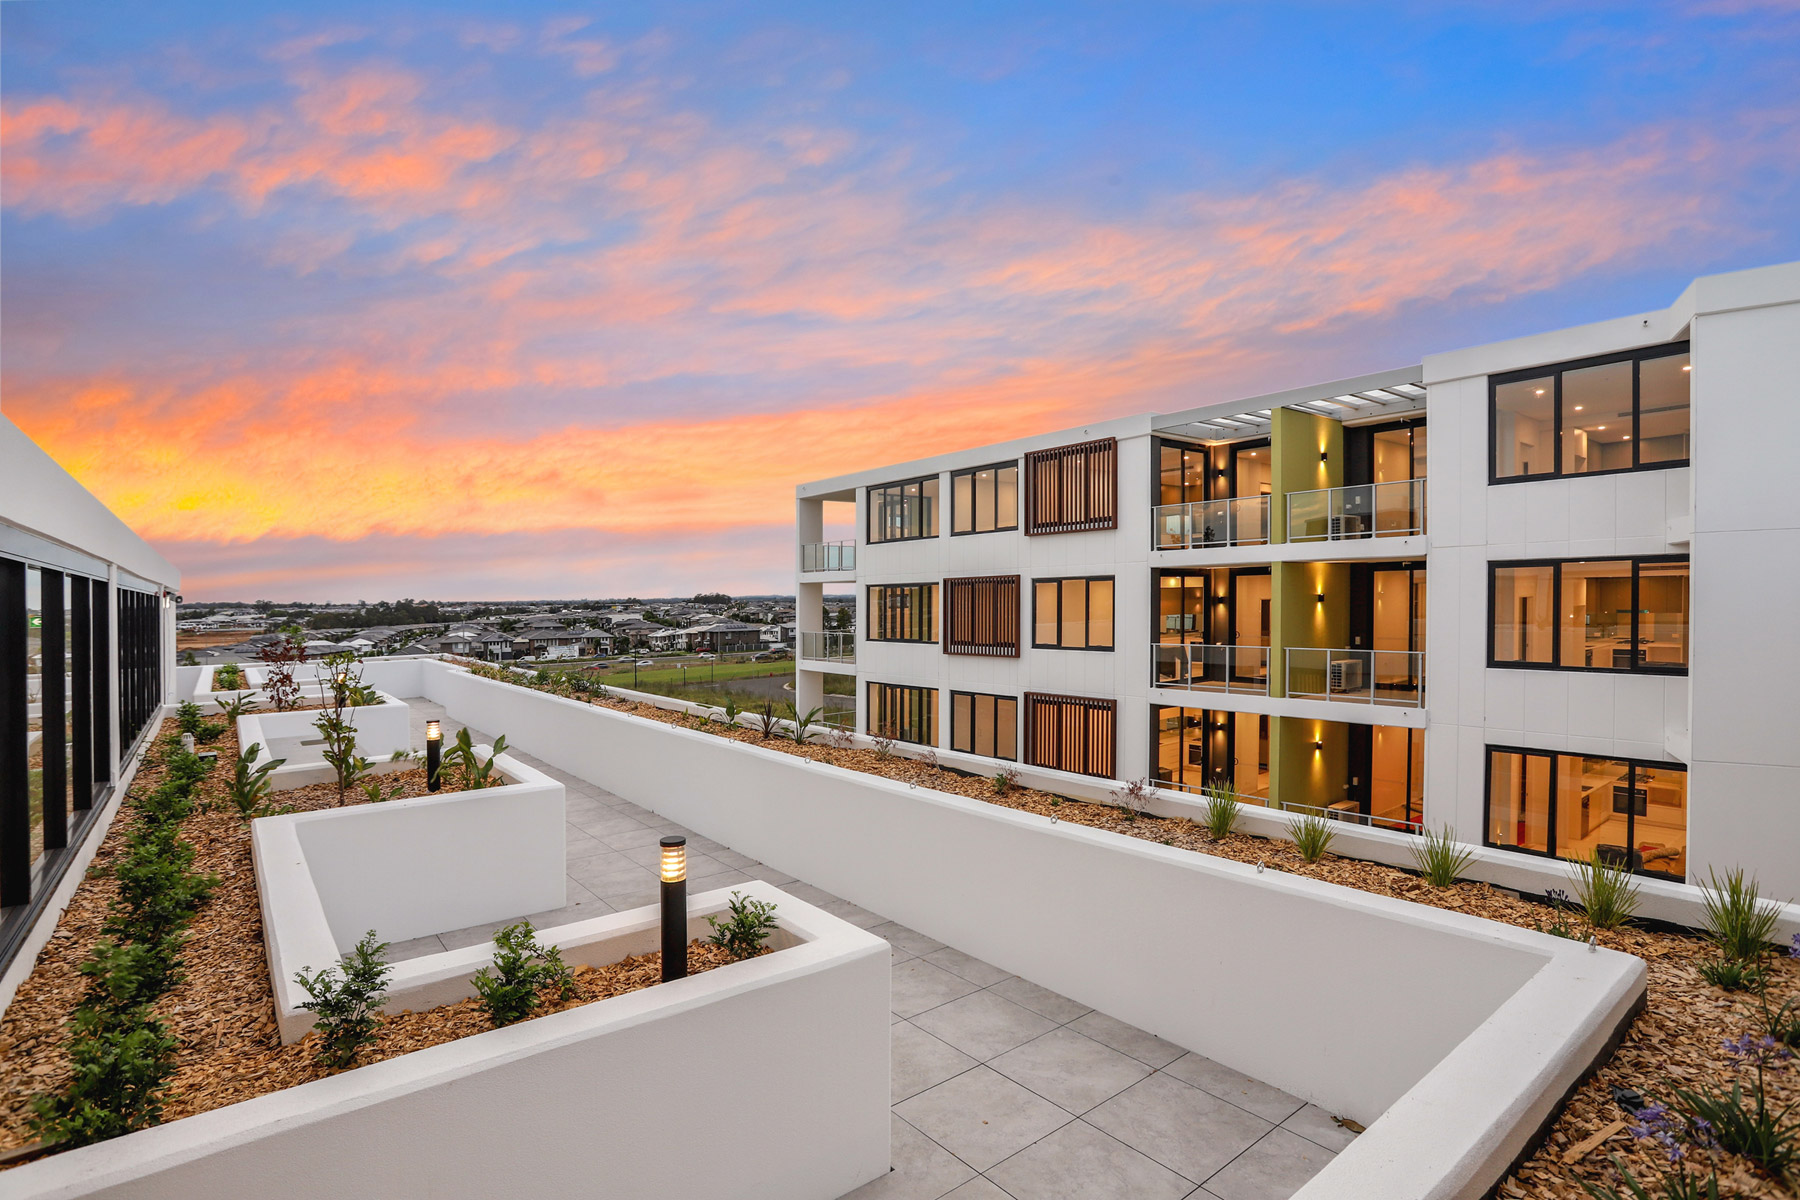
Ophora Tallawong has launched its final release of quality apartments priced under $700,000.
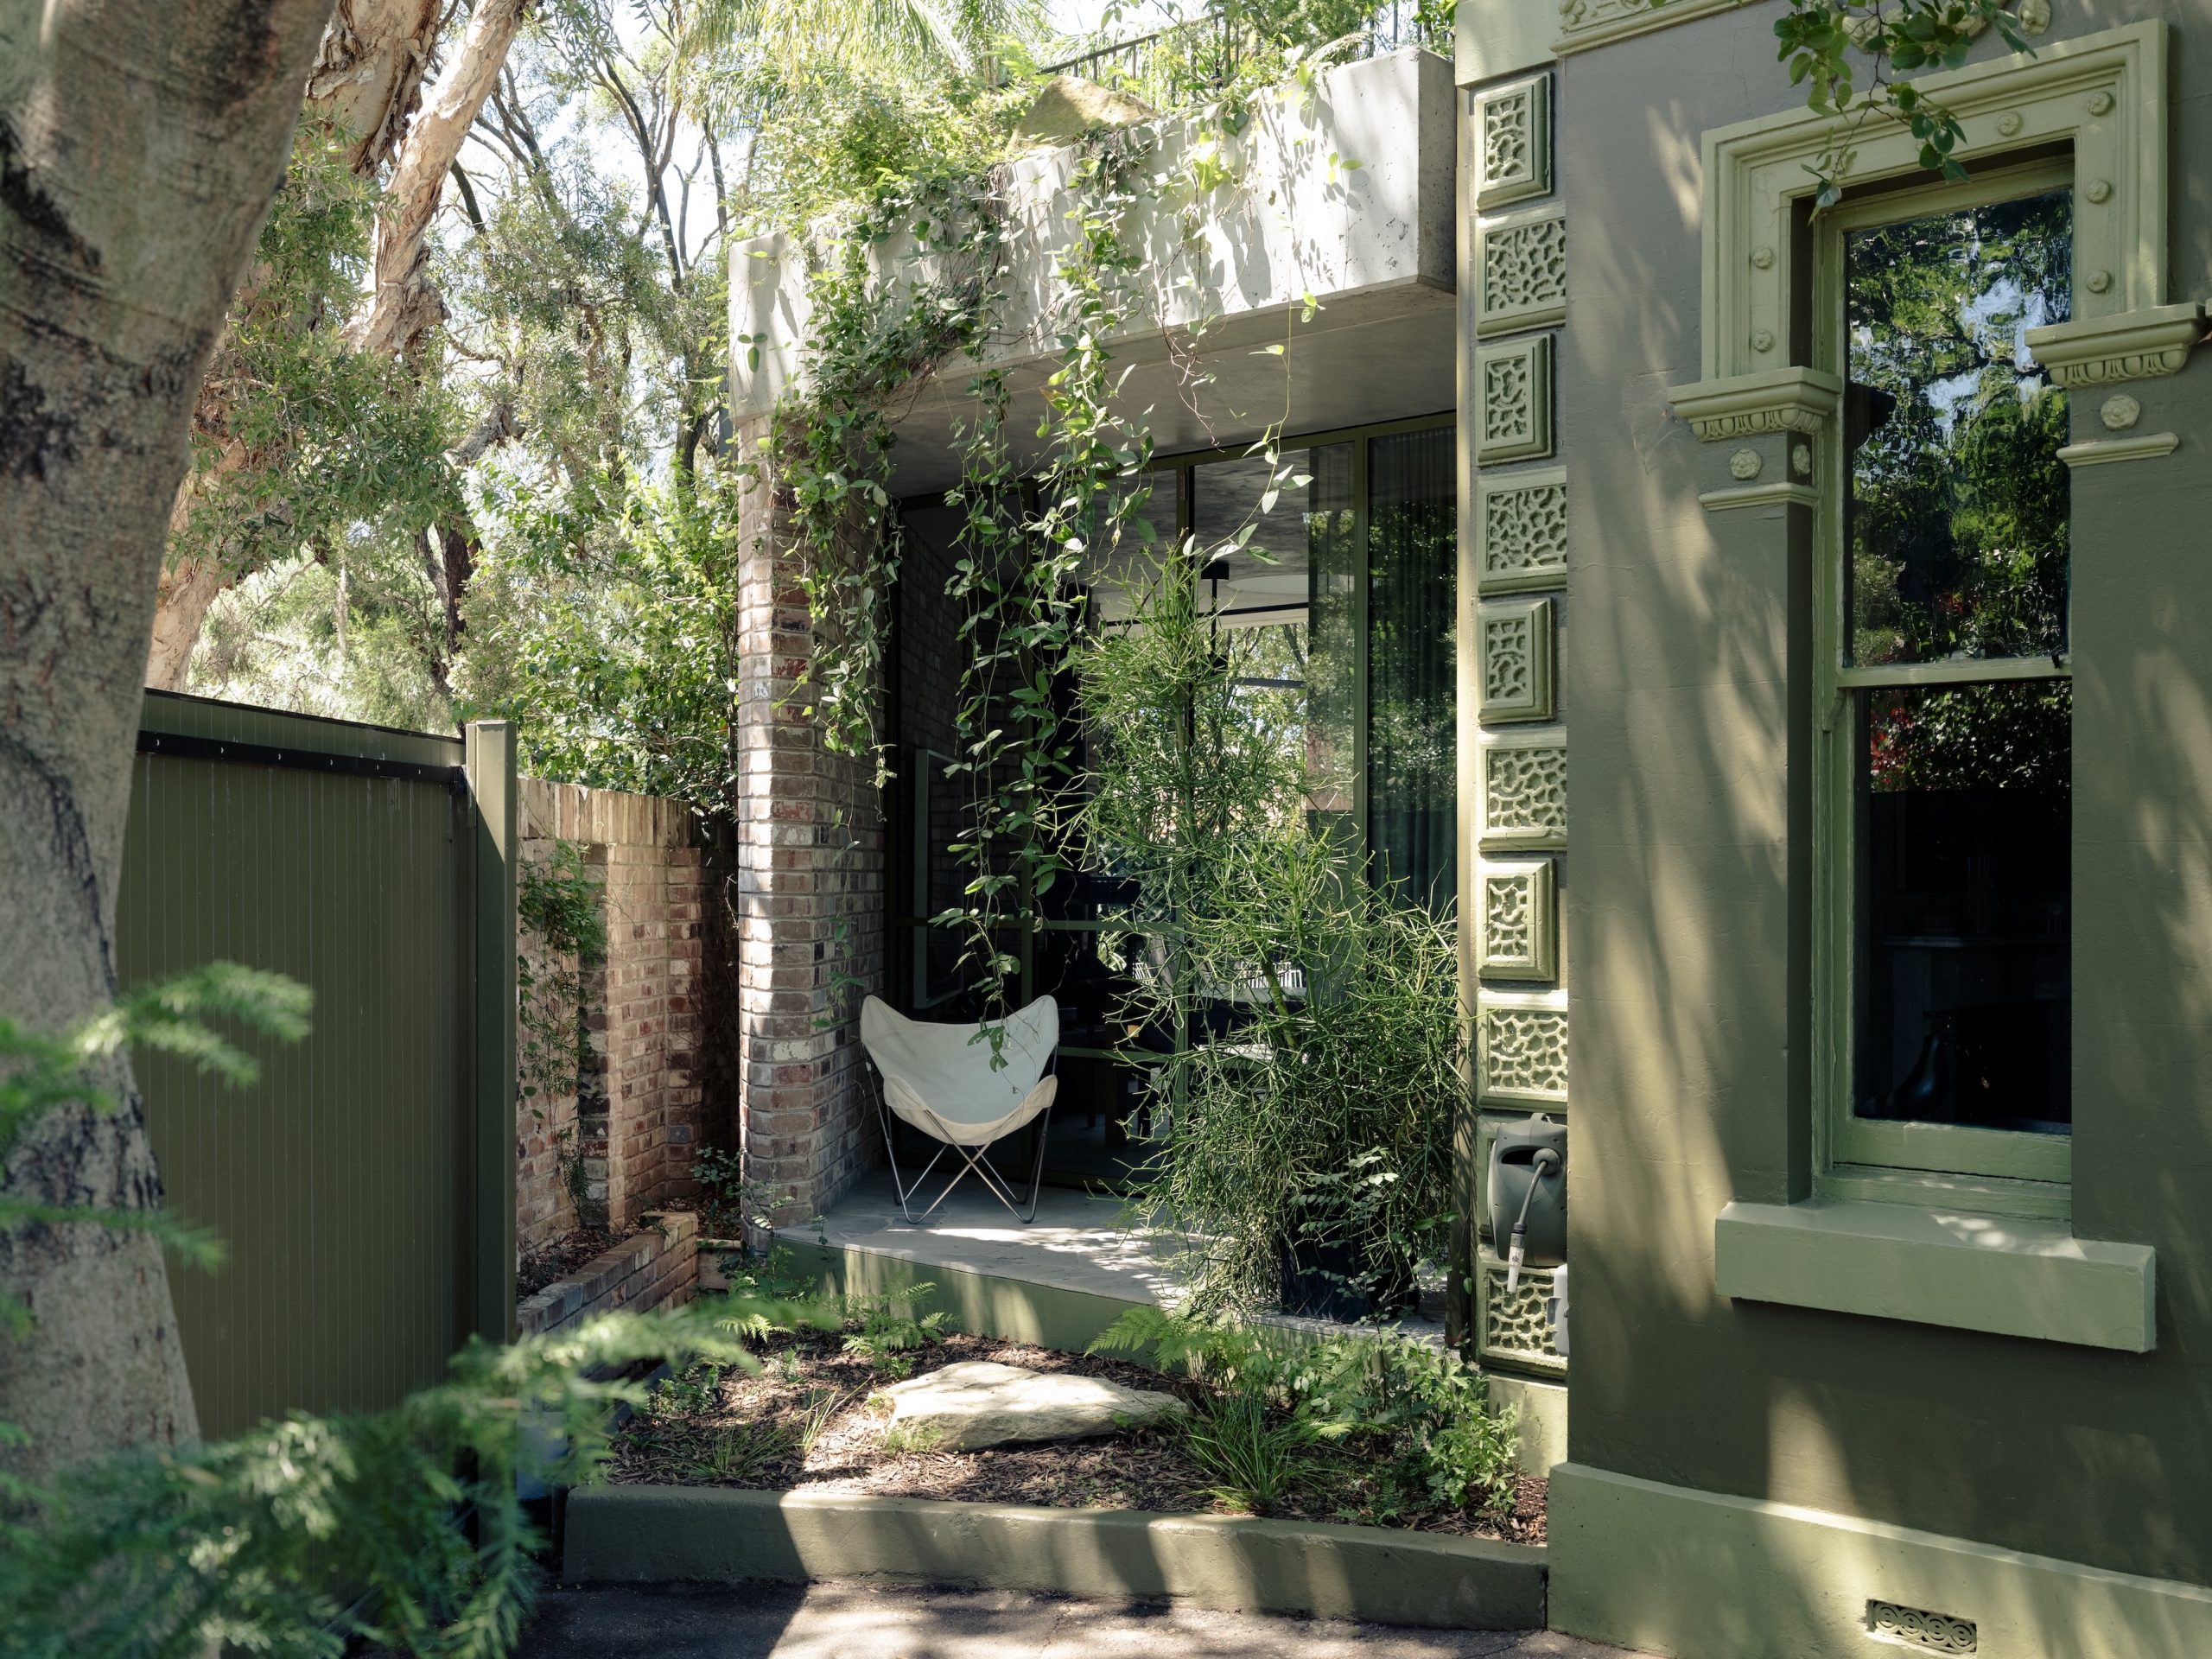
From bushland greens to valley reds, the country’s most awarded designers are proving that the best colour palette was never on a swatch card; it was outside the window all along.


The federal budget has rattled property investors. But the biggest mistake isn’t the tax changes, it’s the conclusion many are drawing from them.
2 min
The recent budget has forced a reckoning for property investors.
Negative gearing now restricted to new residential builds, the CGT discount gone and on paper, the numbers look different.
And many investors are responding by pivoting toward yield, prioritising cash flow over capital growth in a way that property strategists say misses the point entirely.
“The debate has shifted to yield versus growth as if they are opposing forces,” says Abdullah Nouh, founder of Melbourne-based buyers’ agency Mecca Property Group. “But that framing is itself the mistake.”
Nouh, who works with high-net-worth families and investors on long-term acquisition strategy, argues that capital growth remains the primary driver of genuine wealth creation and that the post-budget environment has made quality assets more important, not less.
The numbers make his case plainly. An additional $500 per week in rental income is welcome. A prestige asset appreciating by $1 million over a market cycle is transformative.
These are not equivalent outcomes, and portfolios built around yield at the expense of location and land value tend to generate income while wealth stands largely still.
The more nuanced shift Nouh is seeing among sophisticated investors is a move toward assets where both outcomes can be engineered simultaneously – established homes on substantial land in quality locations, where the existing dwelling can be repositioned, rental returns improved, and the underlying land value compounds independent of what sits on it.
For investors with existing equity, commercial property is also entering the conversation in a more serious way.
Prestige industrial assets, medical centres and long-leased essential retail offer income profiles that residential property in most capital city markets cannot currently match: longer lease terms, tenants covering outgoings, and greater predictability than the residential tenancy cycle.
“The investors who build lasting wealth are rarely the ones who chased yield or growth exclusively,” says Nouh.
“They are the ones who built a strategy they could sustain – one that generated enough income to hold quality assets through multiple cycles while those assets compounded in value.”
The budget has changed the settings. It has not changed the fundamentals.

In the lead-up to the country’s biggest dog show, a third-generation handler prepares a gaggle of premier canines vying for the top prize.

A&K Sanctuary unveils Kitirua Plains Lodge, a sustainability-focused luxury property shaped by landscape, local craft and contemporary safari architecture.