Number of Crypto Millionaires Doubled to 172,300 Over the Last Year, Study Finds

 2 min
2 min
The number of crypto millionaires has doubled in the last year, as key regulatory approvals and a new Bitcoin high led to a rapid increase in crypto adoption and a new “crypto elite,” according to a report by wealth and migration consultancy Henley & Partners.
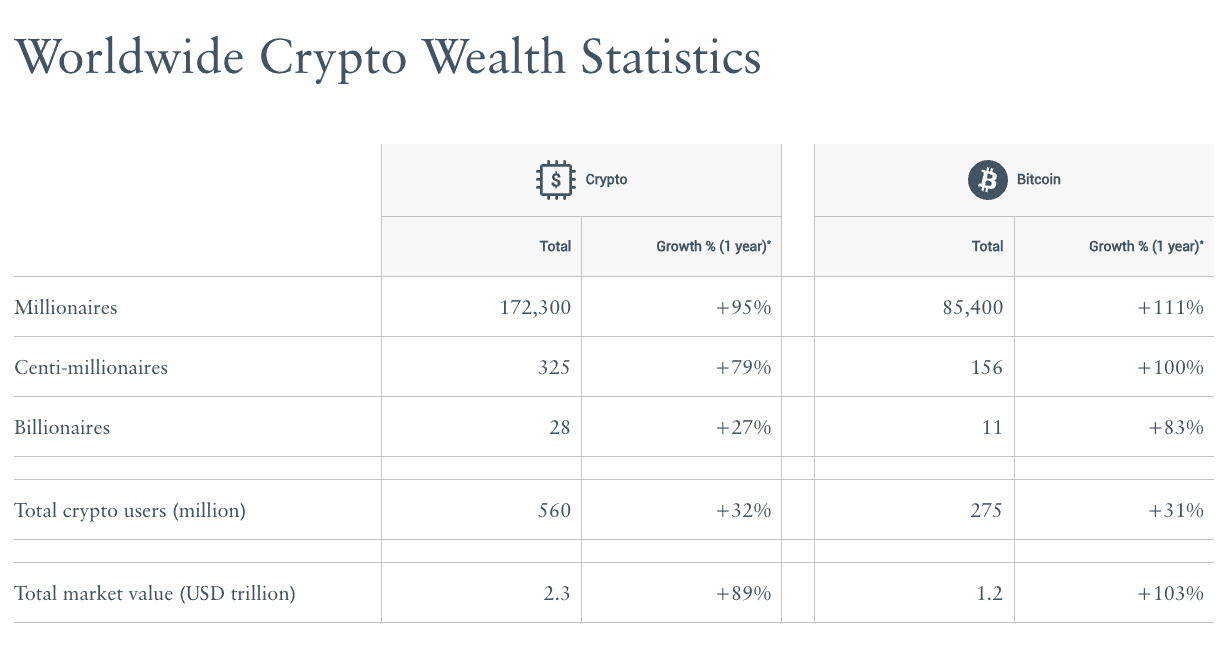
Crypto adoption increased 31% in the 12 months ending in June, to a total of 560 million users globally, while the total market value of crypto holdings nearly doubled to US$2.3 trillion as of June 30. Bitcoin, which peaked in March at US$73,000, comprised about half of both users and value, with 275 million investors and a US$1.2 trillion total market value, up 103% from the previous year, the report said.
The surge in both price and adoption of cryptocurrencies has minted a new crop of millionaires.
In fact, the number of crypto millionaires just about doubled to 172,300 in the last 12 months, and the number of Bitcoin millionaires more than doubled to 85,400—or roughly half of the overall total.
There are also now 325 crypto centi-millionaires—individuals with crypto holdings of at least US$100 million—up from 181 last year, with Bitcoin investors, once again, comprising about half of the total.
Crypto currencies have also minted 28 billionaires, a list that includes the Winklevoss twins—Brett and Cameron Winklevoss;SecondMarket founder Barry Silbert ; MicroStrategy co-founder Michael Saylor ; and Binance founder Changpeng Zhao , who is currently serving a four-month prison sentence after being found guilty of money laundering by a California court earlier this year, according to MarketWatch.
The increase has largely been driven by regulatory shifts that have allowed for the normalisation of cryptocurrencies, despite the high-profile implosion of key crypto players like FTX and Genesis Global Capital in 2022 and 2023. In particular, the U.S.’s’ approval of spot crypto exchange-traded funds in January (following its approval of crypto futures ETFs) signalled a new era of institutionalisation.
“The long-awaited approval of spot Bitcoin and Ethereum ETFs in the USA unleashed a torrent of institutional capital,” Dominic Volek of Henley & Partners said in the report.
The U.S. ranked fourth in Henley & Partners’ analysis of global crypto hubs, which takes into account regulation, infrastructure adoption, technology prowess, and tax-friendliness, among other factors. Singapore leads the list due to its recent implementation of a regulatory framework for crypto assets, as well as its strength in infrastructure, technology, and economic indicators. Hong Kong, which also approved spot crypto ETFs in January, came second, followed by the United Arab Emirates, which scored highest on tax-friendliness.
Competition between global economic hubs is crucial, because the rise of the crypto elite is driving wealth migration patterns, Henley & Partners said.
“As we move forward, the intersection of cryptocurrency and investment migration will undoubtedly play a major role in shaping the future of global wealth and mobility,” Volek said.
 Copyright 2020, Dow Jones & Company, Inc. All Rights Reserved Worldwide. LEARN MORE




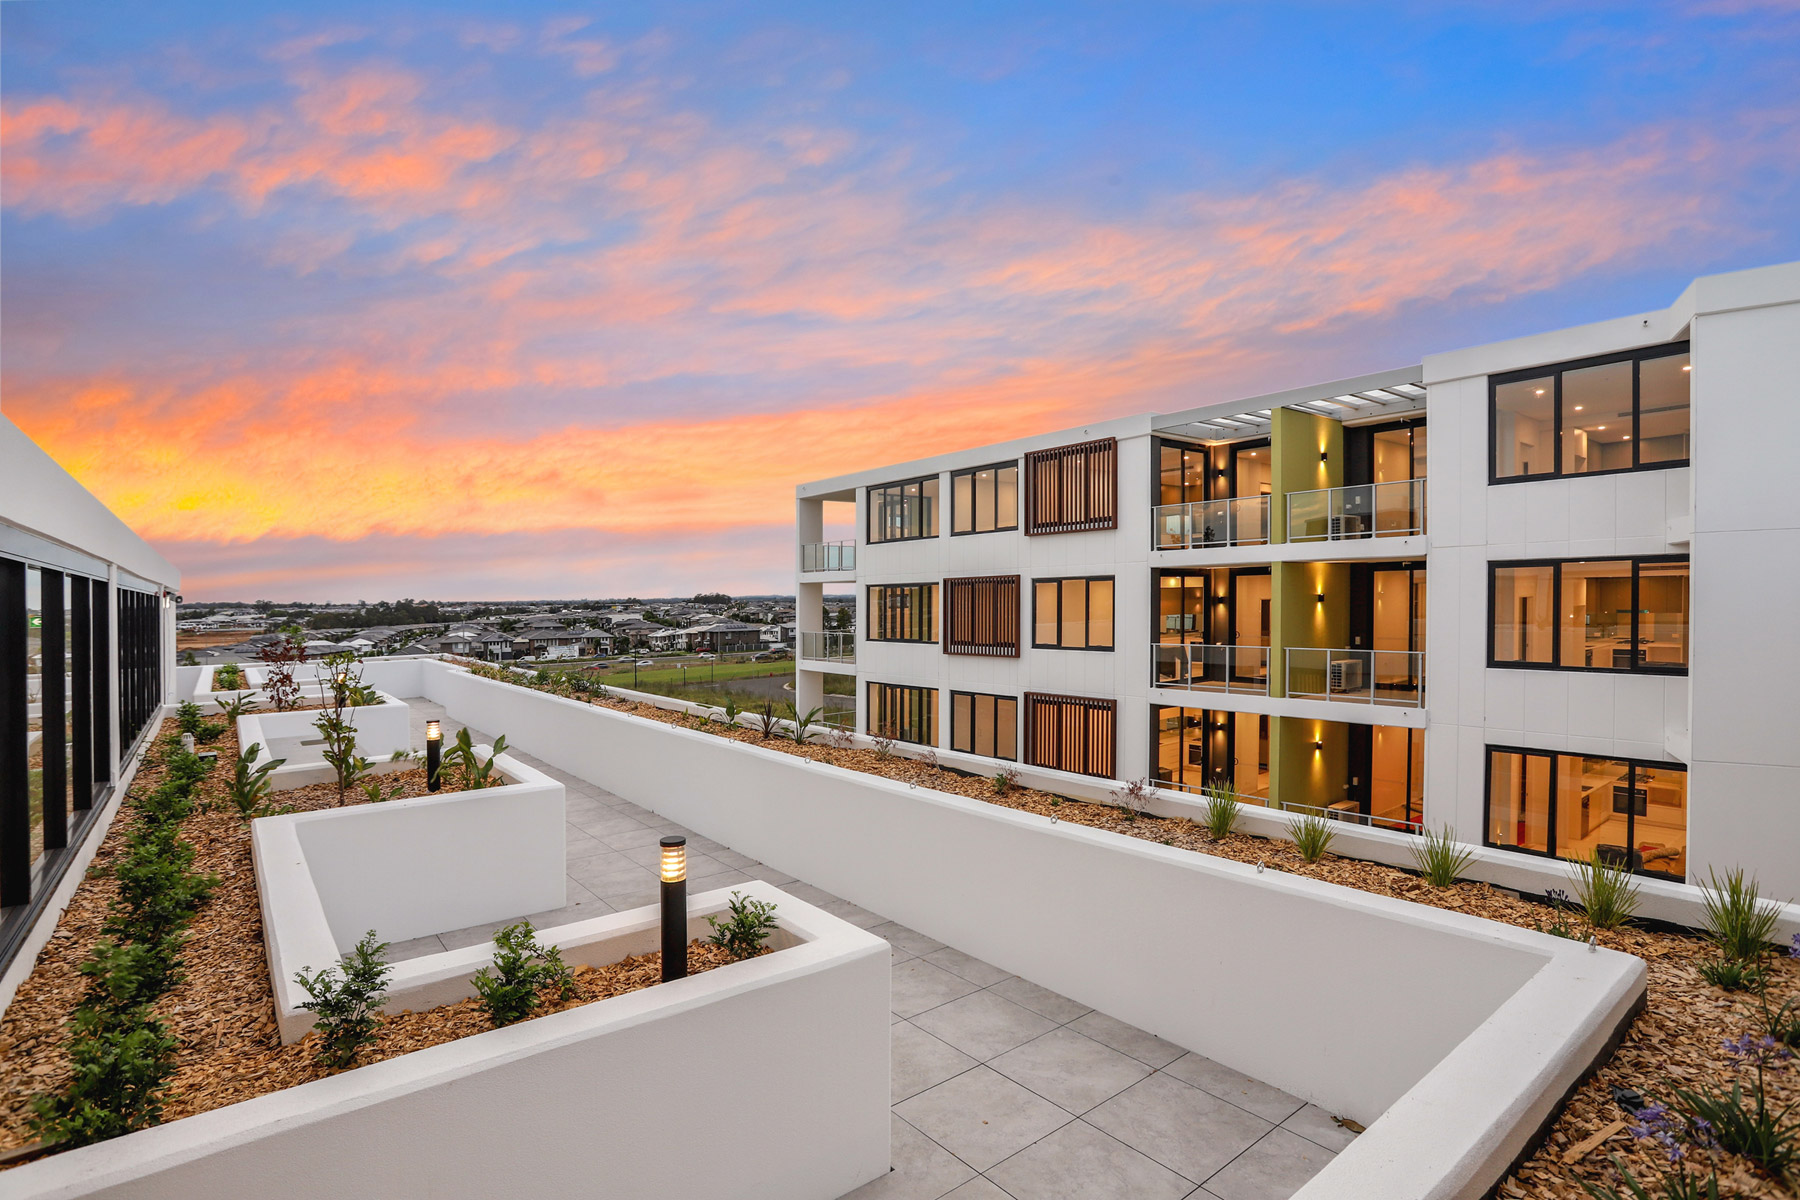
Ophora Tallawong has launched its final release of quality apartments priced under $700,000.
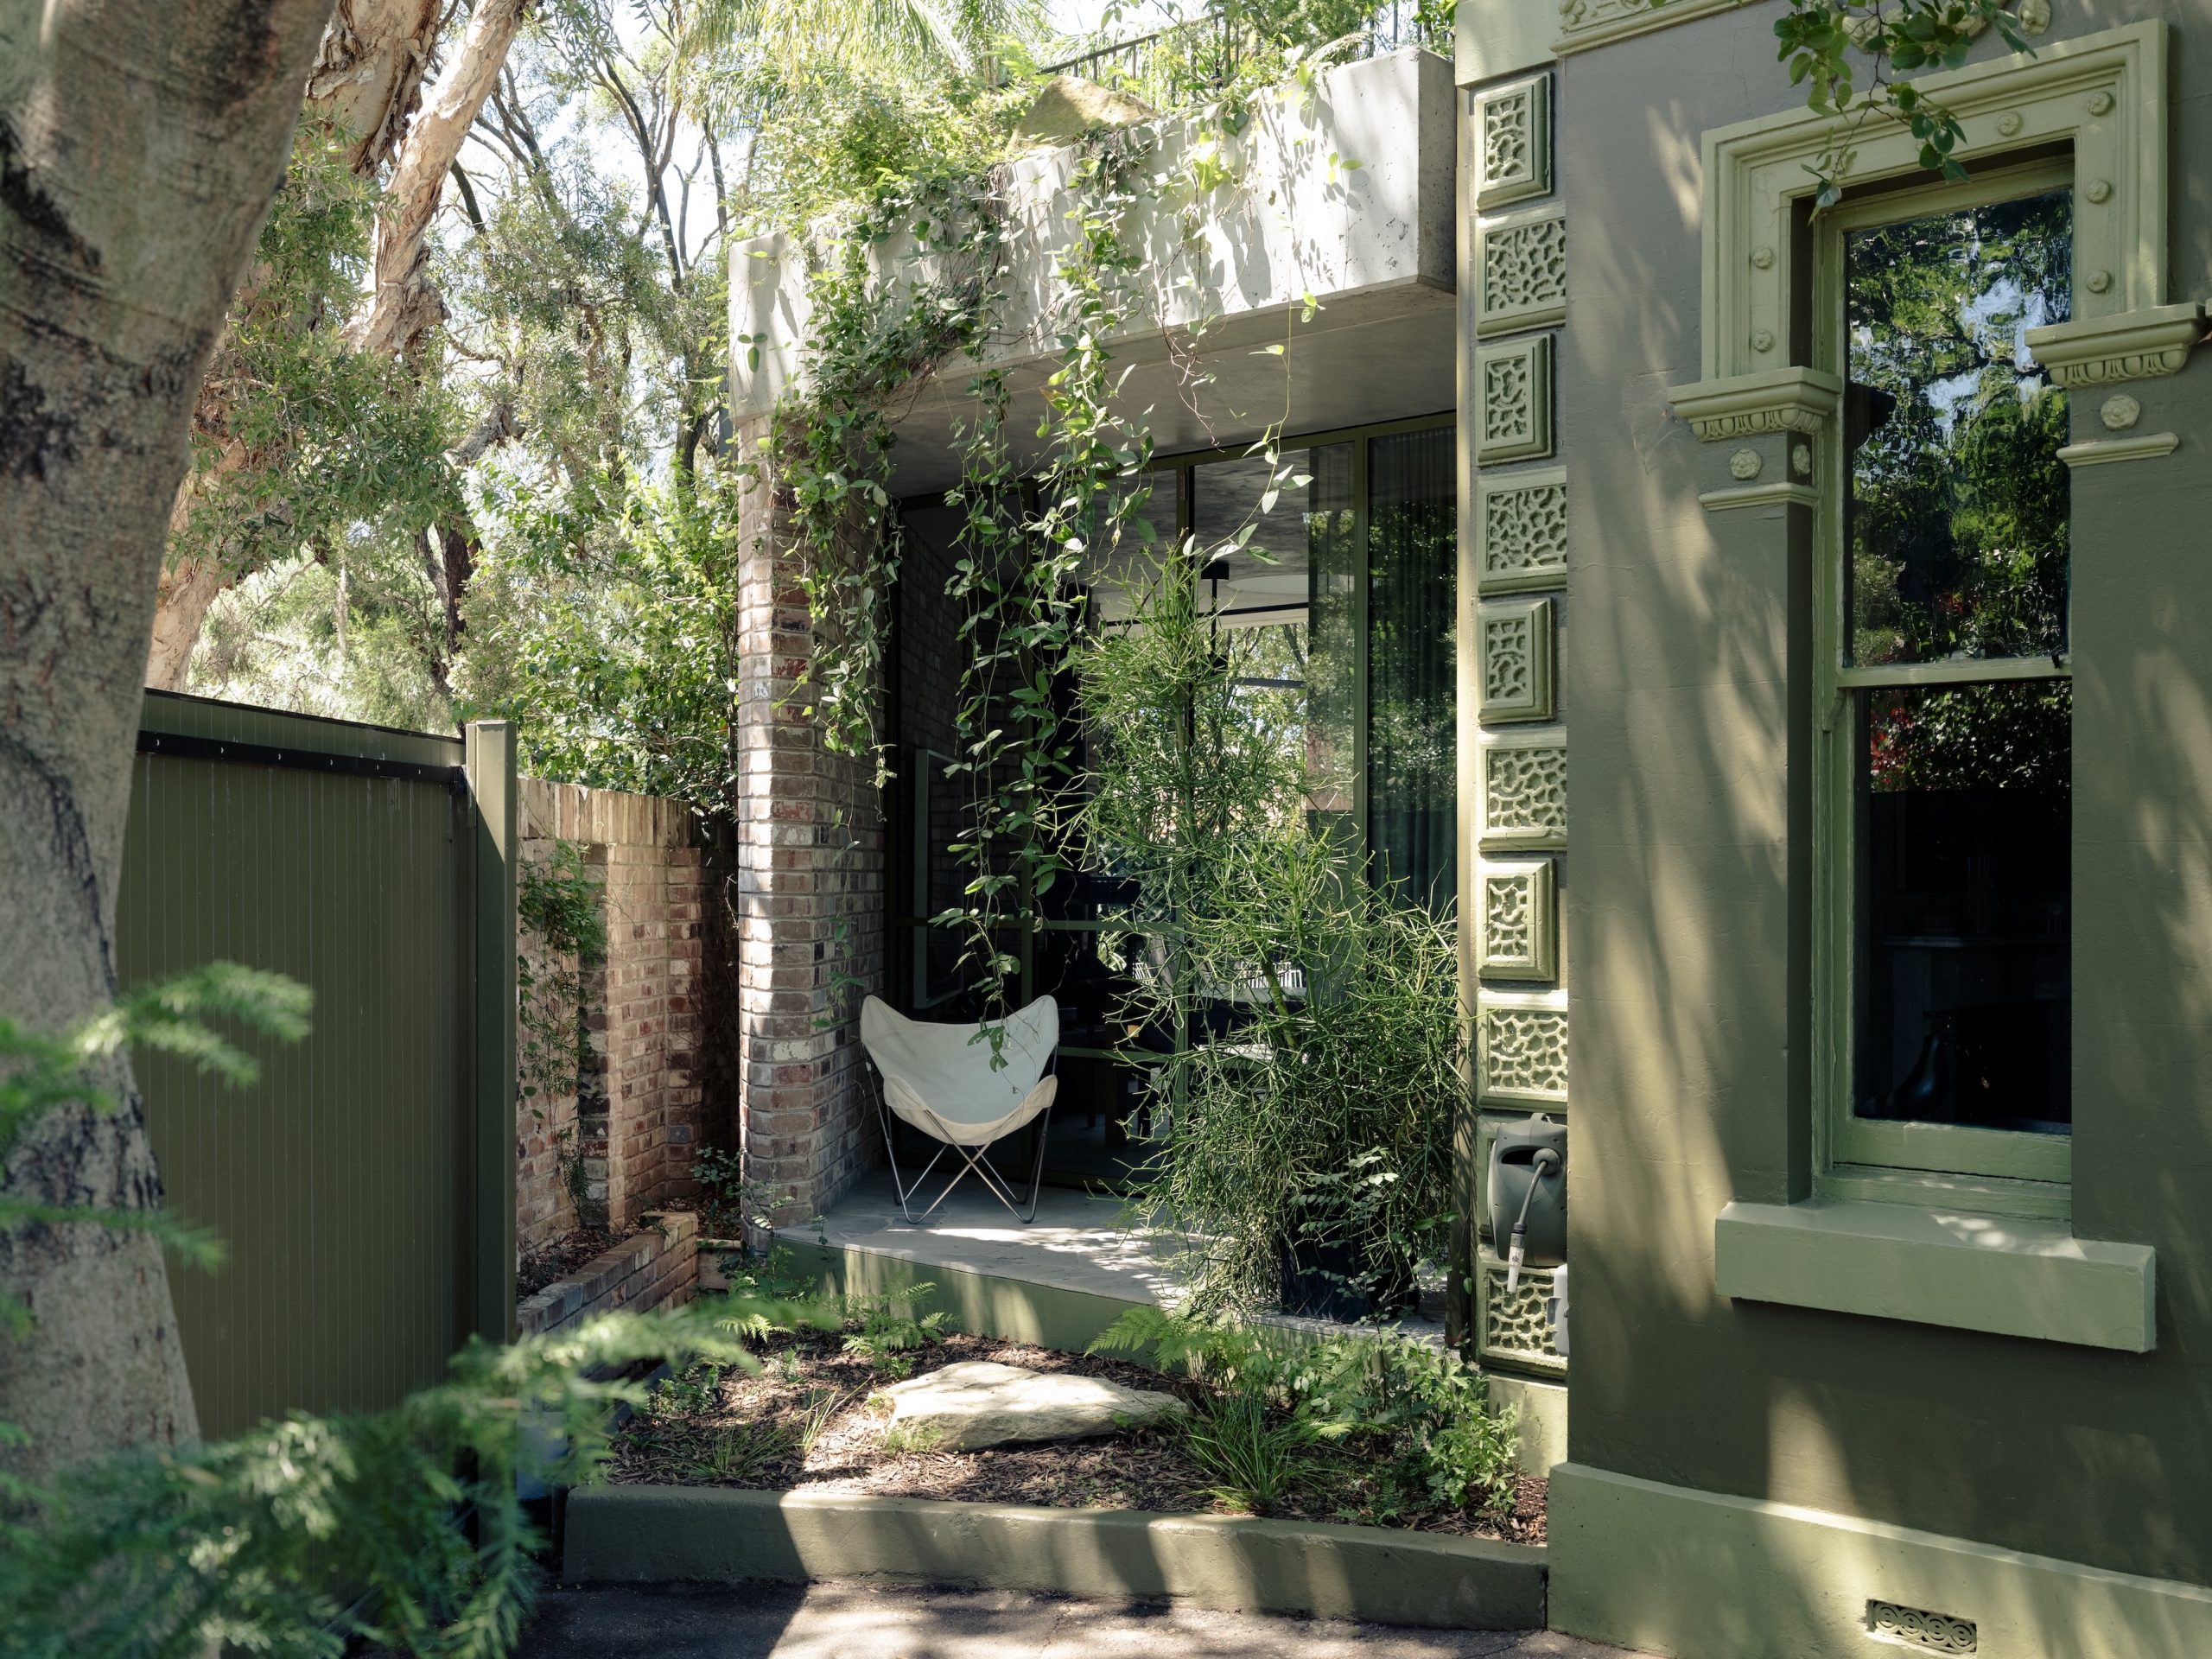
From bushland greens to valley reds, the country’s most awarded designers are proving that the best colour palette was never on a swatch card; it was outside the window all along.
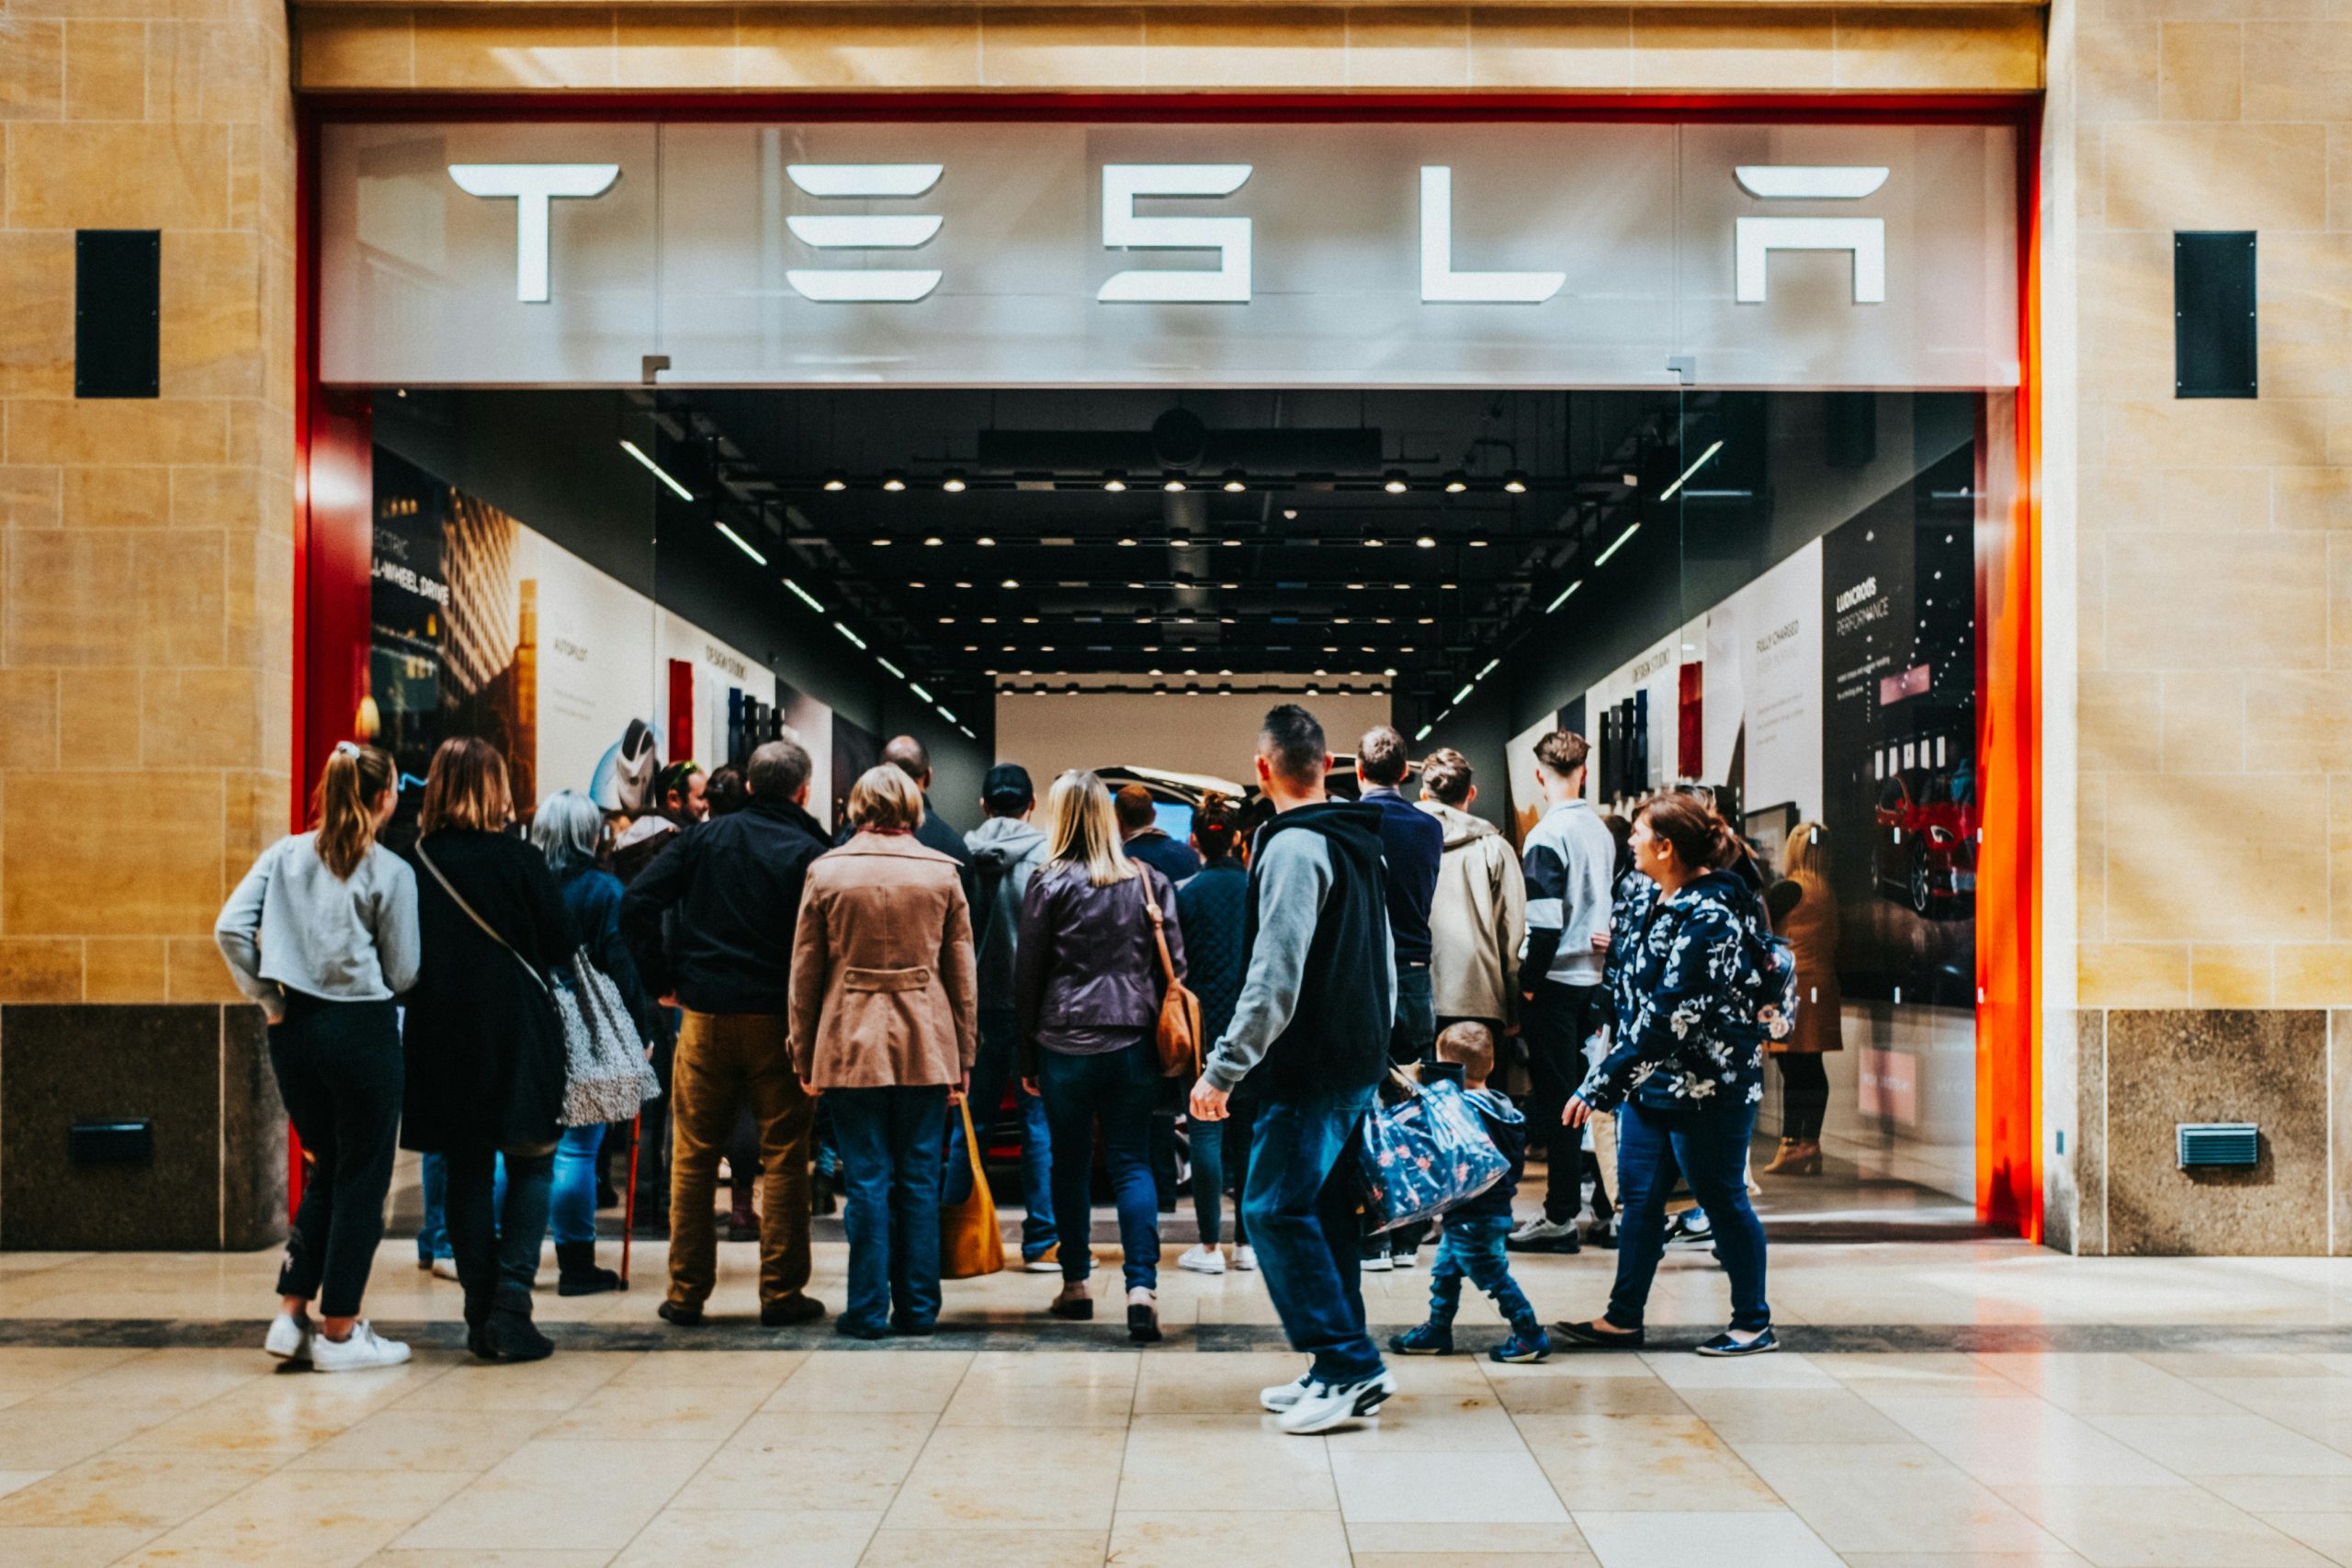

The federal budget has rattled property investors. But the biggest mistake isn’t the tax changes, it’s the conclusion many are drawing from them.
2 min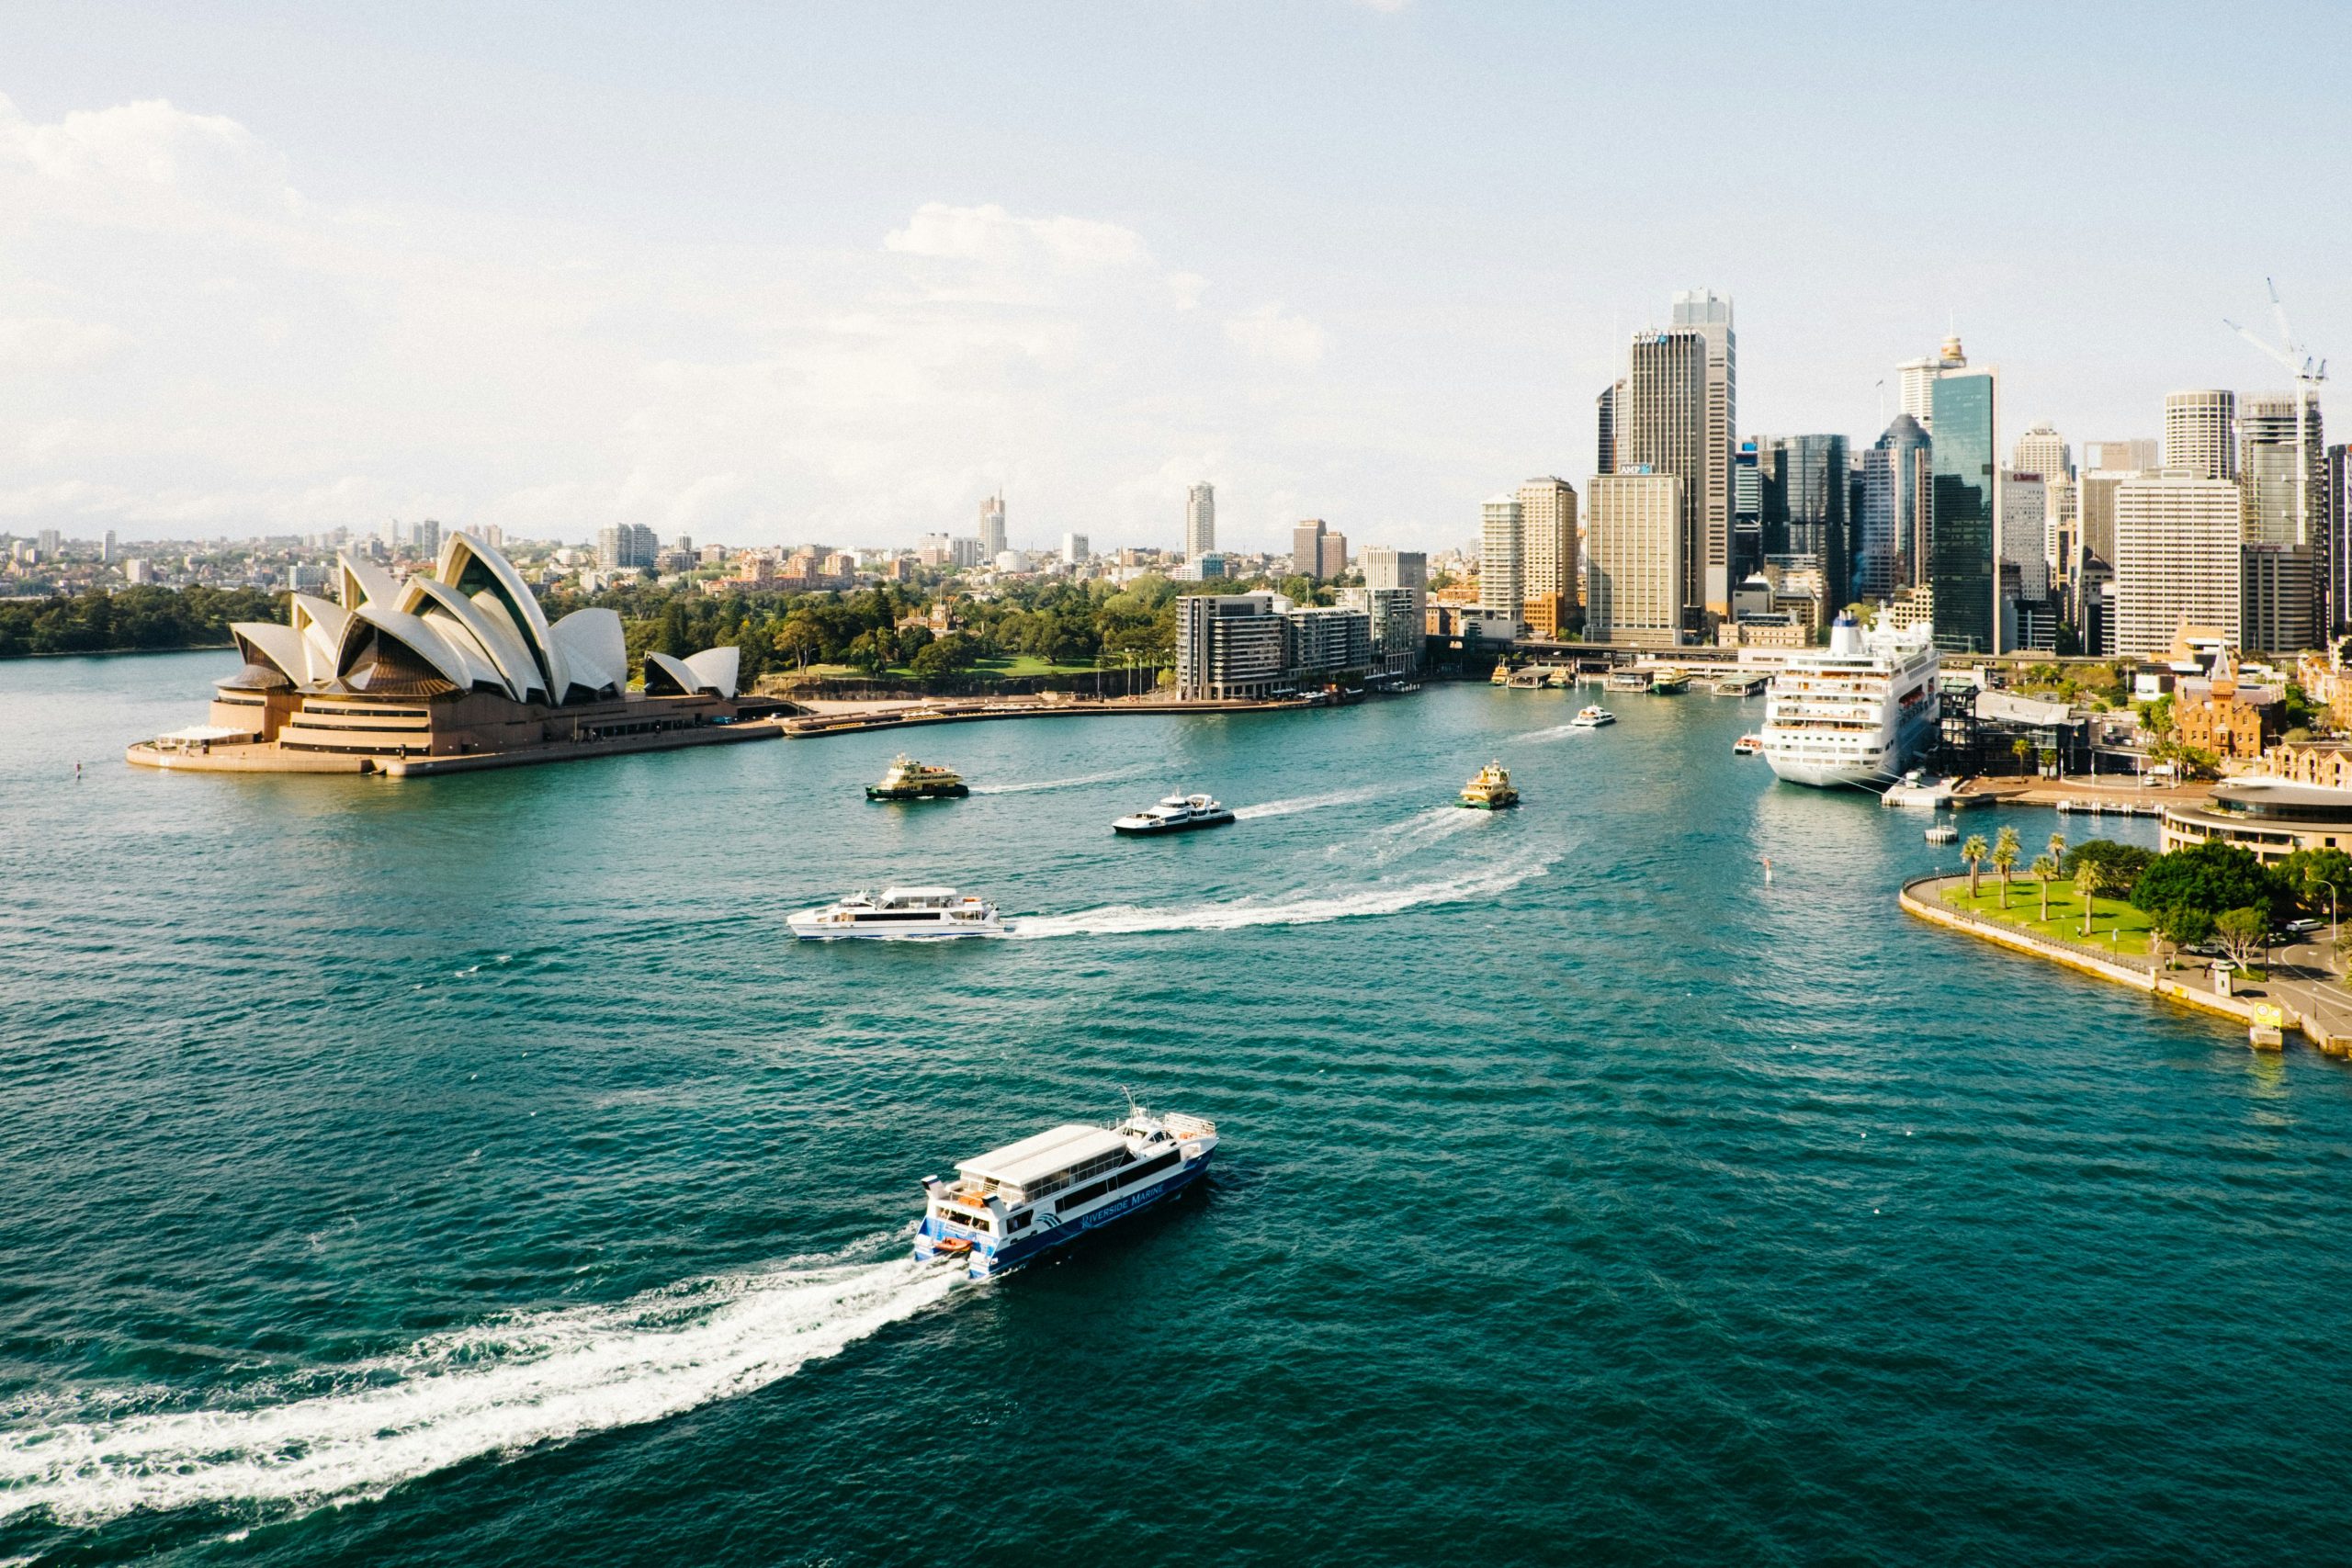
The recent budget has forced a reckoning for property investors.
Negative gearing now restricted to new residential builds, the CGT discount gone and on paper, the numbers look different.
And many investors are responding by pivoting toward yield, prioritising cash flow over capital growth in a way that property strategists say misses the point entirely.
“The debate has shifted to yield versus growth as if they are opposing forces,” says Abdullah Nouh, founder of Melbourne-based buyers’ agency Mecca Property Group. “But that framing is itself the mistake.”
Nouh, who works with high-net-worth families and investors on long-term acquisition strategy, argues that capital growth remains the primary driver of genuine wealth creation and that the post-budget environment has made quality assets more important, not less.
The numbers make his case plainly. An additional $500 per week in rental income is welcome. A prestige asset appreciating by $1 million over a market cycle is transformative.
These are not equivalent outcomes, and portfolios built around yield at the expense of location and land value tend to generate income while wealth stands largely still.
The more nuanced shift Nouh is seeing among sophisticated investors is a move toward assets where both outcomes can be engineered simultaneously – established homes on substantial land in quality locations, where the existing dwelling can be repositioned, rental returns improved, and the underlying land value compounds independent of what sits on it.
For investors with existing equity, commercial property is also entering the conversation in a more serious way.
Prestige industrial assets, medical centres and long-leased essential retail offer income profiles that residential property in most capital city markets cannot currently match: longer lease terms, tenants covering outgoings, and greater predictability than the residential tenancy cycle.
“The investors who build lasting wealth are rarely the ones who chased yield or growth exclusively,” says Nouh.
“They are the ones who built a strategy they could sustain – one that generated enough income to hold quality assets through multiple cycles while those assets compounded in value.”
The budget has changed the settings. It has not changed the fundamentals.
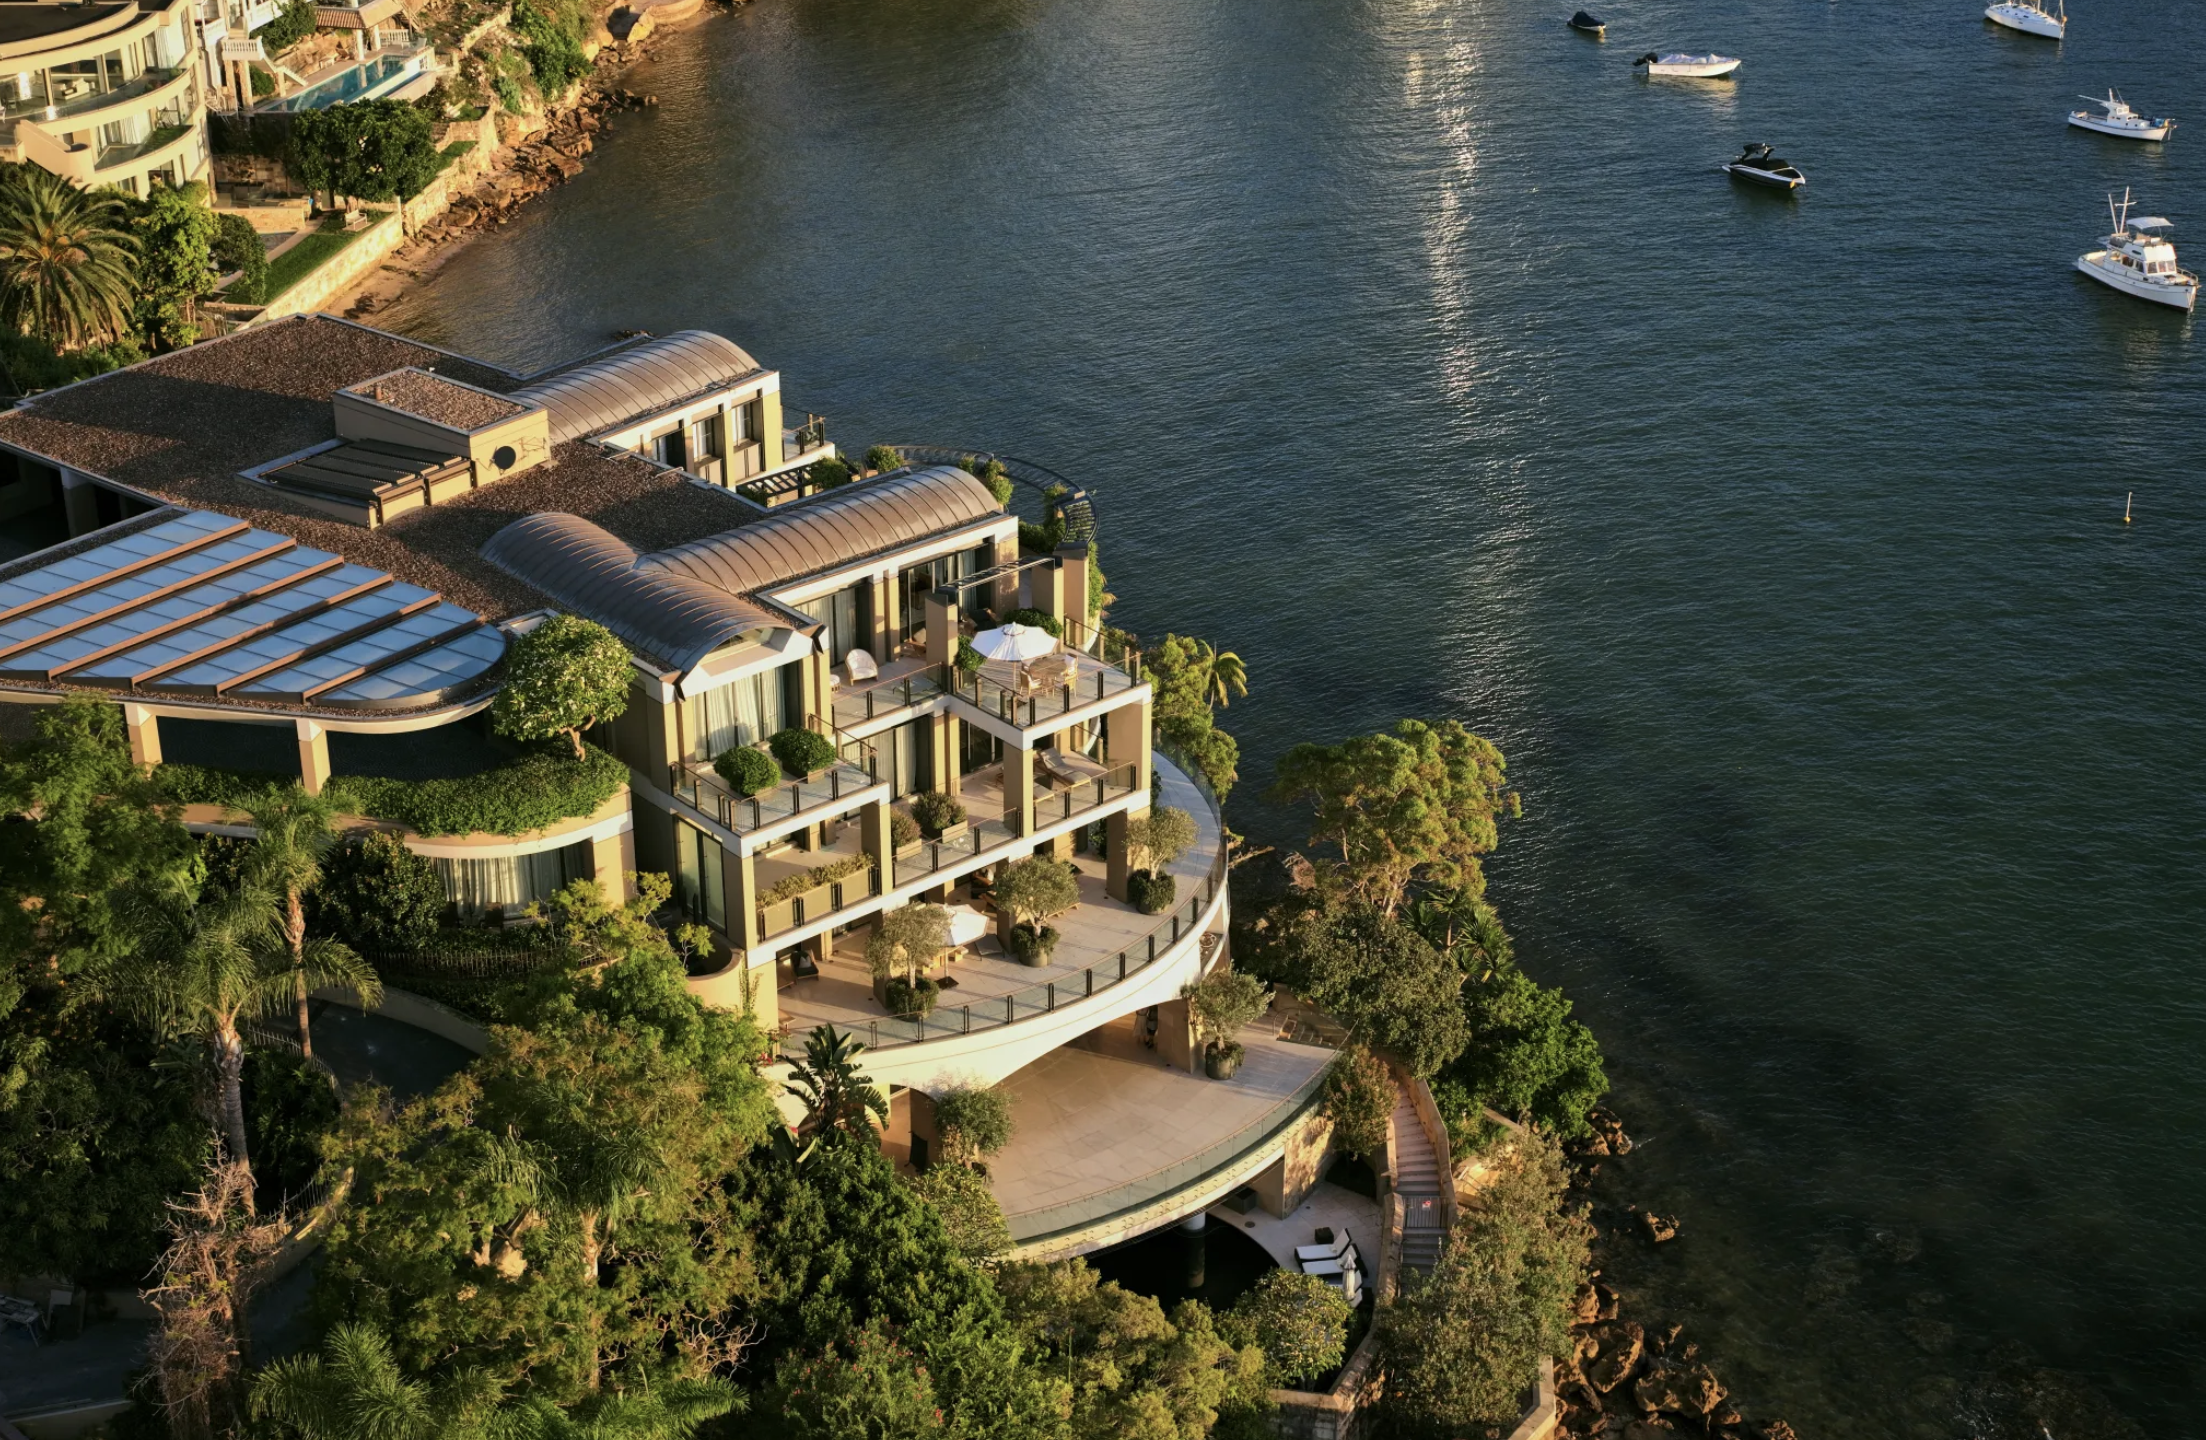
Records keep falling in 2025 as harbourfront, beachfront and blue-chip estates crowd the top of the market.

Odd Culture Group brings a new kind of after-dark energy to the CBD, where daiquiris, disco and design collide beneath the city streets.