


Apple Stock Is Rallying On A Report iPhone Demand Is Stronger Than Expected

 < 1 min
Apple shares were higher on Tuesday following a report that the company is increasing production of its 5G iPhones amid surging demand.
Nikkei Asia reported that Apple (ticker: AAPL) plans to produce 95 million to 96 million iPhones in the first half of 2021f, a nearly 30% increase from a year earlier. The target includes the new iPhone 12 line as well as older iPhone 11 and iPhone SE models.
According to the report, Apple plans to build up to 230 million iPhones in total in 2021. The story said that, according to an executive at one key Apple supplier, demand is stronger than expected in particular for iPhone 12 Pro and iPhone 12 Pro Max. Demand for the entry-level iPhone 12 Mini, by contrast, is described as “a bit sluggish.”
The story also said Apple plans “an aggressive production schedule for its high-end computers,” including the MacBook Pro and the iMac Pro, and that Apple is planning a new Apple TV set-top box for watching streaming services.
Apple didn’t comment on any element of the Nikkei Asia report.
Wedbush analyst Dan Ives said 96 million iPhones in the first half of calendar 2021 would be “well ahead of Street expectations.” He said Street consensus for the fiscal year ending in September 2021 is for Apple to produce 215 million phones—although there is a bull case that would have the total north of 240 million.
Ives continues to see “an unprecedented upgrade cycle for Apple with a major holiday season on the horizon over the coming weeks.” He maintained his Outperform rating and US$160 target on Apple shares.
Apple shares closed up 5.01% to $127.88 Tuesday as the Dow Jones Industrial Average rose 1.1%.
 Copyright 2020, Dow Jones & Company, Inc. All Rights Reserved Worldwide. LEARN MORE


This stylish family home combines a classic palette and finishes with a flexible floorplan

Just 55 minutes from Sydney, make this your creative getaway located in the majestic Hawkesbury region.


New research suggests spending 40 percent of household income on loan repayments is the new normal
3 min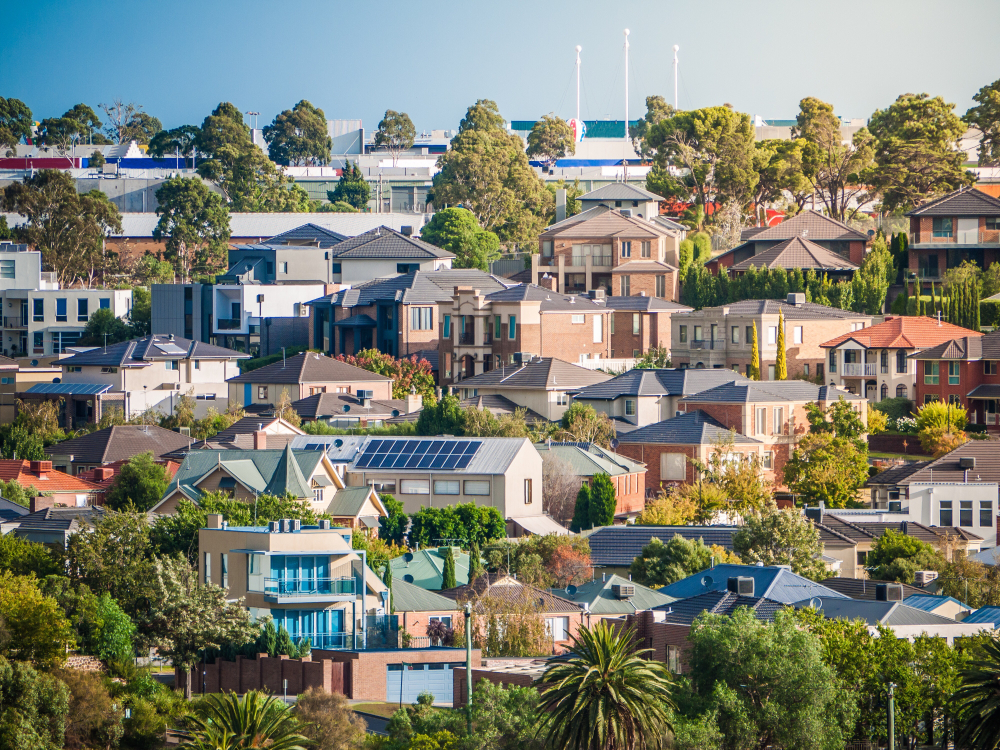
Requiring more than 30 percent of household income to service a home loan has long been considered the benchmark for ‘housing stress’. Yet research shows it is becoming the new normal. The 2024 ANZ CoreLogic Housing Affordability Report reveals home loans on only 17 percent of homes are ‘serviceable’ if serviceability is limited to 30 percent of the median national household income.
Based on 40 percent of household income, just 37 percent of properties would be serviceable on a mortgage covering 80 percent of the purchase price. ANZ CoreLogic suggest 40 may be the new 30 when it comes to home loan serviceability. “Looking ahead, there is little prospect for the mortgage serviceability indicator to move back into the 30 percent range any time soon,” says the report.
“This is because the cash rate is not expected to be cut until late 2024, and home values have continued to rise, even amid relatively high interest rate settings.” ANZ CoreLogic estimate that home loan rates would have to fall to about 4.7 percent to bring serviceability under 40 percent.
CoreLogic has broken down the actual household income required to service a home loan on a 6.27 percent interest rate for an 80 percent loan based on current median house and unit values in each capital city. As expected, affordability is worst in the most expensive property market, Sydney.
Sydney
Sydney’s median house price is $1,414,229 and the median unit price is $839,344.
Based on 40 percent serviceability, households need a total income of $211,456 to afford a home loan for a house and $125,499 for a unit. The city’s actual median household income is $120,554.
Melbourne
Melbourne’s median house price is $935,049 and the median apartment price is $612,906.
Based on 40 percent serviceability, households need a total income of $139,809 to afford a home loan for a house and $91,642 for a unit. The city’s actual median household income is $110,324.
Brisbane
Brisbane’s median house price is $909,988 and the median unit price is $587,793.
Based on 40 percent serviceability, households need a total income of $136,062 to afford a home loan for a house and $87,887 for a unit. The city’s actual median household income is $107,243.
Adelaide
Adelaide’s median house price is $785,971 and the median apartment price is $504,799.
Based on 40 percent serviceability, households need a total income of $117,519 to afford a home loan for a house and $75,478 for a unit. The city’s actual median household income is $89,806.
Perth
Perth’s median house price is $735,276 and the median unit price is $495,360.
Based on 40 percent serviceability, households need a total income of $109,939 to afford a home loan for a house and $74,066 for a unit. The city’s actual median household income is $108,057.
Hobart
Hobart’s median house price is $692,951 and the median apartment price is $522,258.
Based on 40 percent serviceability, households need a total income of $103,610 to afford a home loan for a house and $78,088 for a unit. The city’s actual median household income is $89,515.
Darwin
Darwin’s median house price is $573,498 and the median unit price is $367,716.
Based on 40 percent serviceability, households need a total income of $85,750 to afford a home loan for a house and $54,981 for a unit. The city’s actual median household income is $126,193.
Canberra
Canberra’s median house price is $964,136 and the median apartment price is $585,057.
Based on 40 percent serviceability, households need a total income of $144,158 to afford a home loan for a house and $87,478 for a unit. The city’s actual median household income is $137,760.
Consumers are going to gravitate toward applications powered by the buzzy new technology, analyst Michael Wolf predicts
Just 55 minutes from Sydney, make this your creative getaway located in the majestic Hawkesbury region.