


A Dollar Is A Dollar Is A Dollar. Except in Our Minds.
The form of money—salary vs. bonus, income vs. capital—affects the way we treat that money. Sometimes that helps us financially. And sometimes it hurts us.

 7 min
7 min
Do you care if an assistant at the chemist gives you change in one $10 note or two $5 notes?
Are you more reluctant to spend hard-earned dollars than windfall dollars?
Do you distinguish the “income” dollars paid as dividends on your stock from the “capital” dollars of the value of the stock itself?
Rational investors answer “no” to each of the three questions. After all, money is money, and rational investors can easily distinguish between the substance of money and its form. Hard-earned dollars and capital dollars are no greener than windfall dollars and income dollars.
Normal investors, however, are likely to answer “no” to the first question, but many are sure to answer “yes” to the second and third questions.
All of us are normal investors. For us, the form of money does make a difference. A dollar may be a dollar may be a dollar. But not in our minds.
Sometimes, such normal thinking helps us in our financial lives. But sometimes it hurts us. And understanding the difference between the two—that is, knowing when we’re being smart, even if not rational, and when we’re being neither smart nor rational—can make us better savers, spenders and investors.
Here are some examples of our normal thinking, and when it hurts and helps us:
Framing money into pots
We regularly divide our paychecks into pots. Sometimes they are tangible pots, such as checking accounts or glass jars. Sometimes they are virtual pots, such as Excel sheets or mental pots in our minds. We mark each pot with a label such as rent, food, entertainment, Christmas gifts or emergency funds, and refrain from dipping into pots other than designated ones.
Of course, none of this is rational. Rent dollars aren’t any greener than entertainment dollars. Rationally, they should all be in one pot labelled “money.”
Yet this practice is smart when it makes budgeting easier and prevents bounced checks and disappointed children on Christmas morning. For example, one couple I read about maintained a joint account and two sets of checking and savings accounts—one for daily expenses, such as groceries, and the other for larger expenses, such as taxes. The wife was responsible for paying daily expenses from one account and the husband was responsible for paying larger expenses from the other. The idea was to make sure they always had enough for both groceries and taxes.
Rational? No. Smart? Yes.
Of course, refraining from dipping into pots other than designated ones requires self-control. Yet this is difficult when we face temptation, such as using money in the emergency pot for entertainment. One smart way to bolster self-control is to place obstacles in the way of pots other than designated ones.
For example, one woman who contacted me put her money in a bank that is an hour’s drive away, and cut the bank’s ATM card.
Similarly, the government places obstacles to dipping into retirement pots by generally imposing a 10% penalty on withdrawals from defined-contribution retirement saving accounts on those younger than 59½.
Again, none of this is rational. A dollar is a dollar is a dollar. But thinking about the form of those dollars can make us financially healthier.
Except not always. Sometimes self-control is too strong rather than too weak, preventing reasonable dips into ample capital pots. That’s especially true for retirees who have plenty of money, but have spent a lifetime cultivating a saving mantra: Never dip into the capital pot. Now at the very time when they should be doing just that to enjoy life, they can’t bring themselves to do it. They continue to spend only the income they derive from their savings, and their lives are more constrained as a result.
Rational? No. Smart? No.
Distinguishing hard-earned money from windfall money
Easy come, easy go.
We regularly distinguish money earned with much effort, such as salary, from windfall money obtained with little or no effort, such as gifts. We tend to place hard-earned money in one mental pot and windfall money in another, and we spend windfall money more easily than we spend hard-earned money.
That distinction also affects our willingness to take risk. In one set of experiments, people were divided into two groups, hard-work earners and windfall receivers. People in the hard-work group received an amount of money for completing work requiring physical effort—peeling 25 potatoes or making nine envelopes within 30 minutes. People in the windfall-receiver group received the same amount of money as a gift, with no work requirement. Subsequently, people in the hard-work group made less-risky and less-impulsive choices than people in the windfall group.
Rationally, of course, it makes no difference whether somebody receives money from a windfall or hard work. It may also not be smart if it leads recipients of windfalls—whether bonuses, bequests or lottery winning—to fritter away these windfalls on meaningless purchases or risky investments. Then again, it could be smart if you’re a person who is not spending as much as you should because of an unwillingness to tap money from a large account. If thinking differently about “extra” money makes you more likely to spend what you can afford, go for it.
Tripped up by the ‘money illusion’
Money illusion refers to the failure to distinguish dollars framed as “nominal” from dollars framed as “real”—that is, after inflation. For example, a 2% increase in a nominal annual salary, say from $100,000 to $102,000 is a 1% decrease in the real annual salary when the annual inflation rate is 3%.
Rational investors are immune to the money illusion, but many normal investors are not. And that is not to the benefit of the normal investor.
We see the distortions caused by money illusion in the current concern about the low yields of bonds. For example, the average nominal yield on 3-month Treasury bills during the first nine months of 2020 was a meager 0.42%. The real yield is even lower, a negative 0.98%, because the rate of inflation during the period was 1.40%. Indeed, inflation has exceeded Treasury-bill yields in most years since 2002.
Yet there was less concern in 1979 when the nominal yield on 3-month T-bills was 10.07% and the rate of inflation was 12.26%, implying a negative 2.19% real yield. This is because many normal investors are misled by the money illusion, comparing the low 0.42% nominal yield of 2020 to the high 10.07% in 1979, while neglecting to note that the real yield in 2020, while negative, is higher than in 1979.
Moreover, 1979 investors paid higher taxes on a 10.07% yield than 2020 investors pay on 0.42%. Investors tend to overlook this 2020 tax balm.
Framing money in nominal terms is easier than in real terms because it does not require knowledge of inflation rates and how to use them to convert nominal dollars into real ones. Yet such framing is not smart when it misleads us to act as spendthrifts when high inflation pushes nominal interest rates up, and as misers when low inflation presses nominal interest rates down.
Spending company-paid dividends but not ‘homemade’ dividends
Investors holding shares of a company have two ways to derive money from these shares. Say you need $1000. You can receive a $1000 company-paid dividend. Or you can create a $1000 homemade dividend by selling $1000 of shares.
Rational investors would prefer homemade dividends to company-paid dividends because they can time homemade dividends when it is best for them, whereas timing of company-paid dividends is in the hands of the company. Also, taxes on homemade dividends are likely lower than on company-paid dividends. Homemade dividends do involve transaction fees as investors sell shares, but these fees are now pretty close to zero.
Many normal investors, however, prefer company-paid dividends to homemade dividends.
That can be both smart and not so smart.
Normal investors have two distinct mental pots: “income” and “capital.” Company-paid dividends, like wages, belong in the income pot. Shares, like other savings, belong in the capital pot. The self-control rule many people live by is to “spend income but don’t dip into capital.”
Thinking of the money as being in two distinct pots is smart when self-control is too weak to protect savings from excessive spending. A $1,000 company-paid dividend places a definite limit on the amount that can be spent, whereas a $1,000 homemade dividend opens the door to selling and spending, say, $2,000 of shares when a tempting vacation overpowers weak self-control.
Still, dividing money this way can backfire. To understand why, consider that an anticipated pain of regret is another reason for preferring company-paid dividends to homemade dividends. Imagine that you received $1,000 as a company-paid dividend and used it to buy a TV set. Compare it to creating a $1000 homemade dividend by selling shares to buy a TV, only to find that the price of shares zoomed soon after you sold them. The pain of regret is likely greater with homemade dividends because you bear responsibility for selling shares when you did, whereas you don’t bear responsibility for the company paying dividends when it did.
But the pain of selling stock—and then watching the price rise—should not be determining which form of money we “prefer” when we need $1,000. Stock prices do not zoom after we sell shares just because we sold shares. It’s just bad luck.
Avoiding selling stock and waiting for dividends because of the fear of regret may be what a normal investor would do. But it isn’t rational. And it probably isn’t smart.
Preferring ‘bond ladders’ to bond mutual funds
A bond ladder is composed of bonds of a range of maturities. For example, a $10,000 bond ladder can be built by allocating $1,000 to each of 10 Treasury bonds with maturities ranging from one to 10 years. The alternative is to place the $10,000 into a Treasury bond mutual fund.
In substance, a bond ladder is a “homemade” bond mutual fund with average maturity equal to that of a corresponding bond mutual fund. The value of a bond ladder declines when interest rates increase, as much as the value of a corresponding mutual fund. Therefore, rational investors are, at best, indifferent between the two if their costs are the same (more on that in a minute).
Many normal investors, however, prefer bond ladders because they can manage them in ways that reduce regret.
Imagine that you hold a bond ladder with 10 bonds with maturities ranging from one year to 10 years. You bought each of them at their $1,000 face value. Nine months pass, and you need $1000 to buy a TV set. Meanwhile, however, interest rates increased such that the prices of all 10 bonds are now lower than $1,000. If you sell the one-year bond you’ll receive, say, $995. Adding $5 to the $995 will not squeeze your budget too much, but realizing a $5 loss inflicts the pain of regret. A bond ladder gives you the option to wait three months until the one-year bond matures and receive $1,000, avoiding the pain of regret.
Bond mutual funds do not afford this waiting option. You cannot be assured that you’ll be able to avoid realizing a loss, no matter how long you wait.
None of it makes a difference to rational investors, because they know that a “paper loss” is no different from a “realized loss.” Sure, delaying realized losses may keep regret at bay, but it has no financial benefits. Indeed, rational investors prefer to realize losses, whether in a ladder or mutual fund, because realized losses become tax deductions, yielding them extra money. And waiting three months (or however long) to get the money you need means you won’t be enjoying whatever you need to use that money for.
What’s more, rational investors would ask themselves: Why build a Rube Goldberg bond ladder, when low-cost index bond mutual funds are simpler and likely cheaper, don’t require homemade construction, and don’t have the extra trouble of monitoring and replacing bonds that reach maturity with new bonds?
In other words, it is normal to try to avoid the pain of regret, but such avoidance can be costly.
Normal? Yes. Smart? No.
 Copyright 2020, Dow Jones & Company, Inc. All Rights Reserved Worldwide. LEARN MORE


This stylish family home combines a classic palette and finishes with a flexible floorplan

Just 55 minutes from Sydney, make this your creative getaway located in the majestic Hawkesbury region.

 3 min
3 min
An original watercolour illustration for the cover of Harry Potter and the Philosopher’s Stone, 1997 — the first book in J.K. Rowling’s hit series—could sell for US$600,000 at a Sotheby’s auction this summer.
The illustration is headlining a June 26 sale in New York that will also feature big-ticket items from the collection of the late Dr. Rodney P. Swantko, a surgeon and collector from Indiana, including manuscripts by poet Edgar Allan Poe and Arthur Conan Doyle, author of the Sherlock Holmes books
The Harry Potter illustration, which introduced the young wizard character to the world, is expected to sell for between US$400,000 to US$600,000, which would make it the highest-priced item ever sold related to the Harry Potter world. This is the second time the illustration has been sold, however—it was on the auction block at Sotheby’s in London in 2001, where it achieved £85,750 (US$107,316).
The artist of the illustration, Thomas Taylor, was 23 years old at the time and a graduate student working at a children’s bookshop. According to Sotheby’s, Taylor took a “professional commission from an unknown author to visualise a unique wizarding world,” Sotheby’s said in a news release. He depicted Harry Potter boarding the train to Hogwarts on platform9 ¾ platform, and the illustration became the “universal image” of the Harry Potter series, Sotheby’s said.
“It is exciting to see the painting that marks the very start of my career, decades later and as bright as ever! It takes me back to the experience of reading Harry Potter for the first time—one of the first people in the world to do so—and the process of creating what is now an iconic image,” Taylor said in the release.
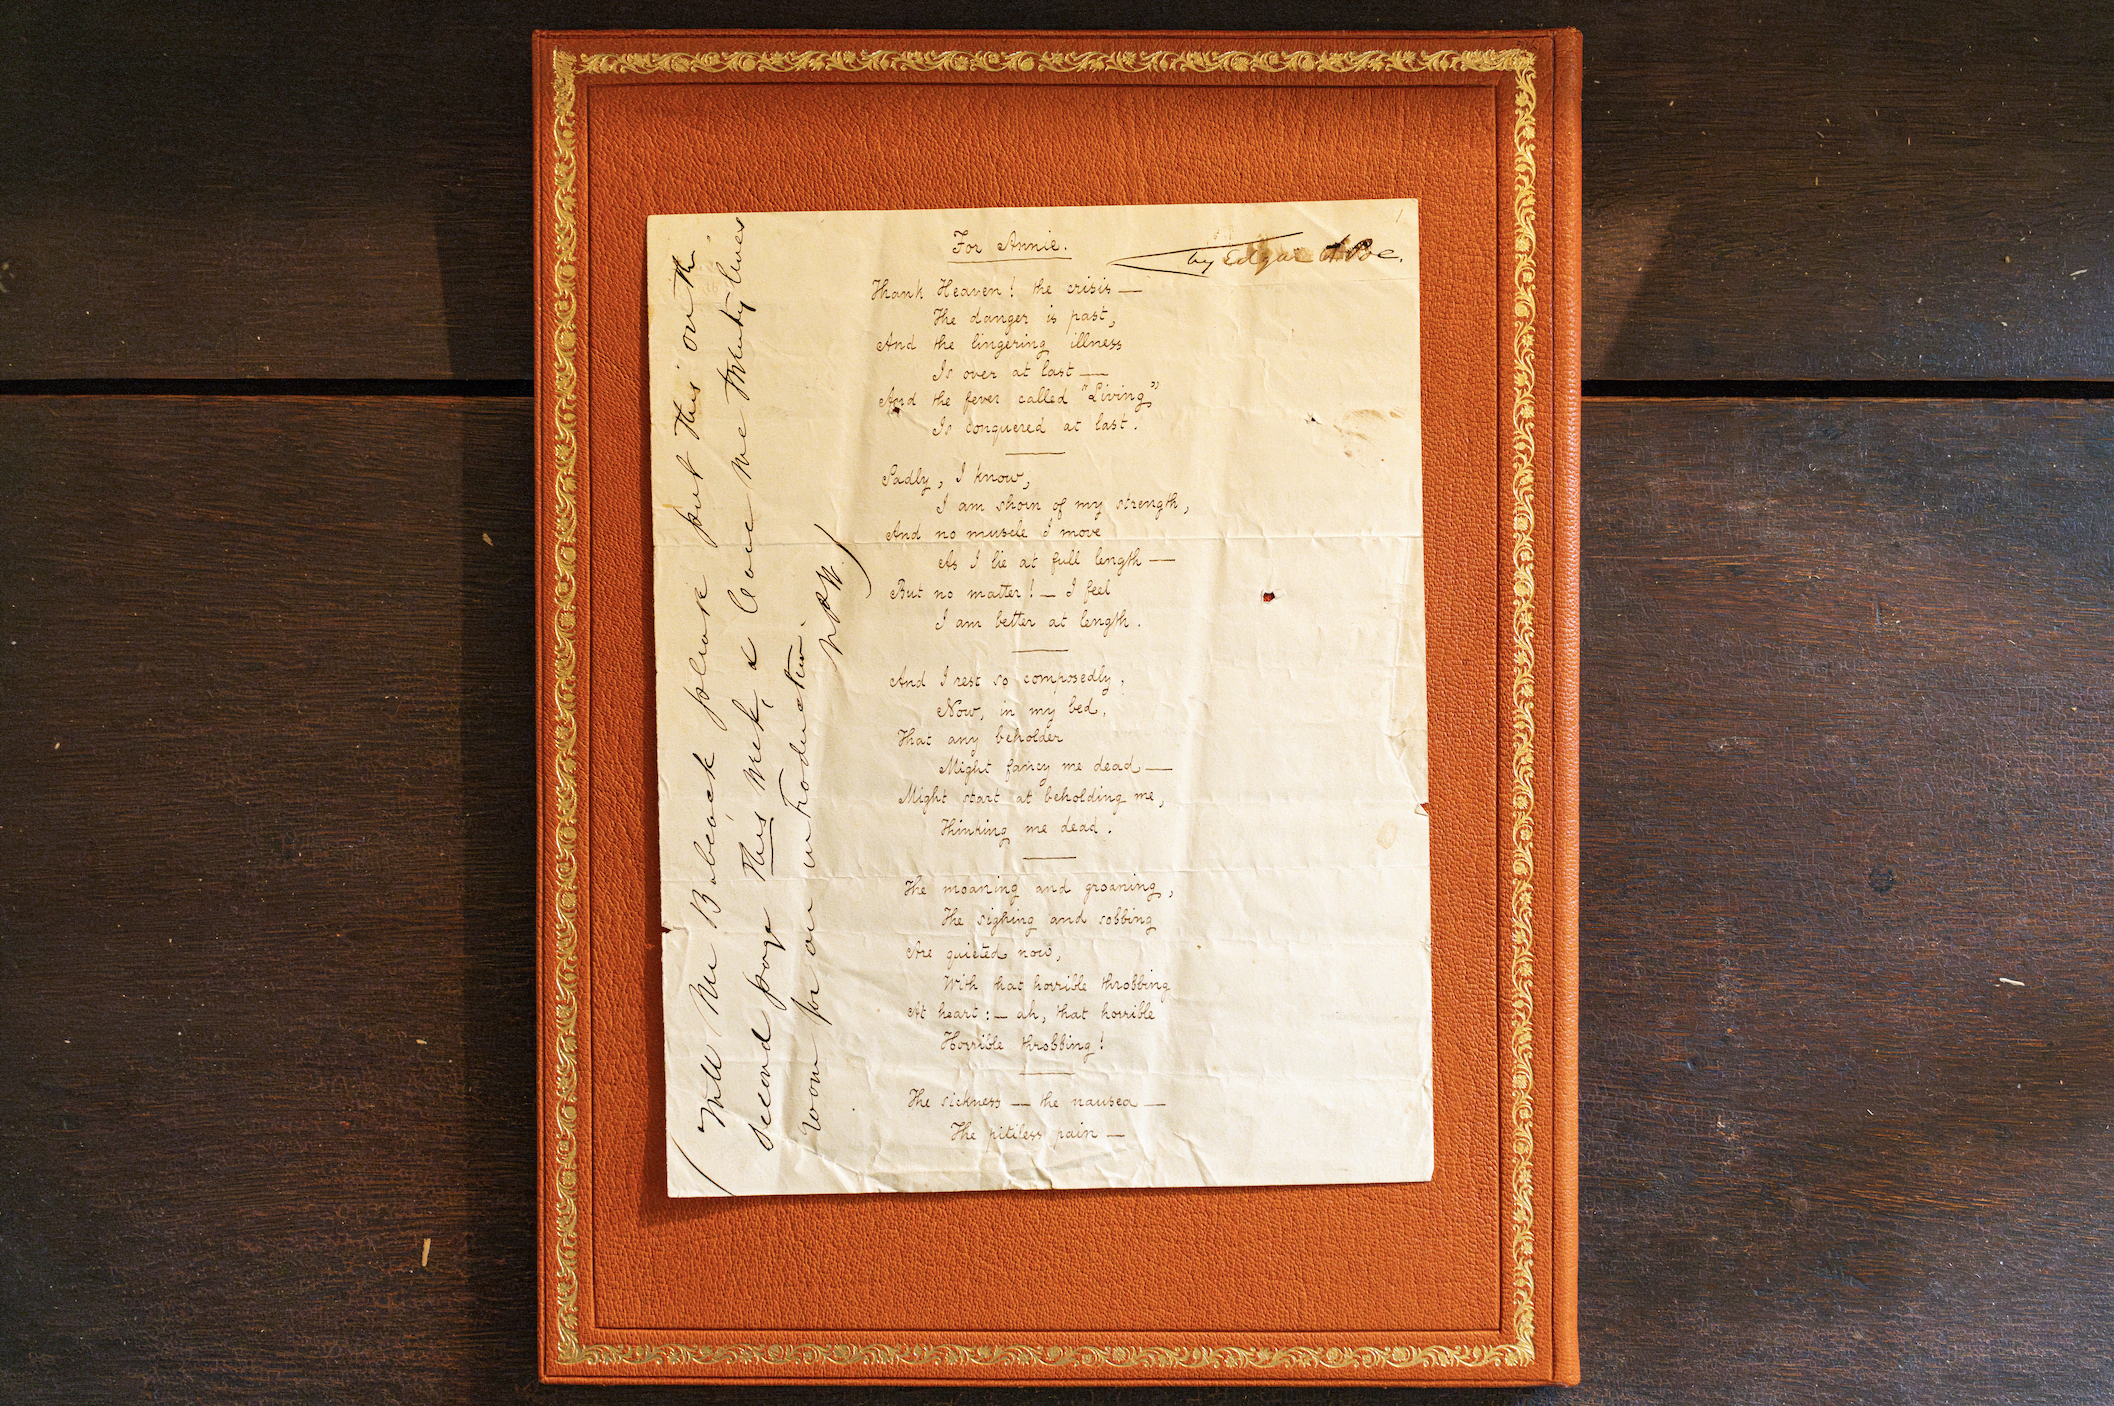
Meanwhile, to commemorate the 175th anniversary of Edgar Allan Poe’s For Annie , 1849, Sotheby’s recently reunited the autographed manuscript of the poem with the author’s home, Poe Cottage, in the Bronx.
The cottage is where the author lived with his wife, Virginia, and mother-in-law, Maria Clemm, from 1846 until he died in 1849. The manuscript, also from the Swantko collection, will remain at the home until it is offered at auction at Sotheby’s on June 26 with an estimate between US$400,000 and US$600,000.
Matthew Borowick for Sotheby’s
Poe Cottage, preserved and overseen by the Bronx County Historical Society, is home to many of the author’s famous works, including Eureka , 1948, and Annabel Lee , 1927.
“To reunite the For Annie manuscript with the Poe Cottage nearly two centuries after it was first composed brought to life literary history for a truly special and unique occasion,” Richard Austin , Sotheby’s Global Head of Books & Manuscripts, said in a news release.
For Annie was one of Poe’s most important compositions, and was addressed to Nancy “Annie” L. Richmond, one of the several women Poe pursued after his wife Viriginia’s death from tuberculosis in 1847.
In a letter to Richmond herself, Poe proclaimed For Annie was his best work: “I think the lines For Annie much the best I have ever written.”
The poem was composed in 1849, only months before Poe’s death, Sotheby’s said in the piece, Poe highlights the romantic comfort he feels from a woman named Annie while simultaneously grappling with the darkness of death, with lines like “And the fever called ‘living’ is conquered at last.”

Matthew Borowick for Sotheby’s
In the margins of the manuscript are the original handwritten instructions by Nathaniel P. Willis, co-editor of the New York Home Journal, where Poe published other poems such as The Raven and submitted For Annie on April 20, 1849.
Willis added Poe’s name in the top right and instructions about printing and presenting the poem on the side. The poem was also published in the Boston Weekly that same month.
Another piece of literary history included in the Swantko sale could surpass US$1 million. Conan Doyle’s autographed manuscript of the Sherlock Holmes tale The Sign of Four , 1889, is estimated to achieve between US$800,000 and US$1.2 million.

Consumers are going to gravitate toward applications powered by the buzzy new technology, analyst Michael Wolf predicts
This stylish family home combines a classic palette and finishes with a flexible floorplan