


Bitcoin Mining Is Big in China. Why Investors Should Worry.
Why the digital currency’s dependence on China, specifically Xinjiang, is concerning.

 3 min
3 min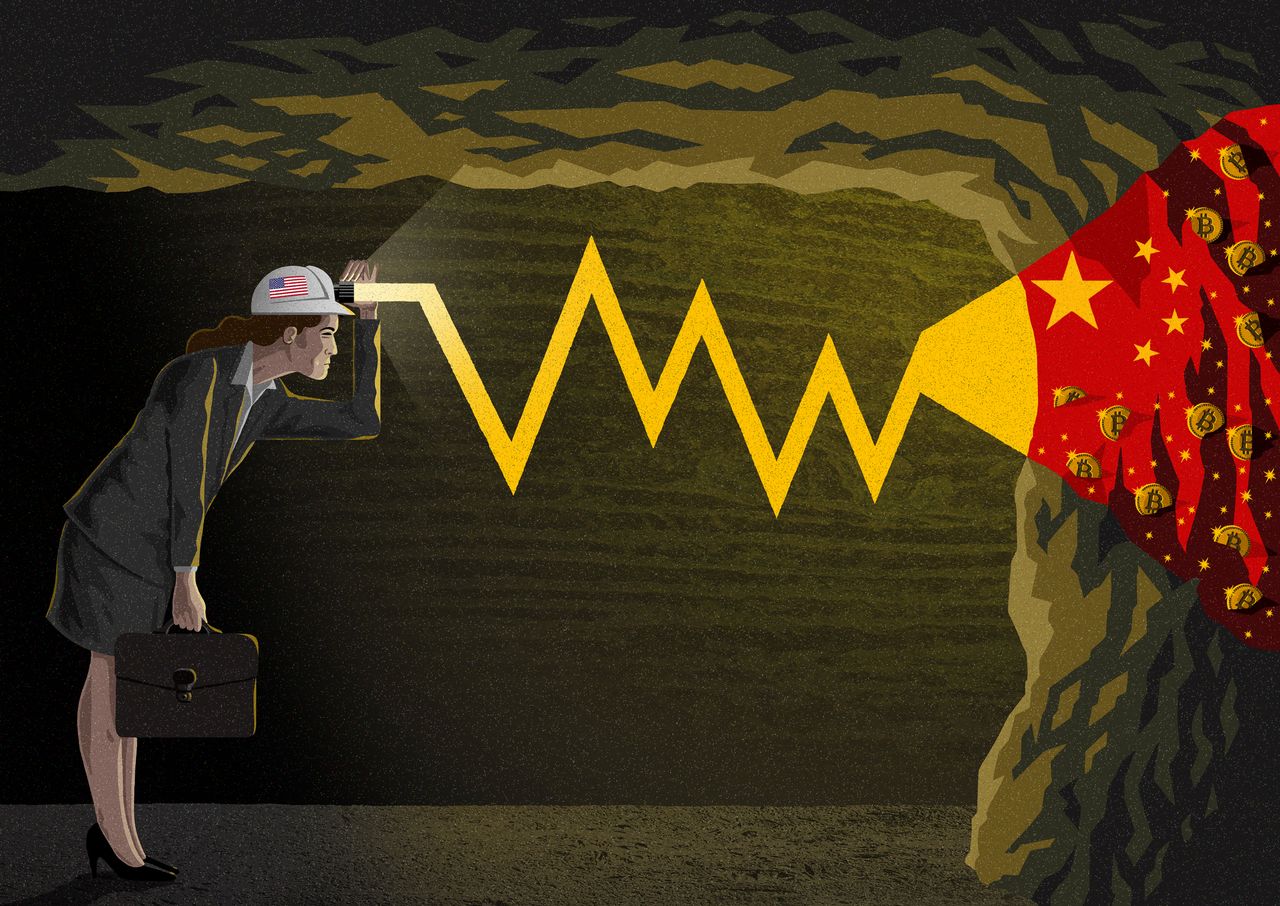
Critics of the nearly ubiquitous digital currency Bitcoin often focus on its environmental consequences. After Tesla announced recently that it had bought roughly US$1.5 billion in Bitcoin, sending the cryptocurrency’s value skyrocketing, sustainability investors decried the “level of carbon dioxide emissions generated from Bitcoin mining.” Certainly, “mining”—the energy-intensive process by which computers solve complex algorithmic problems to verify blockchain transactions, for which they’re rewarded in digital currency—is an undeniable environmental offender.
But there is another worrying aspect of Bitcoin, one that should make investors think twice about including it as part of an ethical investing strategy.
A large amount of new Bitcoin comes from Xinjiang, the region in northwest China where more than a million Uighur Muslims and other minorities have been imprisoned in concentration camps. According to the Cambridge Bitcoin Electricity Consumption Index, as of April 2020, China was responsible for 65% of all Bitcoin mining. And of that, 36% takes place in Xinjiang, the largest regional component. Why? Cheap coal means cheap energy to power the machines that mine Bitcoin. Xinjiang has an abundant supply of coal, and the region’s relative remoteness means that it’s far cheaper to use the resource locally than move it to other parts of China. The issue is not that the Chinese government uses forced labour in Xinjiang coal mines—the reporting on that is inconclusive. Rather, because of the atrocities occurring in Xinjiang, any product produced there brings with it high ethical and regulatory risk.
In the camps—which Beijing calls “vocational educational and training centres”—guards try to “deradicalise” Uighurs for crimes such as wearing long dresses, abstaining from pork or alcohol, or praying. While the difficulty of reporting in the region means that concrete evidence is scarce, camp survivors have described systemic torture, forced sterilization, and rape. (Beijing denies committing atrocities.) In January, right before leaving office, Secretary of State Mike Pompeo declared that Beijing was committing “genocide” in the region. His successor, Antony Blinken, agrees.
To summarize: Roughly 20% of new Bitcoin is mined in Xinjiang, the site of some of the world’s most egregious human-rights abuses.
Today, Bitcoin’s association with Xinjiang is barely discussed. But that may change. For public-facing funds considering investing in the notoriously volatile asset, there are two other risks to consider. The first is that because of the concern among the American public about human-rights abuses in Xinjiang, holding assets tied to the region comes at the risk of a public relations disaster.
Already, activists have criticised Olympic sponsors for participating in the “genocide Olympics”—the 2022 Beijing Winter Games. Multiyear campaigns to hive Xinjiang off from the global supply chain are already well under way.
In July, more than 190 organizations, including the AFL-CIO, called for clothing brands to end all sourcing from Xinjiang within the next 12 months. (In 2020, roughly 20% of the world’s cotton came from Xinjiang.) It’s not hard to imagine Bitcoin becoming another frontier in their campaigns.
Investors should be alert for regulatory action. Bitcoin’s Xinjiang relationship gives ammunition to those in the U.S. government who may want to further monitor or restrict the transactions. Analysts expect the Biden administration to pay close attention to Bitcoin. In mid-February, Treasury Secretary Janet Yellen criticised the “misuse” of cryptocurrencies in laundering money or funding terrorism. At the same time, Bitcoin’s Xinjiang connection could put it on the radar of the various arms of the Commerce, State, and Defense departments that are seeking to reduce U.S. dependence on physical and digital Chinese goods. If this trend intensifies, the Treasury Department could sanction the Bitcoin mining firms that have large operations in Xinjiang, or issue advisories that it is “studying” Bitcoin’s links to the region—signalling to global financial institutions another risk of holding the cryptocurrency.
In January, U.S. Customs banned the imports of Xinjiang cotton and tomato products and told U.S. companies to get forced labour out of their supply chains. Extricating Bitcoin from Xinjiang could be far more difficult. Unlike, say, blood diamonds or Iranian crude oil, Bitcoins exist only digitally. While there is a public record of the billions of Bitcoin transactions, it’s exceedingly complicated to determine the geographic origin of a particular Bitcoin. That means all Bitcoin holders can deny any connection to human-rights abuses—but also risk being tarnished by the association.
It has long been ironic that Bitcoin, developed to decentralize power, is so dependent on China, a country ruled by a government obsessed with centralizing it. But depending on China is one thing. Depending on Xinjiang is another. There are many excellent ethical and regulatory reasons not to buy Bitcoin. Add Xinjiang to that list.
Isaac Stone Fish is the CEO and founder of Strategy Risks, a firm that quantifies corporate exposure to China.>
 Copyright 2020, Dow Jones & Company, Inc. All Rights Reserved Worldwide. LEARN MORE


This stylish family home combines a classic palette and finishes with a flexible floorplan

Just 55 minutes from Sydney, make this your creative getaway located in the majestic Hawkesbury region.
CommSec research reveals this state is leading the country in economic growth, unemployment, construction and dwelling starts
2 min
South Australia is currently the strongest state or territory economy in the country, with economic activity 9.1 percent above its decade-average in the December quarter, according to CommSec research. NSW was second with economic output running 8.6 percent above its long-run average, followed by Victoria with 8.5 percent, the ACT at 8.3 percent and Western Australia at 6 percent.
Economic activity in both Queensland and Tasmania was 4.5 percent above average while the Northern Territory underperformed its long-term average by 0.5 percent.
The CommSec research ranks states and territories on several key economic metrics and compares the latest quarterly data with each area’s decade average. South Australia ranks first on four of the eight key indicators. They are economic growth, unemployment, construction and dwelling starts.
Western Australia ranks first on population growth and business and equipment investment. Population growth has been a key element in Perth and regional Western Australia becomingthe country’s hottest property markets over the past 12 months. CoreLogic figures released this week show home values are up 21.1 percent in Perth and 13.3 percent in the state’s regions.
Despite high inflation, retail spending remained above the long-term average in all states and territories in the December quarter. The ACT led with retail expenditure 12.2 percent higher than its long-term average, followed by Western Australia with 11.3 percent, Victoria at 11.2percent and Queensland at 11.1 percent.
Queensland is in the top spot for new home loans. Propelling this is very strong internal migration and a doubling of the First Home Owners Grant to $30,000 from 20 November last year. New home loans issued to first home buyers in November surged to a 15-month high, according to data from the Australian Bureau of Statistics. Queensland is currently the second strongest housing market, with home values up 16.1 percent in Brisbane and 11.2 percent in regional areas over the past year.
In all states and territories except the Northern Territory, housing finance commitments remained above decade averages in the December quarter. The value of home loans in Queensland was 21.1 percent higher than the state’s long-term average. The next strongest was Western Australia, up 17.5 percent, South Australia, up 14.2 percent, and the ACT, up 12 percent. The new CoreLogic data reveals 15 consecutive months of growth in the national median price, despite high interest rates.
This stylish family home combines a classic palette and finishes with a flexible floorplan
Consumers are going to gravitate toward applications powered by the buzzy new technology, analyst Michael Wolf predicts