For Apple, India Is the Next China
Apple’s move to open its famed retail store in India signals the market is a high priority
Apple’s playbook in India is evolving, from testing the country as a counterweight to China’s supply-chain dominance to viewing it as an emerging growth hub for demand.
Both of these strategies are working off each other.
Last week, Apple unveiled the look of its first retail store in India that is set to open this month, signalling India’s growing importance for the Cupertino, Calif.-based company. Until now Apple has sold iPhones and other products in the country mostly through resellers, e-commerce websites and large format retail chains. With the opening of its own famed brick-and-mortar store, it is adding another critical layer to this wide distribution.

The move isn’t surprising given Chief Executive Tim Cook in February called India a major focus for Apple, adding that the company is putting a lot of emphasis on the market. On the call, Apple said it posted record iPhone revenue in India in the December quarter, though they didn’t give a specific figure, even as overall revenue declined.
It is no secret that Apple has been growing its manufacturing base in India as it works on a China + 1 strategy. But this narrative has overshadowed India’s steady climb up the luxury ladder over the past few years, and the opportunity it presents for Apple to find the next lucrative market similar to China.
Making iPhones and then selling them in India ensures a smooth supply chain—a page directly out of Apple’s massive success in China over the past decade. Daniel Ives, an analyst with Wedbush Securities, believes that now the company will have “skin in the game” building out production in India with retail success along the way.
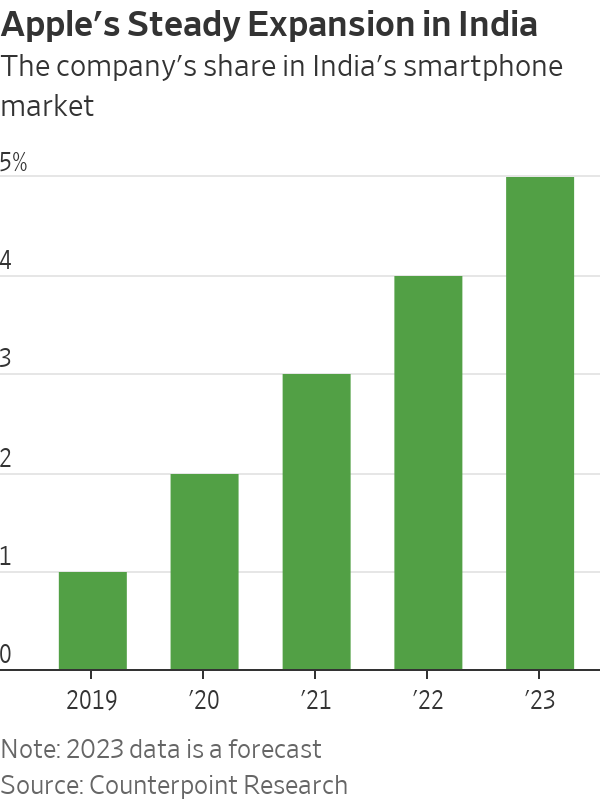
For several years, Apple struggled to make a dent in the Indian market and compete against more affordable Chinese models. Only now is it gaining traction. Apple had a mere 1% market share in 2019 and may cross a 5% share this year in the country’s overall smartphone market, according to Counterpoint Research. To be sure, that contrasts with Apple’s market share in China of 22% in the last quarter of 2022.
Still the market has potential, even if prices of iPhones may have to come down further. According to another research firm, Canalys, India’s premium smartphone segment, defined by sale prices above $500, has doubled to 6% of overall market share last year from 3.1% in 2019, and Apple’s share of this segment was at 60.13% last year.
Harsh Kumar, an analyst at Piper Sandler, argues that India and China are quite similar in their demographics and even in their potential buying power, at least in large cities—and that India can show large numbers for Apple with some effort.
India is the second-largest smartphone market globally, both in terms of annual shipments and sales, accounting for almost 12% of the global market, according to market intelligence firm IDC. Despite this, smartphone penetration is still less than 50%—providing an unmatched potential for growth for Apple.
Navkendar Singh, an analyst at tech researcher IDC, believes that Apple’s work on channel expansion, focus on affordability through attractive trade-in programs, discounts, cash-back offers and better pricing on prior-generation models are finally bearing fruit. But the gap between Apple and other models is still quite wide—the average selling price of a smartphone in India was $206 last year, excluding taxes, vs. $898 for an iPhone, according to Canalys.
But the price of Apple’s cheapest model can go below $500 with discounts. A larger manufacturing base with a thriving component ecosystem in India could bring prices down a bit further.
India is at the forefront of Apple’s efforts to decouple from China’s factory floor but may even prove itself as a growth market—with some conditions applied, of course.
 Copyright 2020, Dow Jones & Company, Inc. All Rights Reserved Worldwide. LEARN MORE
Records keep falling in 2025 as harbourfront, beachfront and blue-chip estates crowd the top of the market.
A divide has opened in the tech job market between those with artificial-intelligence skills and everyone else.
JPMorgan Chase has a ‘strong bias’ against adding staff, while Walmart is keeping its head count flat. Major employers are in a new, ultra lean era.
It’s the corporate gamble of the moment: Can you run a company, increasing sales and juicing profits, without adding people?
American employers are increasingly making the calculation that they can keep the size of their teams flat—or shrink through layoffs—without harming their businesses.
Part of that thinking is the belief that artificial intelligence will be used to pick up some of the slack and automate more processes. Companies are also hesitant to make any moves in an economy many still describe as uncertain.
JPMorgan Chase’s chief financial officer told investors recently that the bank now has a “very strong bias against having the reflective response” to hire more people for any given need. Aerospace and defense company RTX boasted last week that its sales rose even without adding employees.
Goldman Sachs , meanwhile, sent a memo to staffers this month saying the firm “will constrain head count growth through the end of the year” and reduce roles that could be more efficient with AI. Walmart , the nation’s largest private employer, also said it plans to keep its head count roughly flat over the next three years, even as its sales grow.
“If people are getting more productive, you don’t need to hire more people,” Brian Chesky , Airbnb’s chief executive, said in an interview. “I see a lot of companies pre-emptively holding the line, forecasting and hoping that they can have smaller workforces.”
Airbnb employs around 7,000 people, and Chesky says he doesn’t expect that number to grow much over the next year. With the help of AI, he said he hopes that “the team we already have can get considerably more work done.”
Many companies seem intent on embracing a new, ultralean model of staffing, one where more roles are kept unfilled and hiring is treated as a last resort. At Intuit , every time a job comes open, managers are pushed to justify why they need to backfill it, said Sandeep Aujla , the company’s chief financial officer. The new rigor around hiring helps combat corporate bloat.
“That typical behavior that settles in—and we’re all guilty of it—is, historically, if someone leaves, if Jane Doe leaves, I’ve got to backfill Jane,” Aujla said in an interview. Now, when someone quits, the company asks: “Is there an opportunity for us to rethink how we staff?”
Intuit has chosen not to replace certain roles in its finance, legal and customer-support functions, he said. In its last fiscal year, the company’s revenue rose 16% even as its head count stayed flat, and it is planning only modest hiring in the current year.
The desire to avoid hiring or filling jobs reflects a growing push among executives to see a return on their AI spending. On earnings calls, mentions of ROI and AI investments are increasing, according to an analysis by AlphaSense, reflecting heightened interest from analysts and investors that companies make good on the millions they are pouring into AI.
Many executives hope that software coding assistants and armies of digital agents will keep improving—even if the current results still at times leave something to be desired.
The widespread caution in hiring now is frustrating job seekers and leading many employees within organizations to feel stuck in place, unable to ascend or take on new roles, workers and bosses say.
Inside many large companies, HR chiefs also say it is becoming increasingly difficult to predict just how many employees will be needed as technology takes on more of the work.
Some employers seem to think that fewer employees will actually improve operations.
Meta Platforms this past week said it is cutting 600 jobs in its AI division, a move some leaders hailed as a way to cut down on bureaucracy.
“By reducing the size of our team, fewer conversations will be required to make a decision, and each person will be more load-bearing and have more scope and impact,” Alexandr Wang , Meta’s chief AI officer, wrote in a memo to staff seen by The Wall Street Journal.
Though layoffs haven’t been widespread through the economy, some companies are making cuts. Target on Thursday said it would cut about 1,000 corporate employees, and close another 800 open positions, totaling around 8% of its corporate workforce. Michael Fiddelke , Target’s incoming CEO, said in a memo sent to staff that too “many layers and overlapping work have slowed decisions, making it harder to bring ideas to life.”
A range of other employers, from the electric-truck maker Rivian to cable and broadband provider Charter Communications , have announced their own staff cuts in recent weeks, too.
Operating with fewer people can still pose risks for companies by straining existing staffers or hurting efforts to develop future leaders, executives and economists say. “It’s a bit of a double-edged sword,” said Matthew Martin , senior U.S. economist at Oxford Economics. “You want to keep your head count costs down now—but you also have to have an eye on the future.”
BMW has unveiled the Neue Klasse in Munich, marking its biggest investment to date and a new era of electrification, digitalisation and sustainable design.
Australia’s market is on the move again, and not always where you’d expect. We’ve found the surprise suburbs where prices are climbing fastest.


