South Doing All the Work in Europe’s Upside-Down Recovery
A sharp rebound in tourism in Europe’s sunbelt powers its economic rebound as core manufacturing centres struggle to recover

 3 min
3 min
Europe’s economy has a north-south divide—and now it’s the poorer south that is powering the region’s return to growth.
Southern Europe, which for decades has had lower growth, productivity and wealth than the north, powered an upside-down recovery on the continent at the start of the year. Buoyant tourism revenue around the Mediterranean helped to offset sluggishness in Europe’s manufacturing heartlands.
The south’s transformation from laggard into growth engine reflects both a rapid rebound in visitor numbers from the collapse during the Covid-19 pandemic and a series of blows the continent’s large manufacturing sector has suffered, from surging energy prices to trade conflicts.
Now growth in the south is more than offsetting the north’s manufacturing malaise: As a whole, the eurozone economy grew at an annualised rate of 1.3% in the first quarter, ending nearly 18 months of economic stagnation in a sign that the currency area is recovering from the damage done by Russia’s invasion of Ukraine.
It was the eurozone’s strongest performance since the third quarter of 2022, and approached the U.S. economy’s 1.6% first-quarter growth rate, which was a slowdown from a racy pace of 3.4% at the end of last year.
In the 2010s, Germany helped to drag the continent out of its debt crisis thanks to strong exports of cars and capital goods. Between 2021 and 2023, Italy, Spain, Greece and Portugal contributed between a quarter and half of the European Union’s annual growth, according to a report last year by French credit insurer Coface —a trend now confirmed and amplified in the latest data.
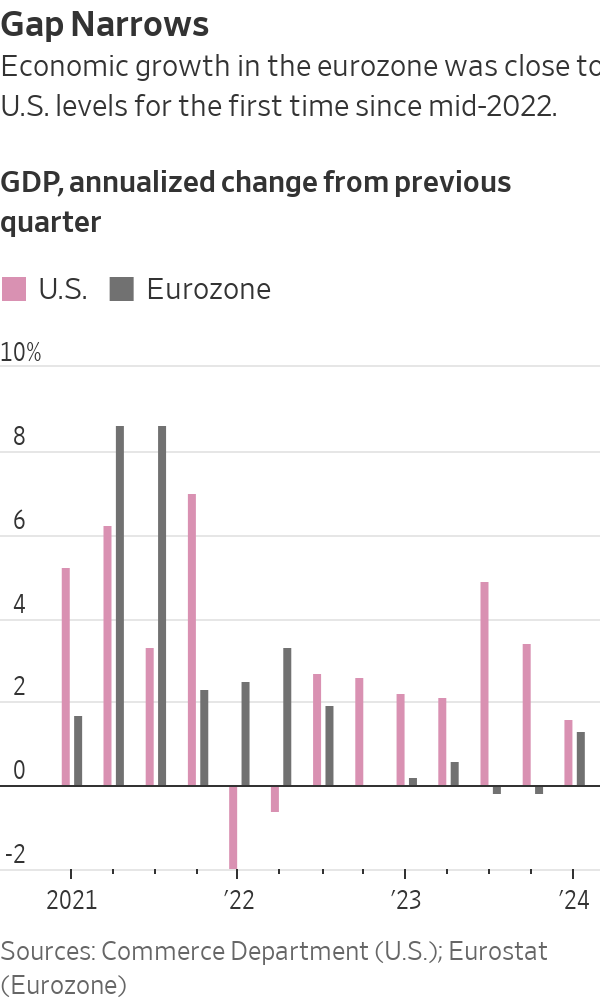
In the first quarter, Spain was the fastest-growing of the big eurozone economies. It and Portugal recorded growth of 0.7% in the three months through the end of March from the previous quarter, while Italy’s economy grew by 0.3%. France and Germany both grew by 0.2%, the latter rebounding from a 0.5% quarter-on-quarter contraction at the end of last year.
This means Germany’s economy has grown by 0.3% in total since the end of 2019, compared with 8.7% for the U.S., 4.6% for Italy and 2.2% for France, according to UniCredit data.
In Spain, strong growth “seems to have been entirely due to strong tourism numbers,” said Jack Allen-Reynolds, an economist with Capital Economics. Tourism accounts for around 10% of the economies of Spain, Italy, Greece and Portugal.
The euro rose by about a quarter-cent against the dollar, to $1.0725, after the latest growth and inflation data were published.
The recovery comes as the European Central Bank signals it is preparing to reduce interest rates in June after a historic run of increases since mid-2022 that took it the key rate to 4%. Inflation in the eurozone remained at 2.4% in April, while underlying inflation cooled slightly, from 2.9% to 2.7%, according to separate data published Tuesday.
“The ECB hawks will point to the strong GDP number as [an] argument that ECB can take its rates lower gradually,” said Kamil Kovar, senior economist at Moody’s Analytics.
The eurozone economy has flatlined since late 2022 as Russia’s attack on its neighbor sent food and energy prices soaring in Europe and sapped business and household confidence. Gross domestic product fell in both the third and fourth quarters of last year, meeting a definition of recession widely used in Europe, but not in the U.S.
Southern Europe is one of only a handful of regions where international tourist arrivals returned to pre pandemic levels last year, according to United Nations data. Tourism revenue across the EU was one-quarter higher in the three months through the end of last June than in the same period in 2019, according to Coface data.
The recovery in international tourism was “notably driven by the arrival of many Americans who…were able to take advantage of favorable exchange rates,” Coface analysts wrote. “On the other hand, the end of the zero-Covid policy in China has initiated a gradual return of Chinese tourists, although remaining below 2019 levels.”
In Portugal, the number of foreign tourists hit a record of more than 18 million last year, up 11% compared with the prepandemic year of 2019, official data showed in January. American tourists in particular have returned to Europe in force.
Tourist numbers in Asia Pacific and the Americas continued to lag 2019 levels by 35% and 10% last year, respectively, the data show.
It is unclear how much further the tourism boom can run, but economists expect the region’s economic recovery to strengthen later this year as cooling inflation boosts household spending power and lower energy costs aid factory output.
Recent surveys point to an improved outlook for growth. Consumer confidence has risen to its highest level in two years, and a leading business-sentiment index has shown steady improvement from the start of 2024.
“We think that the combination of a robust labor market, comparatively strong wage hikes and lower inflation compared with last year will finally lead to a moderate recovery in consumer spending in the next few quarters,” said Andreas Rees , an economist with UniCredit in Frankfurt.
 Copyright 2020, Dow Jones & Company, Inc. All Rights Reserved Worldwide. LEARN MORE


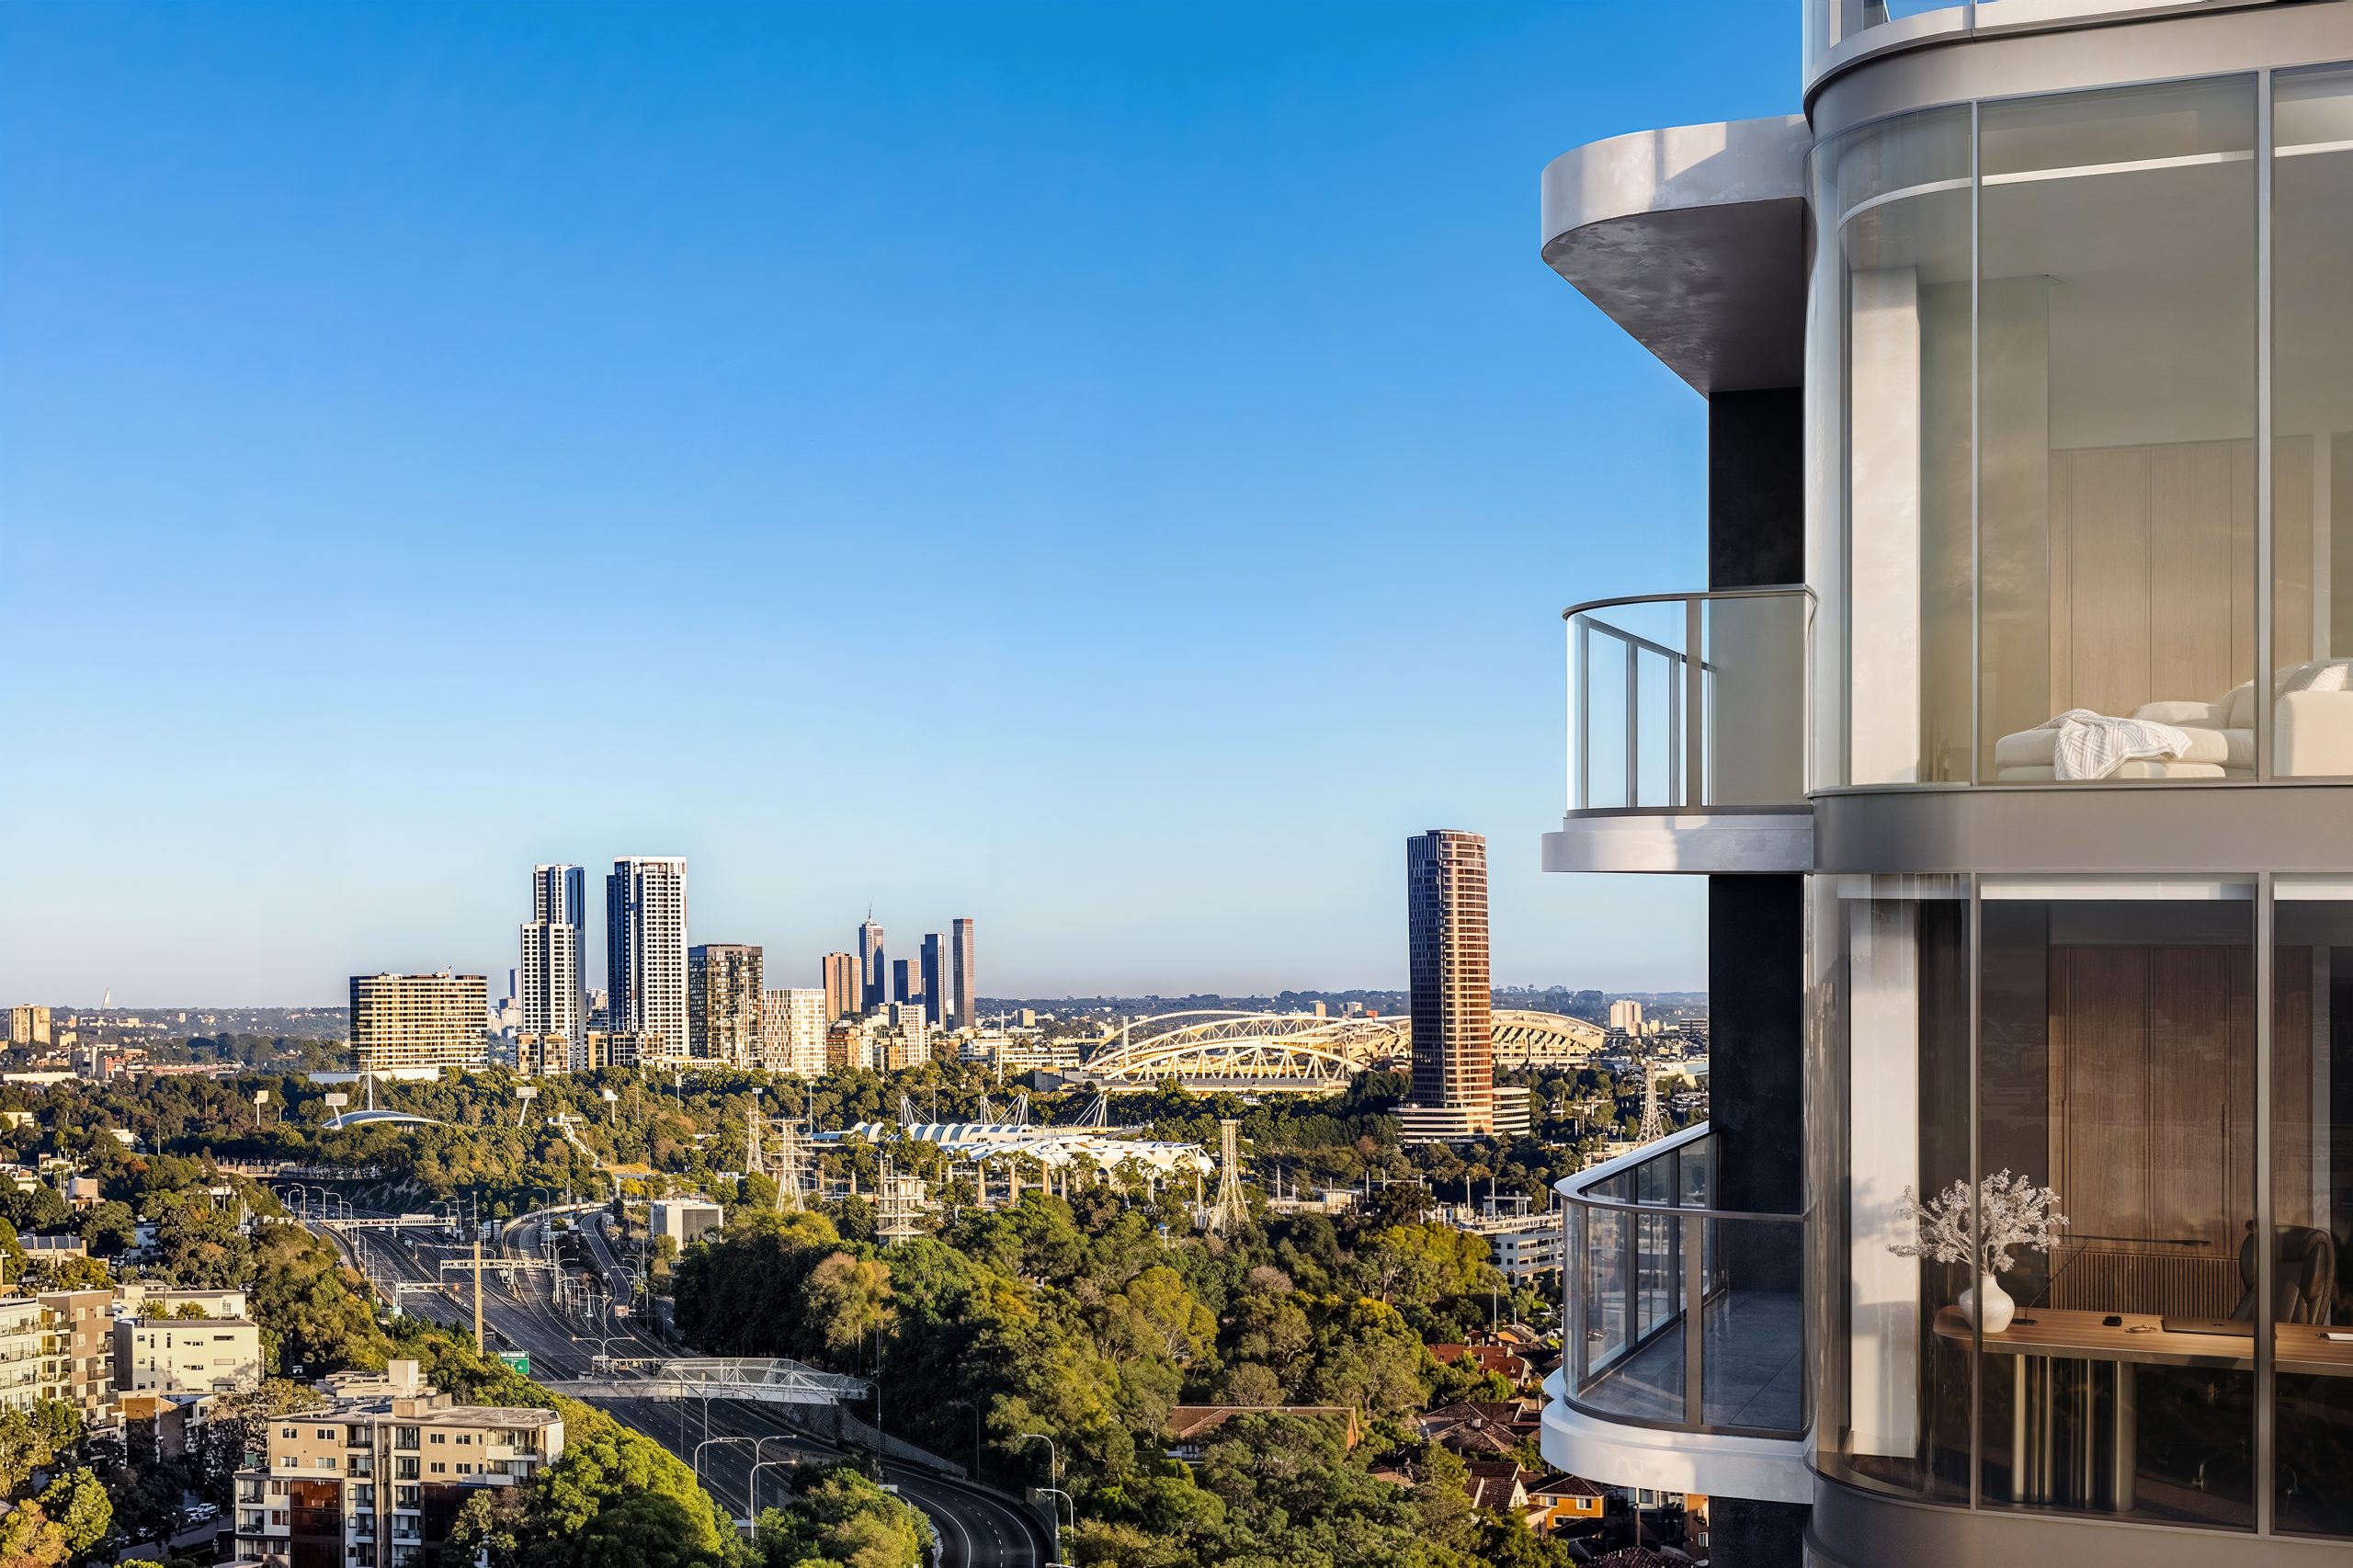
Ophora Tallawong has launched its final release of quality apartments priced under $700,000.

From bushland greens to valley reds, the country’s most awarded designers are proving that the best colour palette was never on a swatch card; it was outside the window all along.


The federal budget has rattled property investors. But the biggest mistake isn’t the tax changes, it’s the conclusion many are drawing from them.
2 min
The recent budget has forced a reckoning for property investors.
Negative gearing now restricted to new residential builds, the CGT discount gone and on paper, the numbers look different.
And many investors are responding by pivoting toward yield, prioritising cash flow over capital growth in a way that property strategists say misses the point entirely.
“The debate has shifted to yield versus growth as if they are opposing forces,” says Abdullah Nouh, founder of Melbourne-based buyers’ agency Mecca Property Group. “But that framing is itself the mistake.”
Nouh, who works with high-net-worth families and investors on long-term acquisition strategy, argues that capital growth remains the primary driver of genuine wealth creation and that the post-budget environment has made quality assets more important, not less.
The numbers make his case plainly. An additional $500 per week in rental income is welcome. A prestige asset appreciating by $1 million over a market cycle is transformative.
These are not equivalent outcomes, and portfolios built around yield at the expense of location and land value tend to generate income while wealth stands largely still.
The more nuanced shift Nouh is seeing among sophisticated investors is a move toward assets where both outcomes can be engineered simultaneously – established homes on substantial land in quality locations, where the existing dwelling can be repositioned, rental returns improved, and the underlying land value compounds independent of what sits on it.
For investors with existing equity, commercial property is also entering the conversation in a more serious way.
Prestige industrial assets, medical centres and long-leased essential retail offer income profiles that residential property in most capital city markets cannot currently match: longer lease terms, tenants covering outgoings, and greater predictability than the residential tenancy cycle.
“The investors who build lasting wealth are rarely the ones who chased yield or growth exclusively,” says Nouh.
“They are the ones who built a strategy they could sustain – one that generated enough income to hold quality assets through multiple cycles while those assets compounded in value.”
The budget has changed the settings. It has not changed the fundamentals.
From bushland greens to valley reds, the country’s most awarded designers are proving that the best colour palette was never on a swatch card; it was outside the window all along.

Once a sleepy surf town, Noosa has become Australia’s prestige property hotspot, where multi-million dollar knockdowns, architectural showpieces and record-setting sales are the new normal.