


Don’t Roll Your Eyes: Looking the Part Could Land You That Job
Applying to be a programmer? Better grab a pair of glasses. Different jobs favour certain looks, new research shows.

 4 min
4 min, PIXELSQUID")
Think appearances don’t matter if you’re applying for a job online? New research shows that looking the part is very much part of the equation.
Your credentials and referrals may get you on the shortlist. Even if the whole process takes place online, though, it’s rare that a hiring manager won’t check out your LinkedIn profile. Making the final cut can come down to nailing a specific professional look, according to a new study published by the Harvard Business School.
Analysing 63,000 job openings and the more than 160,000 freelancers who applied for them over a six-month period, researchers found that certain accessories or physical features gave candidates an edge in landing the job—even after controlling for race, age and gender. Researchers used computer vision technology and machine learning to help classify which attributes made someone be perceived as a better fit for a job, then examined what role that played in hiring.
Different jobs favoured certain looks. The analysis showed that men wearing glasses and having a computer visible in the photo were perceived to be a better fit for a software programming assignment than men without glasses, boosting their chances of getting it. A beard gave them a slight edge, too.
With design and media-related jobs—one of two broad job categories examined in the study—flashing a smile and using a photo with high image quality was also important. Women sporting reading glasses and an “artistic” look were seen as a better fit for graphic design jobs than other women.
The researchers, from Harvard and the University of Southern California, found that certain photo features could tilt the selection process when profiles included equally high ratings from previous clients. The advantage could be roughly the equivalent of a 5% pay differential.
On the other hand, the study suggests that looking the part for a job doesn’t rely just on a candidate’s gender, ethnicity and age. Rather, paying attention to the details of a profile photo can go a long way, recruiters say.
“We would be fooling ourselves to say it’s not part of the package,” says Jessica Vann, founder of Maven Recruiting Group, a San Francisco job-placement firm. While not as important as job or communication skills, “it’s a piece, for sure.”
It’s generally a good idea to have a neutral background and no children, pets or celebrities in the photo. Vann, whose firm specialises in placing executive assistants and chiefs of staff at Silicon Valley companies, says she has counselled job seekers to eschew an obviously AI-generated photo or tone down the makeup.
In a CivicScience poll of more than 2,000 people conducted online last week, about half of respondents said they had used a professional-looking photo of themselves in some capacity; 82% agree that appearance makes a difference in a job offer.
Title VII of the Civil Rights Act of 1964 prohibits employers from discriminating because of race, gender and religion, among other factors. But other aspects of personal appearance—whether height, weight or hairstyle—aren’t necessarily covered by the federal statute, says Steven Pearlman, a labor attorney at Proskauer Rose in Chicago. Plus, it’s often difficult to legally prove whether such biases were the reason for a candidate’s rejection.
Brent McCreary, a theatre ticketing director in New York, has found certain photo details can swing a hiring manager’s decision either way. His professional profile picture usually shows him with a favourite celebrity. At one point it was Britney Spears. Now it’s Kelly Clarkson.
The choice worked against him when he lost out on a revenue management job at a theme park three years ago. In the rejection note, the interviewer suggested a more professional LinkedIn photo.
A month later, though, the executive director of a San Francisco-based streaming platform contacted him. The job he’d applied for was already filled but she noticed his photo. “Your personality and background seem so fun and special,” she wrote in a LinkedIn message. When another project-management job opened soon after, McCreary got it. The job turned out to be a better fit for him, too, he says.
“The company I ended up working for was one where I kind of jelled with the organisation,” he says.
Looking the part is often informed by stories and stereotypes, career coaches say. “You see it in books and movies,” says Catherine Fisher, a LinkedIn career expert who studies data and trends on the professional social media network.

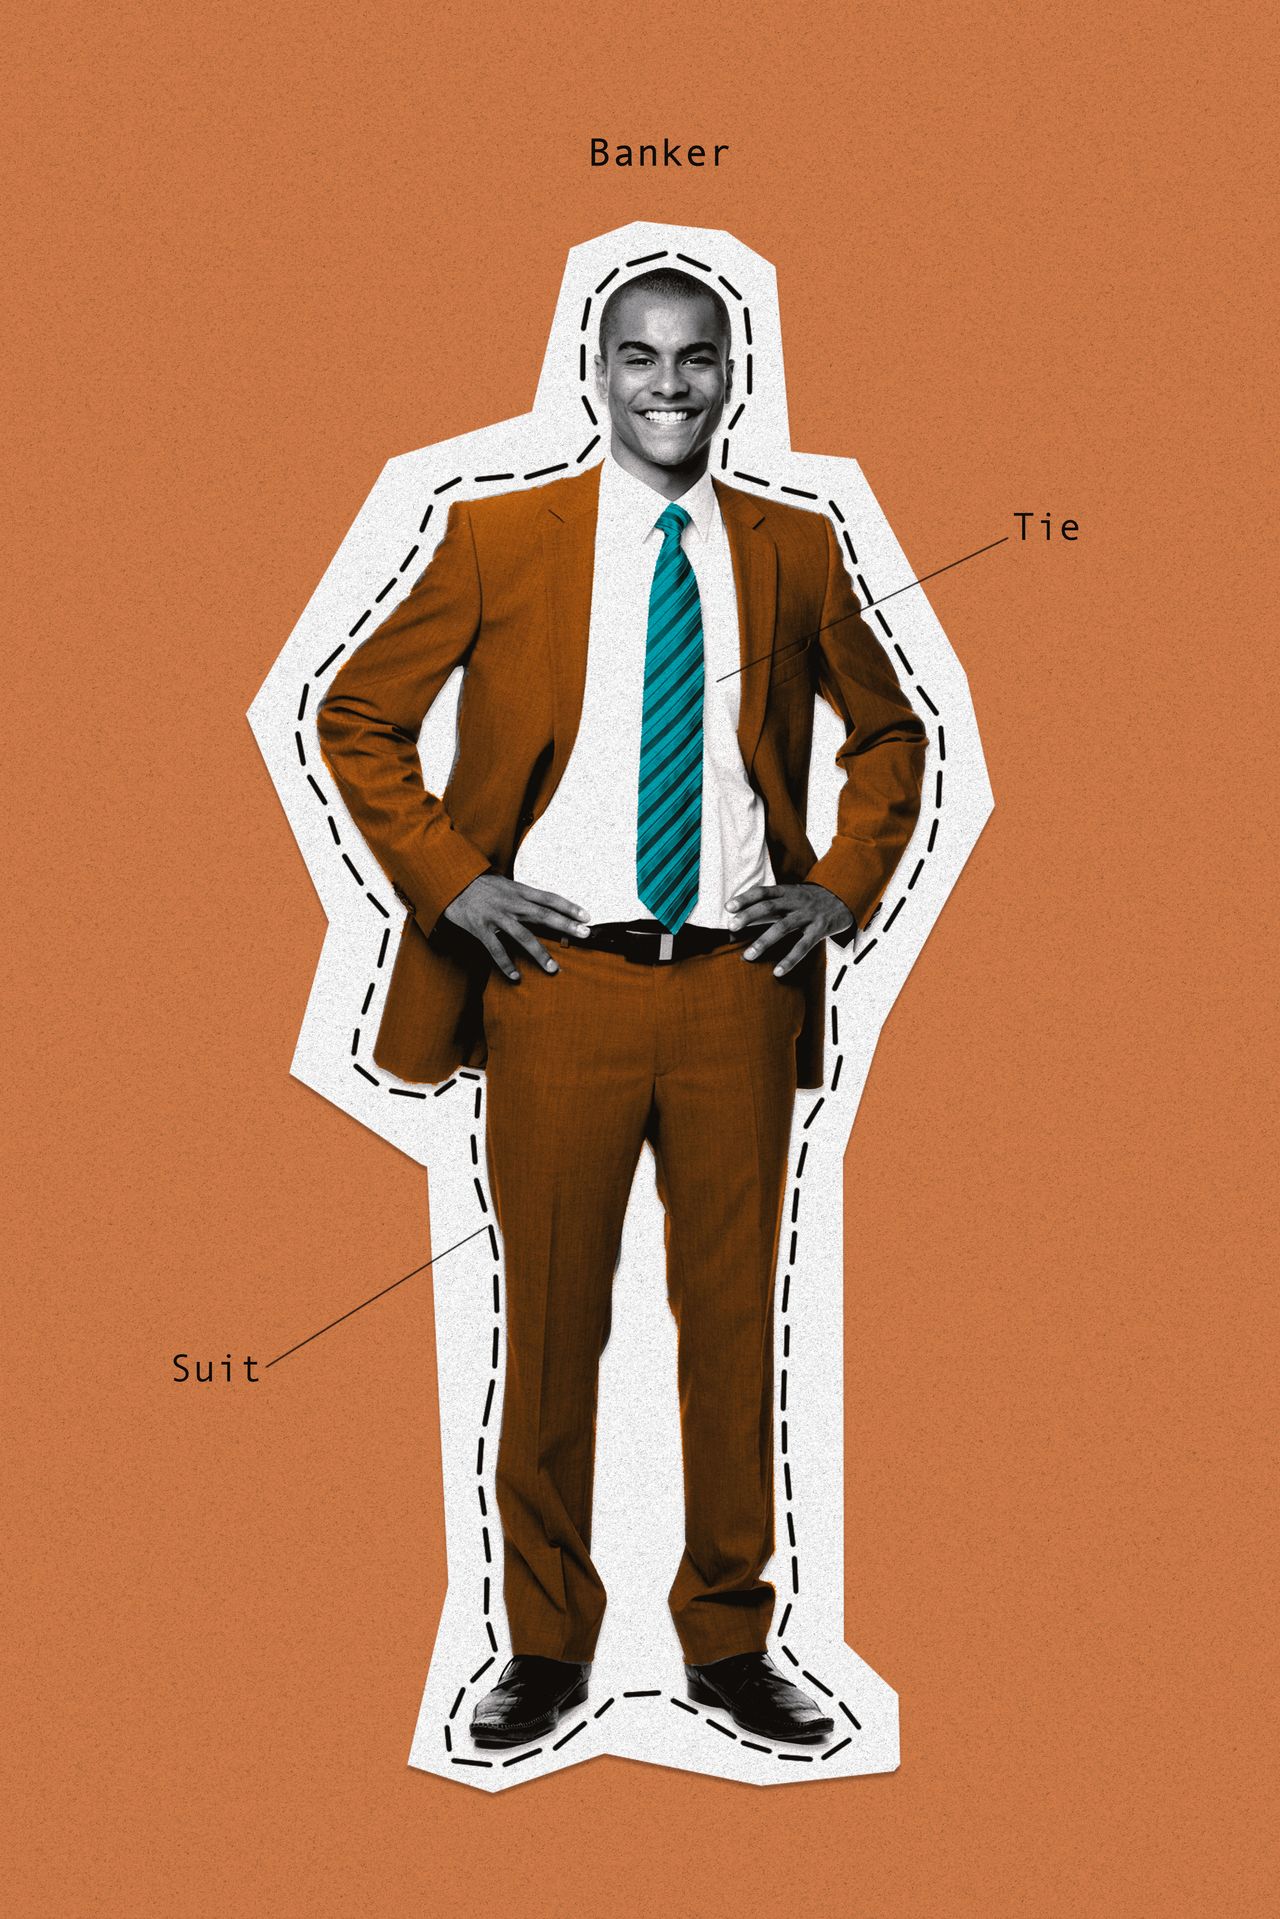
Every industry has its own sartorial vibe, from the fleeced vests and sweatshirts of Silicon Valley to the traditionally suited-up finance crowd in New York.
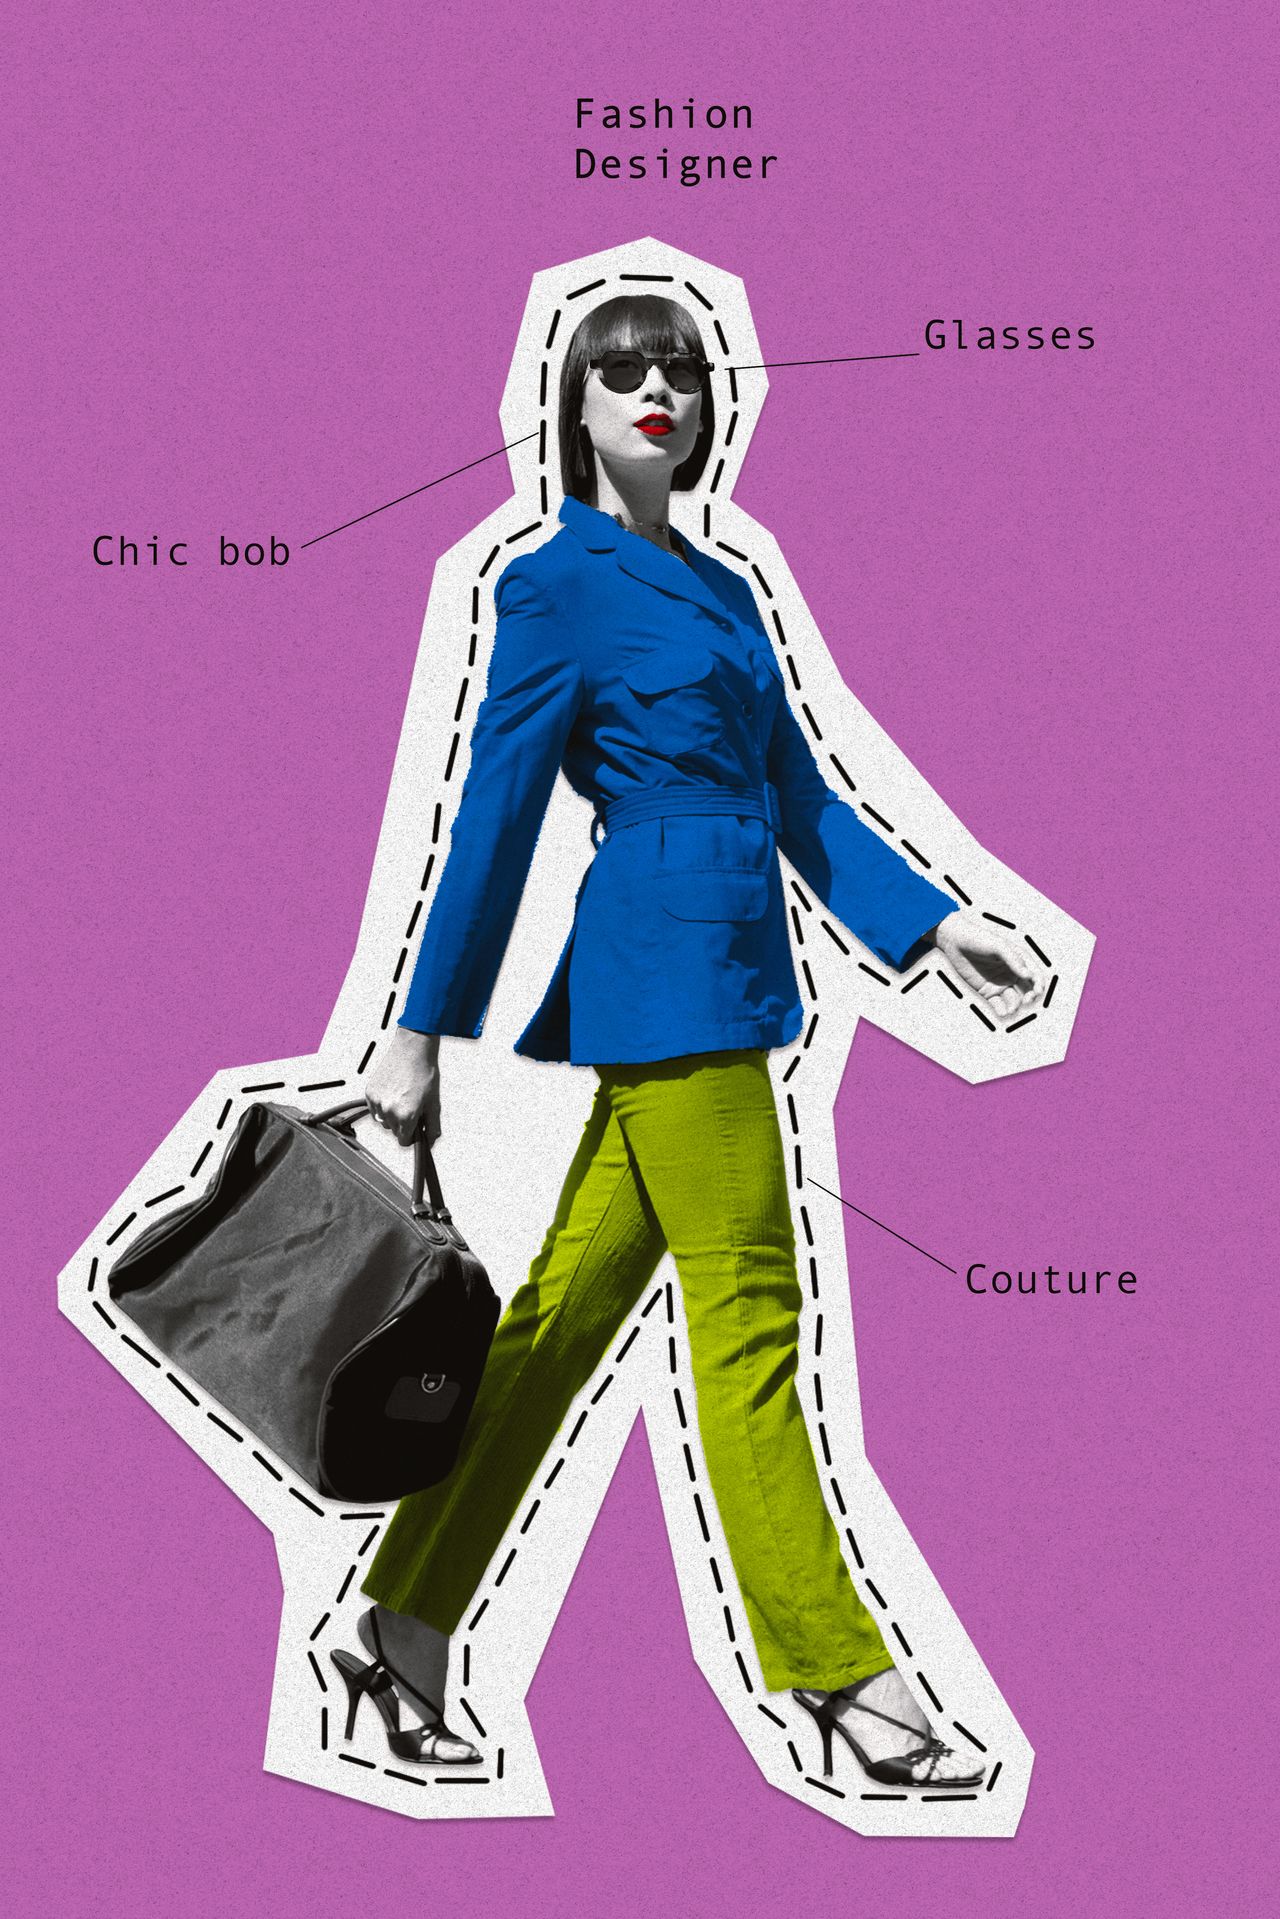
“You always think hoodies are related to tech companies, but that doesn’t mean I have to wear one,” Fisher says. By the same token, angular bobs and big sunglasses have come to be associated with the fashion industry, though “not everyone in fashion looks like Anna Wintour,” she says.
That’s rapidly changing as home and work life become more mixed, Fisher says. More than half of working Americans say that how they present themselves at work has changed since the pandemic, according to a poll of 2,000 people conducted last year by LinkedIn. Two-thirds said they thought that managers and co-workers were more accepting of different ways of dressing and styling than several years ago.
Alice Stephenson, a 42-year-old lawyer, says that for much of her early career, she dressed the part and concealed her piercings and tattoos. “I wore a stereotype of what a professional looked like,” she says. “I never felt comfortable or able to express my own individuality or creativity through my appearance.”
That changed after she started her own law firm. In her photo on the firm’s website, in her email signature and on LinkedIn, she is wearing a friendly smile, a blue sleeveless dress and a visible sleeve of tattoos.
“I want to look friendly and approachable,” says Stephenson, who lives in Amsterdam. “That’s key to my brand.”
 Copyright 2020, Dow Jones & Company, Inc. All Rights Reserved Worldwide. LEARN MORE


From bushland greens to valley reds, the country’s most awarded designers are proving that the best colour palette was never on a swatch card; it was outside the window all along.

The Australian leather house has opened an immersive four-day pop-up in Manhattan, unveiling its Bloom Collection and redefining what a product launch can look like.


The federal budget has rattled property investors. But the biggest mistake isn’t the tax changes, it’s the conclusion many are drawing from them.
2 min
The recent budget has forced a reckoning for property investors.
Negative gearing now restricted to new residential builds, the CGT discount gone and on paper, the numbers look different.
And many investors are responding by pivoting toward yield, prioritising cash flow over capital growth in a way that property strategists say misses the point entirely.
“The debate has shifted to yield versus growth as if they are opposing forces,” says Abdullah Nouh, founder of Melbourne-based buyers’ agency Mecca Property Group. “But that framing is itself the mistake.”
Nouh, who works with high-net-worth families and investors on long-term acquisition strategy, argues that capital growth remains the primary driver of genuine wealth creation and that the post-budget environment has made quality assets more important, not less.
The numbers make his case plainly. An additional $500 per week in rental income is welcome. A prestige asset appreciating by $1 million over a market cycle is transformative.
These are not equivalent outcomes, and portfolios built around yield at the expense of location and land value tend to generate income while wealth stands largely still.
The more nuanced shift Nouh is seeing among sophisticated investors is a move toward assets where both outcomes can be engineered simultaneously – established homes on substantial land in quality locations, where the existing dwelling can be repositioned, rental returns improved, and the underlying land value compounds independent of what sits on it.
For investors with existing equity, commercial property is also entering the conversation in a more serious way.
Prestige industrial assets, medical centres and long-leased essential retail offer income profiles that residential property in most capital city markets cannot currently match: longer lease terms, tenants covering outgoings, and greater predictability than the residential tenancy cycle.
“The investors who build lasting wealth are rarely the ones who chased yield or growth exclusively,” says Nouh.
“They are the ones who built a strategy they could sustain – one that generated enough income to hold quality assets through multiple cycles while those assets compounded in value.”
The budget has changed the settings. It has not changed the fundamentals.

When the Writers Festival was called off and the skies refused to clear, one weekend away turned into a rare lesson in slowing down, ice baths included.

ABC Bullion has launched a pioneering investment product that allows Australians to draw regular cashflow from their precious metal holdings.

