


Commodities Supercycle Looks Like A Stretch
Investors bet against history and predict a surge over extended period.

 4 min
4 min
Commodity markets are roaring, stirring a debate about whether prices are headed for an extended upswing. The history of booms and busts in raw materials suggests the conditions aren’t right.
Prices for Brent crude, the international benchmark in energy markets, have jumped 82% since the end of October. Copper is more expensive than it has been since 2011. Food hasn’t cost as much since 2014, according to a United Nations index.
Some investors and analysts say commodities are in the early stages of a supercycle. That is a period when prices of livestock, grains, metals, oil and gas all climb for years, even decades.
A prolonged upturn would present investors with an opportunity to make money from long-term bets on exchange-traded products that track commodity prices. Such vehicles bloomed in popularity when commodity markets soared in the 2000s and early 2010s, only to fall out of favour when prices tanked in 2014.
But the chances of commodity prices rising in tandem over a long period are slim. Such cycles are rare. They have occurred when a major economy such as the U.S. or China undergoes rapid industrialization or urbanization, creating demand for raw materials that existing supplies struggle to meet.
Economists say they don’t see a similar catalyst right now. A swift expansion in the global economy this year and next is likely to power demand. Beyond that, many analysts see oil consumption, in particular, slowing down.
“It pays investors, it pays policy makers to be a little bit sceptical of characterizing the developments of the past six to 12 months as the seeds of a new supercycle,” said David Jacks, a professor at Singapore’s Yale-NUS College who has studied the history of commodity markets.
Commodity prices are an important barometer for financial markets. Rising gasoline and energy costs contributed to a modest increase in the rate of U.S. inflation earlier this year. Expectations of a leap in consumer prices sent bond yields surging in recent weeks and cooled corners of the stock market.
When resources’ prices swing higher for an extended period, one of three things happens. The first is an economic shock, such as the recession in the 1970s, caused in part by the Arab oil embargo. The second is a rush of supply as miners, energy producers and farmers seek to cash in. Over time, people switch to cheaper alternatives.
Adjusting for inflation, U.S. crude prices in 2020 were well below their peaks from 2008 and 1980, though they were more than double the 1945 level, according to data compiled by Mr Jacks. Inflation-adjusted grain prices have dropped since World War II due to advances in crop science, Mr Jacks said.
The last supercycle occurred from the late 1990s, when a rapid expansion of cities and industry in China unleashed waves of demand for natural resources, according to Daniel Jerrett, chief investment officer at Stategy Capital LP. Supply was slow to respond and commodity prices, adjusting for inflation, shot up.
“Is there anything out there like that now? I don’t see it,” Mr Jerrett said.
The China-led supercycle kicked off with crude-oil and copper prices at their lowest level in more than a decade. That isn’t the case now: Copper prices, for instance, are close to record highs.
The current outlook for commodity prices is especially complicated because of a number of competing forces.
Some commodities have been swept up in the “everything rally’’ phenomenon. The roaring market for assets from stocks to bitcoin suggests investors are flush with cash and speculating that prices will keep rising. An influx of money into precious metals has started to reverse, showing how fast money can flow back out.
A big unknown is how the drive to cut carbon emissions shifts supply and demand for different commodities. Switching to cleaner sources of energy will likely turbocharge purchases of materials such as copper and nickel, bulls contend. Before those efforts choke off demand for gasoline and diesel, a dearth of investment in the oil industry could buoy crude prices, too.
For now, however, the oil market remains on life support from members of the Organization of the Petroleum Exporting Countries and Russia, which are holding millions of barrels of crude in the ground each day to bolster prices.
The production cuts and a recovery in demand in China and India have helped oil prices rebound since crashing last spring. Brent crude futures have gained a third this year to about $69 a barrel. Some investors are betting they could surpass their all-time high of $148 a barrel in 2008.
U.S. production won’t keep up with the recovery in consumption due to restrictions on drilling on federal lands and belt-tightening by producers, said Christyan Malek, head of oil and gas research at JPMorgan Chase & Co. Cutting emissions at wells will boost production costs, and big oil companies are investing in renewable-energy sources instead of crude, he added.
The world’s biggest independent oil trader doesn’t see an imminent supply crunch. “We have plenty of reserves in the ground, we have plenty of refining capacity and we have plenty of ships to move oil,” said Giovanni Serio, head of research at Vitol.
Copper prices have leapt 67% over the past year to about $9,100 a metric ton on the London Metal Exchange. Goldman Sachs Group sees them hitting an all-time high of $10,500 in the next 12 months, in part because the energy transition will require metals that store and transmit power.
There are bumps in the road. Metal prices are the beneficiary of booming demand for goods and the economy’s emergence from lockdown. Both fillips are likely to fade. Also, it will be years before green infrastructure and technologies devour metals such as lithium at a pace that propels prices upward, analysts say.
Traders say there is plenty of copper available right now. Teck Resources Ltd., Ivanhoe Mines Ltd. and others, meanwhile, are due to start producing at new mines in the next few years.
The current run-up in metal prices in part reflects the same forces that have driven the past year’s recovery in stocks and corporate bonds.
“Fiscal and monetary stimulus has underpinned the rally since last March,” said Tom Mulqueen, head of research at Amalgamated Metal Trading Ltd. “There’s just more money in financial markets.”
 Copyright 2020, Dow Jones & Company, Inc. All Rights Reserved Worldwide. LEARN MORE


This stylish family home combines a classic palette and finishes with a flexible floorplan

Just 55 minutes from Sydney, make this your creative getaway located in the majestic Hawkesbury region.


Governments around the world are offering incentives to reverse a downward spiral that could threaten economic growth
2 min
The Australian birth rate is at a record low, new data has shown.
Figures from the Australian Bureau of Statistics have revealed there were 286,998 births registered around the country last year, or 1.5 babies per woman.
Birth rates in Australia have been in a slow decline since the 1990s, down from 1.86 births per woman in 1993. Declining fertility rates among girls and women aged 15 to 19 years was most stark, down two thirds, while for women aged 40 to 44 years, the rate had almost doubled.
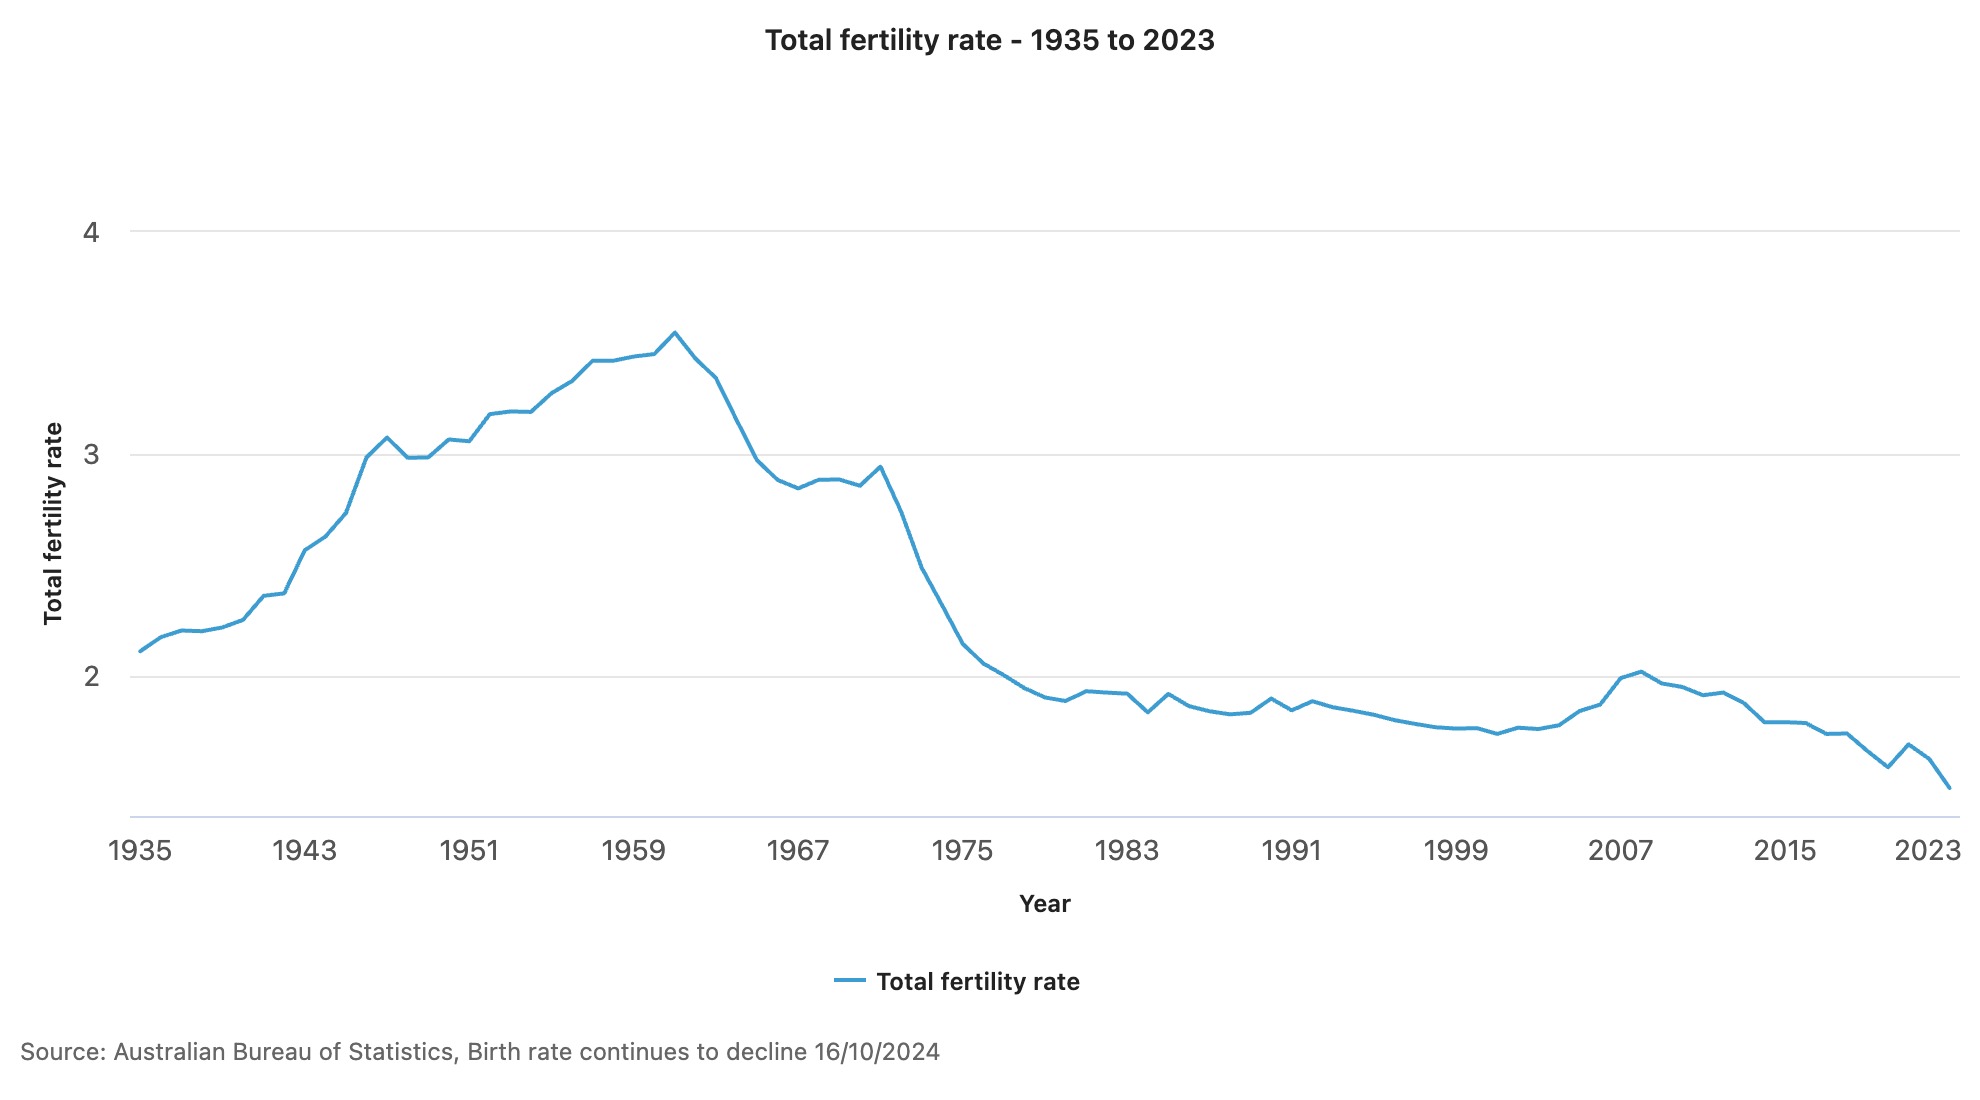
“The long-term decline in fertility of younger mums as well as the continued increase in fertility of older mums reflects a shift towards later childbearing,” said Beidar Cho, ABS head of demography statistics. “Together, this has resulted in a rise in median age of mothers to 31.9 years, and a fall in Australia’s total fertility rate.”
The fall in the Australian birth rate is in keeping with worldwide trends, with the United States also seeing fertility rates hit a 32-year low. The Lancet reported earlier this year that, based on current trends, by 2100 more than 97 percent of the world’s countries and territories “will have fertility rates below what is necessary to sustain population size over time”.
On a global scale, the Lancet reported that the total fertility rate had “more than halved over the past 70 years” from about five children per female in the 1950s to 2.2 children in 2021. In countries such as South Korea and Serbia, the rate is already less than 1.1 child for each female.
Governments around the world have tried to incentivise would-be parents, offering money, increased access to childcare and better paid maternity leave.
Experts have said without additional immigration, lower birth rates and an ageing population in Australia could put further pressure on young people, threaten economic growth and create economic uncertainty. However, a study released earlier this year by the University of Canberra showed the cost of raising a child to adulthood was between $474,000 and $1,097,000.
This stylish family home combines a classic palette and finishes with a flexible floorplan
Just 55 minutes from Sydney, make this your creative getaway located in the majestic Hawkesbury region.