Rising Interest Rates Mean Deficits Finally Matter
Investors ignored deficits when inflation was low. Now they are paying attention and getting worried.
The U.S. has long been the lender of last resort to the world. During the emerging-market panics of the 1990s, the global financial crisis of 2007-09 and the pandemic shutdown of 2020, it was the Treasury’s unmatched capacity to borrow that came to the rescue.
Now, the Treasury itself is a source of risk. No, the U.S. isn’t about to default or fail to sell enough bonds at its next auction. But the scale and upward trajectory of U.S. borrowing and absence of any political corrective now threaten markets and the economy in ways they haven’t for at least a generation.
That’s the takeaway from the sudden sharp rise in Treasury yields in recent weeks. The usual suspects can’t explain it: The inflation picture has gotten marginally better, and the Federal Reserve has signalled it’s nearly done raising rates.
Instead, most of the increase is due to the part of yields, called the term premium, which has nothing to do with inflation or short-term rates. Numerous factors affect the term premium, and rising government deficits are a prime suspect.

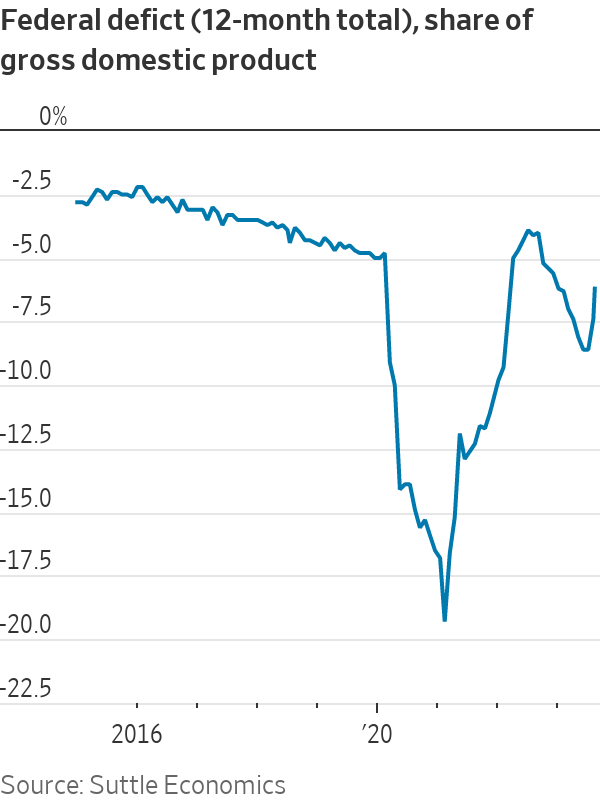
Deficits have been wide for years. Why would they matter now? A better question might be: What took so long?
That larger deficits push up long-term rates had long been economic orthodoxy. But for the past 20 years, interest-rate models that incorporated fiscal policy didn’t work, noted Riccardo Trezzi, a former Fed economist who now runs his own research firm, Underlying Inflation.
That’s understandable. Central banks—worried about too-low inflation and stagnant growth—had kept interest rates around zero while buying up government bonds (“quantitative easing”). Private demand for credit was weak. This trumped any concern about deficits.
“We had a blissful 25 years of not having to worry about this problem,” said Mark Wiedman, senior managing director at BlackRock.
Today, though, central banks are worried about inflation being too high and have stopped buying and in some cases are shedding their bondholdings (“quantitative tightening”). Suddenly, fiscal policy matters again.
To paraphrase Hemingway, deficits can affect interest rates gradually or suddenly. Investors, asked to buy more bonds, gradually make room in their portfolios by buying less of something else, such as equities. Eventually, the risk-adjusted returns of these assets equalise, which means higher bond yields and lower price/earnings ratios on stocks. That has been happening for the past month.
Sometimes, though, markets can move suddenly, such as when Mexico threatened to default in 1994 and Greece did default a decade later. Even in countries that, unlike Mexico or Greece, borrow in currencies they control, interest rates can become hostage to deficits, such as in Canada in the early 1990s or Italy in the 1980s and early 1990s.

The U.S. isn’t Canada or Italy; it controls the world’s reserve currency, and its inflation and interest rates are mostly driven by domestic, not foreign, factors. On the other hand, the U.S. has also exploited those advantages to accumulate debt and run deficits that are much larger than those of peer economies.
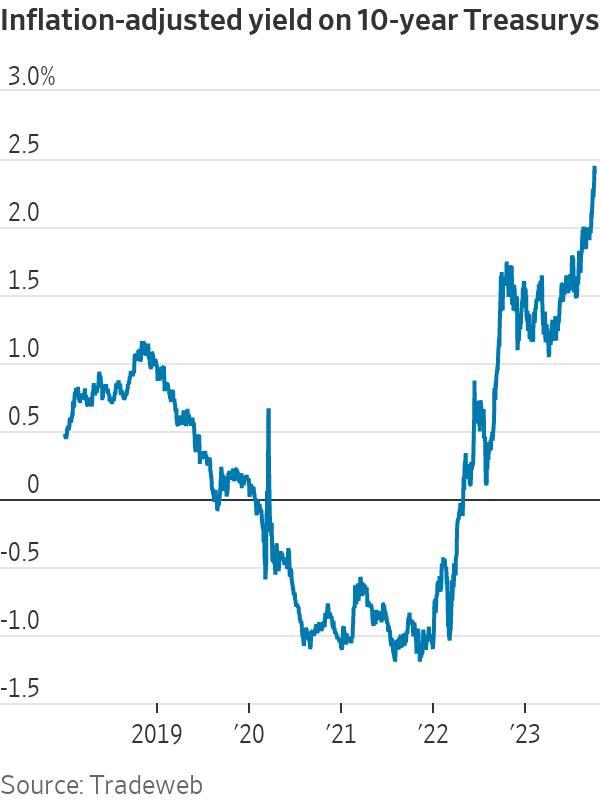
There’s not much sign that this has yet imposed a penalty. Investors still project that the Fed will get inflation down to its 2% goal. At 2.4%, real (inflation-adjusted) Treasury yields are comparable to those in the mid-2000s and lower than in the 1990s, when the U.S. government’s debts and deficits were much lower.
Still, sometimes bad news accumulates below investors’ radar until something brings their collective attention to bear. Could a point come when “all the headlines will be about the fiscal unsustainability of the U.S.?” asked Wiedman. “I don’t hear this today from global investors. But do I think it could happen? Absolutely, that paradigm shift is possible. It’s not that no one shows up to buy Treasurys. It’s that they ask for a much higher yield.”
It’s notable that the recent rise in bond yields came as Fitch Ratings downgraded its U.S. credit rating, Treasury upped the size of its bond auctions, analysts began revising upward this year’s federal deficit, and Congress nearly shut down parts of the government over a failure to pass spending bills.
The federal deficit was over 7% of gross domestic product in fiscal 2023, after adjusting for accounting distortions related to student debt, Barclays analysts noted last week. That’s larger than any deficit since 1930 outside of wars and recessions. And this is occurring at a time of low unemployment and strong economic growth, suggesting that in normal times, “deficits may be much higher,” Barclays added.
Abroad, fiscal policy has clearly begun to matter. Last fall, a proposed U.K. tax cut triggered a surge in British bond yields; the government scrapped the proposal, then resigned. Italian yields have risen since the government last week delayed reducing its deficit to below European guidelines. Trezzi said that for the past decade the European Central Bank had bought more than 100% of net Italian government bond issuance, but that’s coming to an end.
Foreign investors, worried about inflation and deficits, have been selling Italian bonds, while Italian households have been buying, Trezzi said. “With a weakening economy, it is unclear for how long…households can offset the selloff of foreigners.”
Investors looking for U.S. political will to rein in deficits would take note that both former President Donald Trump and President Biden, their parties’ front-runners for the 2024 presidential nomination, have signed deficit-busting legislation and that both of their parties have pledged not to cut the two largest spending programs, Medicare and Social Security, or raise taxes on most households.
They would also notice that the Republican speaker of the House of Representatives was just ousted by rebels in his own party because he had passed a bipartisan spending bill to prevent the government from shutting down. True, the rebels wanted less spending. But shutdowns, Barclays noted, represent “erosion of governance.” This isn’t how a country trying to reassure the bond market acts.
 Copyright 2020, Dow Jones & Company, Inc. All Rights Reserved Worldwide. LEARN MORE
This stylish family home combines a classic palette and finishes with a flexible floorplan
Just 55 minutes from Sydney, make this your creative getaway located in the majestic Hawkesbury region.
When will Berkshire Hathaway stop selling Bank of America stock?
Berkshire began liquidating its big stake in the banking company in mid-July—and has already unloaded about 15% of its interest. The selling has been fairly aggressive and has totaled about $6 billion. (Berkshire still holds 883 million shares, an 11.3% interest worth $35 billion based on its most recent filing on Aug. 30.)
The selling has prompted speculation about when CEO Warren Buffett, who oversees Berkshire’s $300 billion equity portfolio, will stop. The sales have depressed Bank of America stock, which has underperformed peers since Berkshire began its sell program. The stock closed down 0.9% Thursday at $40.14.
It’s possible that Berkshire will stop selling when the stake drops to 700 million shares. Taxes and history would be the reasons why.
Berkshire accumulated its Bank of America stake in two stages—and at vastly different prices. Berkshire’s initial stake came in 2017 , when it swapped $5 billion of Bank of America preferred stock for 700 million shares of common stock via warrants it received as part of the original preferred investment in 2011.
Berkshire got a sweet deal in that 2011 transaction. At the time, Bank of America was looking for a Buffett imprimatur—and the bank’s stock price was weak and under $10 a share.
Berkshire paid about $7 a share for that initial stake of 700 million common shares. The rest of the Berkshire stake, more than 300 million shares, was mostly purchased in 2018 at around $30 a share.
With Bank of America stock currently trading around $40, Berkshire faces a high tax burden from selling shares from the original stake of 700 million shares, given the low cost basis, and a much lighter tax hit from unloading the rest. Berkshire is subject to corporate taxes—an estimated 25% including local taxes—on gains on any sales of stock. The tax bite is stark.
Berkshire might own $2 to $3 a share in taxes on sales of high-cost stock and $8 a share on low-cost stock purchased for $7 a share.
New York tax expert Robert Willens says corporations, like individuals, can specify the particular lots when they sell stock with multiple cost levels.
“If stock is held in the custody of a broker, an adequate identification is made if the taxpayer specifies to the broker having custody of the stock the particular stock to be sold and, within a reasonable time thereafter, confirmation of such specification is set forth in a written document from the broker,” Willens told Barron’s in an email.
He assumes that Berkshire will identify the high-cost Bank of America stock for the recent sales to minimize its tax liability.
If sellers don’t specify, they generally are subject to “first in, first out,” or FIFO, accounting, meaning that the stock bought first would be subject to any tax on gains.
Buffett tends to be tax-averse—and that may prompt him to keep the original stake of 700 million shares. He could also mull any loyalty he may feel toward Bank of America CEO Brian Moynihan , whom Buffett has praised in the past.
Another reason for Berkshire to hold Bank of America is that it’s the company’s only big equity holding among traditional banks after selling shares of U.S. Bancorp , Bank of New York Mellon , JPMorgan Chase , and Wells Fargo in recent years.
Buffett, however, often eliminates stock holdings after he begins selling them down, as he did with the other bank stocks. Berkshire does retain a smaller stake of about $3 billion in Citigroup.
There could be a new filing on sales of Bank of America stock by Berkshire on Thursday evening. It has been three business days since the last one.
Berkshire must file within two business days of any sales of Bank of America stock since it owns more than 10%. The conglomerate will need to get its stake under about 777 million shares, about 100 million below the current level, before it can avoid the two-day filing rule.
It should be said that taxes haven’t deterred Buffett from selling over half of Berkshire’s stake in Apple this year—an estimated $85 billion or more of stock. Barron’s has estimated that Berkshire may owe $15 billion on the bulk of the sales that occurred in the second quarter.
Berkshire now holds 400 million shares of Apple and Barron’s has argued that Buffett may be finished reducing the Apple stake at that round number, which is the same number of shares that Berkshire has held in Coca-Cola for more than two decades.
Buffett may like round numbers—and 700 million could be just the right figure for Bank of America.
This stylish family home combines a classic palette and finishes with a flexible floorplan
Just 55 minutes from Sydney, make this your creative getaway located in the majestic Hawkesbury region.


