Americans in Their Prime Are Flooding Into the Job Market
Share of people between 25 and 54 working or seeking jobs rose this year to highest level since 2002

 4 min
4 min
The core of the American labour force is back.
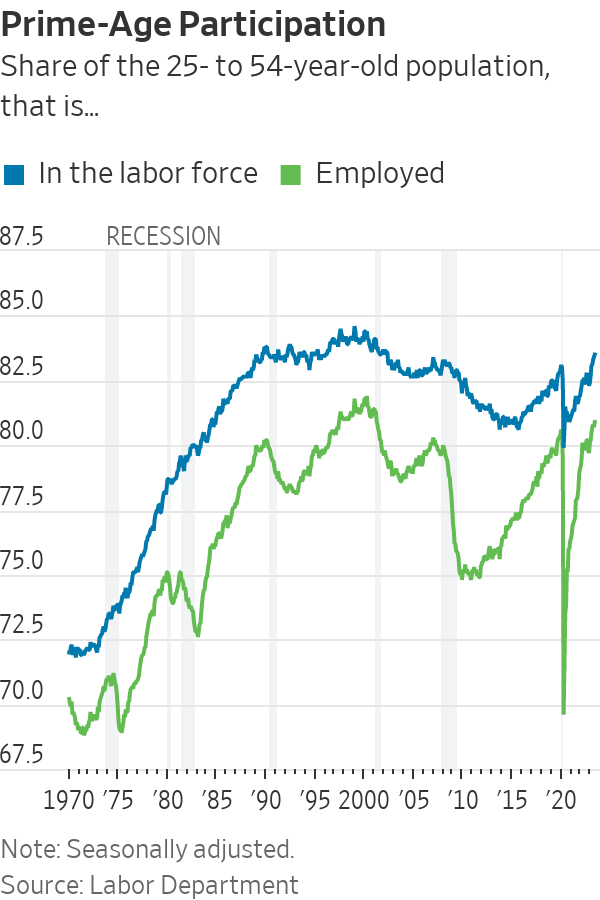
Americans between 25 and 54 years of age are either employed or looking for jobs at rates not seen in two decades, a trend helping to counter the exodus of older baby boomers from the workforce. Economists define that age range as in their prime working years—when most Americans are done with their formal education, aren’t ready to retire and tend to be most attached to the labor force.
In the first months of the pandemic, nearly four million prime-age workers left the labor market, pushing participation in early 2020 to the lowest level since 1983—before women had become as much of a force in the workplace. Prime-age workers now exceed pre pandemic levels by almost 2.2 million.
That growth is taking a little heat out of the job market and could help the Federal Reserve’s efforts to tamp down inflation by keeping wage growth in check.
Women lead the way
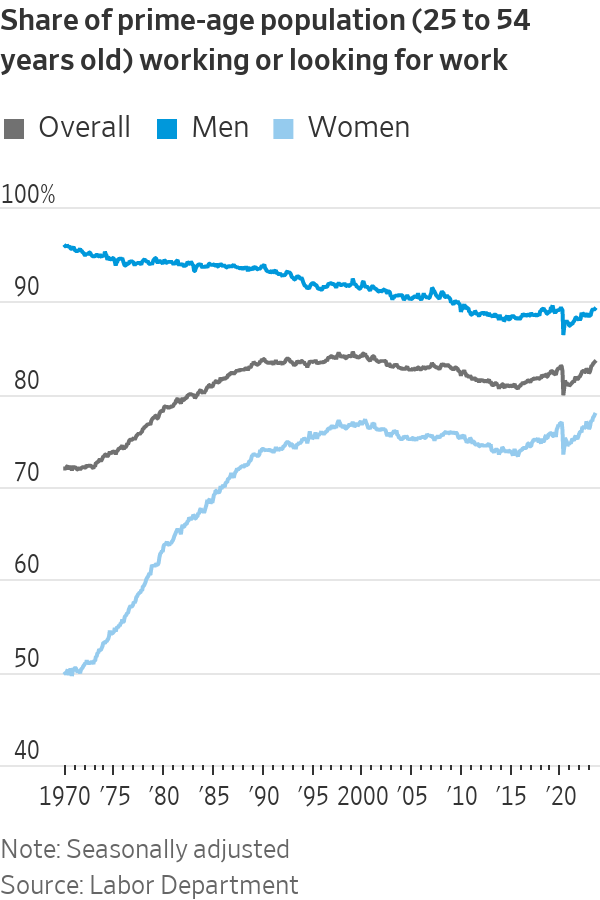
The resurgence of mid career workers is driven by women taking jobs.
The labor-force participation rate for prime-age women was the highest on record, 77.8% in June. That is well up from 73.5% in April 2020.
Men, however, tend to be employed at higher rates. The overall prime-age participation rate rose in June to 83.5%, the highest since 2002.
The big draw: a tight labor market. The unemployment rate has hovered near a half-century low for more than a year, and job openings outnumber the ranks of unemployed. Employers can’t be as choosy or selective, William Rodgers, vice president and director of the Institute for Economic Equity at the St. Louis Fed, said earlier this month.
Employers “are more apt to be willing to work with candidates—in this case it’s working with moms, or parents in general,” he said. “Tight labor markets can help to punish those who discriminate in hiring and compensation.”
Other factors are also at play. Women aren’t having as many children—there were about 3.66 million births in 2022, 655,000 fewer than the peak in 2007—so child-care responsibilities have decreased.
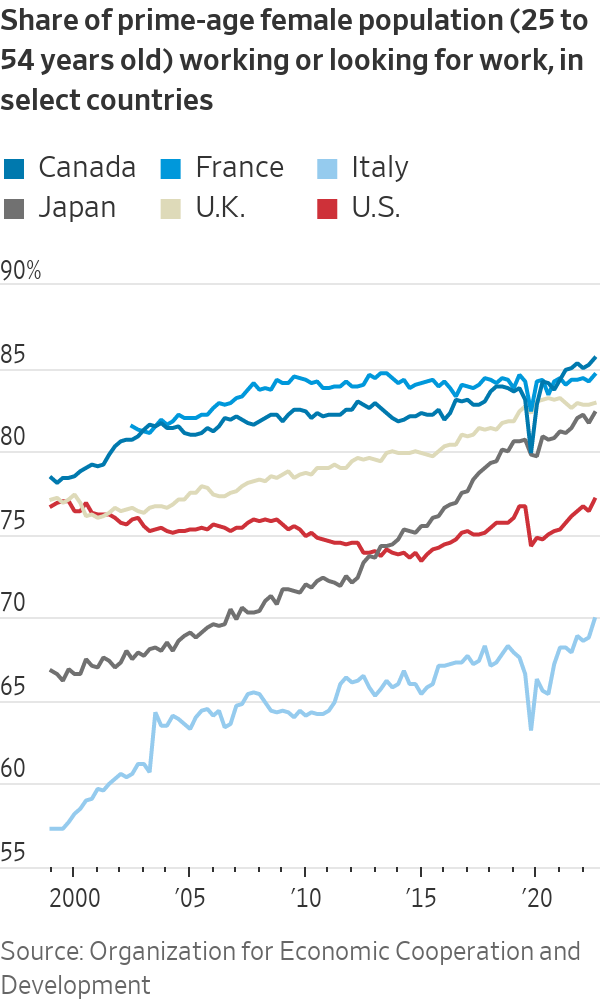
Julia Pollak, chief economist at ZipRecruiter, said it is possible for women’s participation to rise further if employers adopt or the government requires additional family-friendly policies. U.S. female participation lags behind that of other industrialised economies in part because of the cost of child care, which is subsidised elsewhere.
Rising wages lure workers, counter demographic shifts
Employers raised wages, offered employees more flexibility and improved benefits in recent years.
Average wage gains remain elevated this year and have recently surpassed inflation. And Americans are logging more hours of work from home than they did before the pandemic.
Employer recruitment efforts helped offset some broader demographic shifts, including an ageing population and rise in retirements.
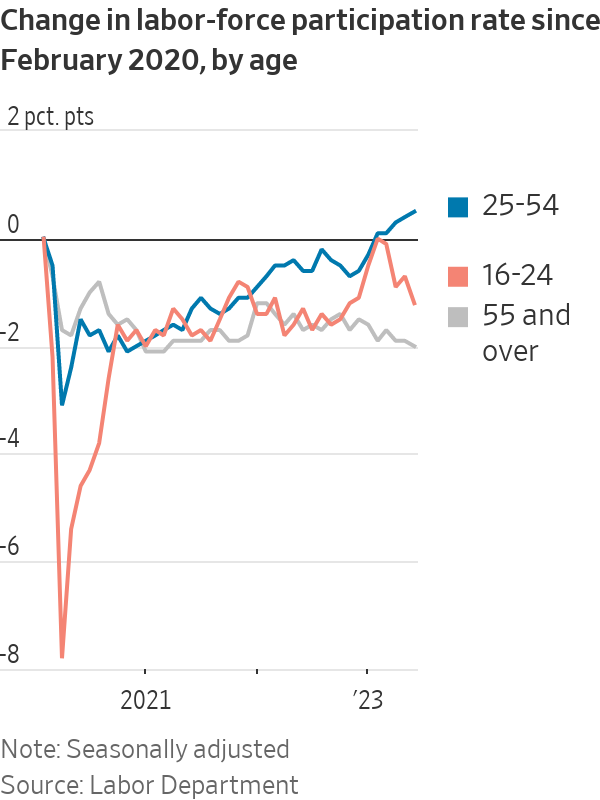
The share of the population age 55 and over in the labor force climbed steadily from the mid-1990s through the 2008 financial crisis and remained elevated for more than a decade. The Covid-19 pandemic pushed many out of the workforce, and some older workers haven’t returned, particularly those over 65.
Much of the decline in the overall participation rate was anticipated as baby boomers aged out of the workforce, but the rise in prime-age workers meant the drop wasn’t as steep.
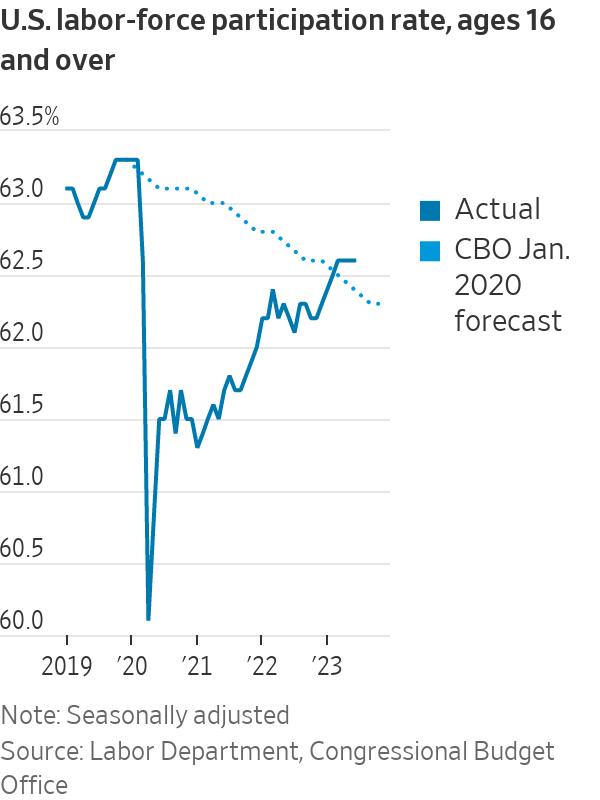
The Congressional Budget Office in January 2020, just before the pandemic hit, forecast the overall participation rate to deteriorate steadily through the 2020s, moving down to 62.4% in the second quarter of this year.
Instead, the rate was a couple of ticks higher in June at 62.6%, supported by prime-age workers.
“It seems like there is almost no cap on the supply of workers, only a speed limit on how fast we can bring them in,” Pollak said, referring to both rising prime-age participation and an influx of immigrants into the workforce.
Trends could turn if the economy cools
There are concerns that the Fed’s campaign to bring down inflation through higher interest rates will cause unemployment to rise too much and push some of the most vulnerable workers back to the sidelines.
The median forecast among Fed officials shows the unemployment rate rising to 4.1% by the end of this year and 4.5% next year from 3.6% in June, suggesting the economy will shed tens of thousands of jobs.
Labor-force participation tends to be cyclical, rising when the economy is strong and falling during downturns. A weaker labor market combined with structural barriers to employment could cap further gains.
With “current strength of labor demand set to fade, further progress from here will probably be more gradual,” Andrew Hunter, deputy chief U.S. economist at Capital Economics, said in a research note.
 Copyright 2020, Dow Jones & Company, Inc. All Rights Reserved Worldwide. LEARN MORE


As housing drives wealth and policy debate, the real risk is an economy hooked on growth without productivity to sustain it.

Limited to 630 units, Lamborghini’s latest Urus Capsule pushes personalisation further than ever, blending hybrid performance with over 70 bespoke design combinations.


As housing drives wealth and policy debate, the real risk is an economy hooked on growth without productivity to sustain it.
3 minFor decades, Australia has leaned into its reputation as the lucky country. But luck, as it turns out, is not an economic strategy.
What once looked like resilience now appears increasingly fragile. Beneath the surface of rising property values and steady headline growth, the Australian economy is showing signs of strain that can no longer be ignored.
Recent data paints a sobering picture. Australia has recorded one of the largest declines in real household disposable income per capita among advanced economies.
Wages have failed to keep pace with inflation, meaning many Australians are working harder for less. On a per capita basis, income growth has stalled and, at times, reversed.
And yet, on paper, things still look relatively solid. GDP is growing. Unemployment remains low. But that growth is increasingly being driven by population expansion rather than productivity.
More people are contributing to output, but not necessarily improving living standards.
That distinction matters.
For years, Australia’s economic success rested on a powerful combination: a once-in-a-generation mining boom, a credit-fuelled housing market, strong migration and a property sector that rarely faltered. Between 1991 and 2020, the country avoided recession entirely, building enormous wealth in the process.
But much of that wealth is tied to property. Around two-thirds of household wealth sits in real estate, inflated by leverage and sustained by demand. It has worked, until now.
The problem is the supply side of the economy has not kept up.
Housing supply is falling behind population growth. Rental vacancies are near record lows.
Construction firms are collapsing at an elevated rate. At the same time, massive infrastructure pipelines are competing with residential projects for labour and materials, pushing costs higher and delaying delivery.
The result is a system under pressure from all angles.
Despite near full employment, productivity growth has stagnated for years. In simple terms, Australians are putting in more hours without generating more output per hour. The economy is running faster, butgoing nowhere.
Meanwhile, government spending continues to expand. Public debt is approaching $1 trillion, with spending now accounting for a record share of GDP.
The gap between spending and revenue has been filled by borrowing for decades, adding further pressure to an already stretched system.
This is where the uncomfortable question emerges.
Has Australia become too reliant on a model driven by rising property values, expanding credit and population growth?
As asset prices rise, households feel wealthier and borrow more. Banks lend more. Governments collect more revenue. Migration fuels demand. The cycle reinforces itself.
But when productivity stalls and debt outpaces real income, the system begins to depend on constant expansion just to stay stable.
It is not a collapse scenario. But it is not particularly stable either.
Nowhere is this more evident than in housing.
The National Housing Accord targets 1.2 million new homes over five years, yet current completion rates are well below that pace. With approvals falling and construction costs rising, the gap between supply and demand is widening, not narrowing.
Housing is also one of the largest contributors to inflation, with costs rising sharply across rents, construction and utilities. Yet the private sector, from small investors to major developers, is struggling to make projects stack up in the current environment.
This brings the policy debate into sharper focus.
Tax settings such as negative gearing and capital gains concessions have undoubtedly boosted demand over the past two decades. But they have also supported supply. Removing them may ease prices briefly, but risks deepening the supply shortage over time.
That is the paradox.
Policies designed to make housing more affordable can, in practice, make the shortage worse if they discourage development. The optics may appeal, but the economics are far less forgiving.
It is also worth remembering that most property investors are not institutional players. The majority own just one investment property. They are, in many cases, ordinary Australians using real estate as their primary wealth-building tool.
Undermining that system without replacing it with a viable alternative risks unintended consequences, from reduced supply to higher rents and increased inflation.
So where does that leave Australia?
At a crossroads.
The country can continue to rely on population growth and rising asset prices to drive economic activity. Or it can shift towards a model built on productivity, innovation and sustainable growth.
The latter is harder. It requires structural reform, long-term thinking and political discipline.
But it is also the only path that leads to genuine, lasting prosperity.
The question is no longer whether Australia has been lucky.
It is whether it can evolve before that luck runs out.
Paul Miron is the Co-Founder & Fund Manager of Msquared Capital.

Rugged coastal drives and fireside drams define a slow, indulgent journey through Scotland’s far north.

Now complete, Ophora at Tallawong offers luxury finishes, 10-year defect insurance and standout value from $475,000.