Amid Geopolitical Concerns, Major Philanthropy Continues to Forge Ahead…Creatively

 3 min
3 min
Even amid two international conflicts and an upcoming U.S. presidential election, some philanthropic leaders are optimistic about the direction of overall giving through 2024.
Penta spoke with heads of several non-profits and leading philanthropists to gauge whether charitable giving will continue its reported slump from 2023 or rebound alongside renewed interest in various political and economic issues.
“Contrary to what some might expect, philanthropy has had resilience in these times,” says Stacy Huston, executive director of Sixdegrees.org, a youth empowerment non-profit based in Virginia founded by actor Kevin Bacon in 2007.
Huston’s view echoes recent data from the biennial Bank of America Study of Philanthropy published last year, which found that while affluent giving is largely down, the value of the average philanthropic gift is up 19%, surpassing pre-pandemic levels.
The notion of what these gifts look like is changing, and is partially responsible for the growth. Philanthropy can be executed through more avenues than ever, whether through celebrity association, tech titans stewarding large endowments, or athletes using their platforms to advocate for and create meaningful change.
“The industry and movement is creating new models, and you want to get it right,” says Scott Curran, CEO of Chicago-based Beyond Advisers. “No one should take their foot off the gas pedal.”
Curran spent a number of years with the Clinton Foundation in its infancy before leaving in 2016 to open his own consultancy, which focuses on philanthropy strategy at the highest levels. Curran and his team work with celebrities, athletes, multi-generational family foundations, and other affluent givers who need guidance in directing their philanthropic efforts. It’s a growing area of interest: Over half of affluent households with a net worth between US$5 million and US$20 million have, or are planning to establish, “some kind of giving vehicle” within the next three years, according to the Bank of America report.
Corporate philanthropy, rather than individual giving, is the cornerstone of Marcus Selig’s work as chief conservation officer at the National Forest Foundation, a Congressionally chartered non-profit based in Montana responsible for protecting millions of acres of public lands.
“Our outlook is business as usual,” he says, advising that giving may slow down, but not enough for the foundation to change course.
Factors such as political polarisation in the U.S. and the wars in Eastern Europe and the Middle East are pushing nonprofits to consider their niche, and how they might work with other groups, both on the corporate and philanthropic levels, Selig says.
“It leads to a little more sharing on the ground in what needs to be done,” he adds.
Steve Kaufer , founder of Massachusetts-headquartered e-commerce giving platform Give Freely and founder of TripAdvisor, says that the economy has a much bigger role in election years, as he looks to build and grow something that can act as a “counterbalance.”
“There’s a trend towards democratisation, and acting collectively can lead to greater impact,” he says.
Kaufer’s new platform hopes to leverage the everyday philanthropist through online shopping dollars to benefit major charity partners like UNICEF and charity:water, who earn funds as shoppers choose an organisation to benefit through an online clickthrough process.
“Whether a good year or bad year, e-commerce will continue to keep growing,” he says. “Nobody doubts that.”
Whether a legacy foundation, corporation or individual, the political landscape this year is requiring some to exercise caution as they consider what their own charitable actions might be and how it could be viewed more broadly. For the personal philanthropist, every move is now scrutinised more closely. On the nonprofit side, entities are exercising more due diligence to understand if a specific donor aligns with their mission and that there aren’t any underlying issues that could cause greater pushback.
“You have to be able to walk the walk,” Huston says. “For example, we’ve had to turn down very large donor checks from corporations because there’s a Reddit stream calling them out on their human rights practices.”
She adds that even a routine charity activation could now be aligned with a political party, and that adds complexities to how a higher-profile organisation like Six Degrees can activate, especially as the film Footloose turns 40 in 2024 (which Bacon starred in).
“A lot of organisations and states want to align themselves with this feel good moment, and we should be able to stand side by side with everyone, but we have to be aware,” she says.
Another topic attracting donor interest today is mental health, an area that historically has been underfunded and under-resourced by philanthropy, according to Two Bridge partner Harris Schwartzberg, who has been closely linked to the mental health space for more than a decade.
Today, the issue for mental health nonprofits is less about resources and more about societal divisiveness and polarisation around the topic. There’s an “overwhelming demand” for solutions, but the space is in a “perfect storm” for the broader political issues to make things worse, Schwartzberg says.
In Curran’s opinion, the storms brewing are troublesome, but they are also creating new opportunities for corporate and personal giving. The current state of philanthropy is one of “dynamic, expansive, and blurred lines,” meaning a careful blending of targeted giving combined with an understanding of the broader geopolitical landscape could lead to a successful overall philanthropic strategy.
“There are a lot of headlines that distract, but shouldn’t,” he says. “2024 needs more serious philanthropists than ever.”
 Copyright 2020, Dow Jones & Company, Inc. All Rights Reserved Worldwide. LEARN MORE





From making unpopular decisions to learning when to listen, leaders from five businesses reveal what nobody prepared them for — and how running a company has challenged their expectations.

Technology and semiconductor shares fell sharply as investors questioned the debt financing the AI infrastructure boom and confronted higher rates and Chinese competition.

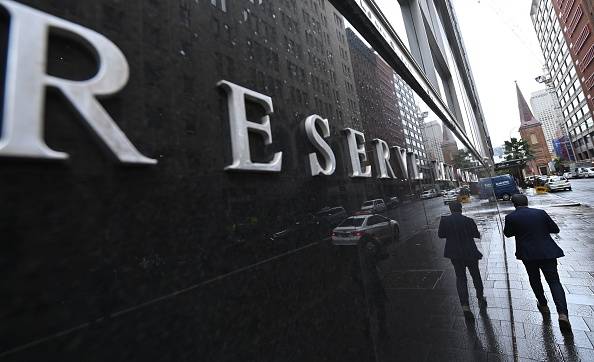
Technology and semiconductor shares fell sharply as investors questioned the debt financing the AI infrastructure boom and confronted higher rates and Chinese competition.
4 minA sharp technology sell-off has exposed a new anxiety on global markets: whether the enormous borrowing behind the artificial-intelligence infrastructure boom can generate sufficient returns as interest rates rise and Chinese competition intensifies.
The artificial-intelligence investment boom has powered technology shares, semiconductor manufacturers and data-centre operators to extraordinary heights. Last week, investors were given a reminder that much of this expansion is being built with borrowed money.
The technology-heavy Nasdaq Composite fell 4.5 per cent over the week ended October 16, its weakest performance since late June. Semiconductor shares suffered an even deeper correction, with the Philadelphia Semiconductor Index losing about 11.4 per cent.
The selling spread quickly through global markets. Micron Technology fell 14.6 per cent over the week, while South Korea’s Samsung Electronics and SK Hynix dropped approximately 18 per cent and 24 per cent respectively.
This was more than a routine bout of profit-taking. Investors were reassessing three interconnected risks: higher interest rates, the rapidly expanding debt burden attached to AI infrastructure and the prospect of stronger competition from Chinese memory-chip manufacturers.
The debt behind the AI build-out
Artificial intelligence requires a physical infrastructure network of enormous scale. Data centres must be built, advanced processors purchased, power supplies secured and cooling systems installed before customers begin generating meaningful revenue from them.
Technology companies are increasingly supplementing their own cash with corporate bonds, syndicated loans, equipment leases, private credit and project-level financing.
JPMorgan describes the emerging funding model as a combination of conventional corporate borrowing and project finance tied to individual data-centre assets. In Australia, the Reserve Bank estimates that syndicated loans accounted for approximately three-quarters of data-centre financing during 2025 and 2026 to date.
The numbers are becoming large enough to affect broader credit markets. The Federal Reserve Bank of Dallas has cited Wall Street estimates suggesting AI-related investment-grade bond issuance could approach US$300 billion in 2026 alone.
That borrowing is not automatically problematic. Debt can be an efficient way to finance long-lived infrastructure when future revenue is sufficiently predictable. The concern is that AI technology, customer demand and computing economics are changing much faster than the repayment schedules attached to the assets.
A data centre financed today may carry debt for years. Investors must therefore make assumptions about future utilisation rates, electricity prices, chip performance, customer concentration and the amount businesses will ultimately pay for AI computing.
When interest rates rise, those assumptions become less forgiving.
Inflation changes the calculation
September’s US inflation data intensified the pressure. Consumer prices increased 3.7 per cent over the year, ahead of market expectations and up from 3.4 per cent in August.
The hotter reading reduced confidence that interest rates would fall quickly and pushed bond yields higher. That matters particularly for companies whose valuations depend on profits expected well into the future, as well as highly leveraged infrastructure operators that may need to refinance.
CoreWeave has emerged as a closely watched test case. The specialist cloud-computing company has accumulated substantial debt and lease obligations to build AI capacity, while relying on a concentrated group of large technology customers.
Its shares fell sharply during the sell-off, while the cost of insuring its debt against default climbed. CoreWeave has argued that its contracted backlog more than covers its obligations and that financial markets do not always understand its business model. Nevertheless, its securities have become a proxy for investor confidence in debt-funded AI infrastructure.
Oracle, another major investor in AI computing capacity, fell 8.8 per cent in Friday trading, while CoreWeave dropped 15.5 per cent.
The question is shifting from how much AI infrastructure can be built to how profitably it can be operated.
China adds another source of pressure
Interest rates were not the only catalyst. Reports of advances by Chinese memory-chip producer ChangXin Memory Technologies raised concerns that lower-cost Chinese products could increase competition across the global semiconductor industry.
Memory chips are essential to AI systems, but the industry is historically cyclical. Periods of tight supply and high pricing can encourage rapid investment, eventually producing oversupply and falling margins.
The prospect of a well-funded Chinese competitor expanding its technological capabilities unsettled investors in Samsung, SK Hynix and Micron. It also demonstrated that AI-related demand does not insulate chipmakers from conventional competitive pressures.
That combination—slower rate cuts, more expensive financing and potentially cheaper supply—challenged the assumption that every company exposed to AI would enjoy continually expanding margins.
A reset rather than the end of the boom
The sell-off does not establish that the AI boom is ending. Demand for computing power remains strong, the largest technology companies continue to generate formidable cash flows and many infrastructure projects are backed by long-term customer contracts.
What has changed is the market’s willingness to overlook the price and financing structure of that growth.
The most resilient companies are likely to be those able to fund investment from operating cash flow, secure long-duration customers and demonstrate that new capacity will earn returns comfortably above its financing costs.
More speculative operators may face greater scrutiny, particularly where debt is expensive, customers are concentrated or expected revenue depends on demand that has not yet materialised.
For Australian investors, the lesson extends beyond US technology shares. Local data-centre operators, infrastructure funds, electricity suppliers and property groups are increasingly exposed to the same investment cycle.
Artificial intelligence may remain one of the defining growth themes of the decade. But last week’s correction showed that enthusiasm for the technology does not eliminate financial discipline.
The next stage of the AI boom will be judged not only by computing power, model performance or demand for chips, but by something more traditional: whether the assets being financed can generate enough cash to repay the money borrowed to build them.
Fact box
Nasdaq Composite: Down 4.5 per cent for the week ended October 16, 2026
Philadelphia Semiconductor Index: Down approximately 11.4 per cent
Micron Technology: Down approximately 14.6 per cent
Samsung Electronics: Down approximately 18 per cent
SK Hynix: Down approximately 24 per cent
US September inflation: 3.7 per cent annually
Estimated 2026 AI-related investment-grade issuance: Approximately US$300 billion

The Perpetual Padellone draws its name from the coveted reference 8171 while introducing an instantaneous complete annual calendar to Rolex’s modern Perpetual collection.

A bold new era for Australian luxury: MAISON de SABRÉ launches The Palais, a flagship handbag eight years in the making.