As India Overtakes China in Population, Will Its Stock Market, Too?
The key, say some economists, is to look at the ratio of those who are middle age to those who are older
Is India’s stock market a better long-term bet than China’s?
Some economists think so, now that India is on track to become the world’s most populous nation. Demography, they believe, is destiny.
While China’s population has long been the largest in the world, the two countries are now neck and neck, at roughly 1.4 billion people each, according to the United Nations. India will be No. 1 sometime this year, if it isn’t there already. And by the year 2100, India’s population is projected to be 1.5 billion, while China’s is projected to be 800 million.
A larger population doesn’t automatically translate into a stronger economy or a better-performing stock market, says Alejandra Grindal, chief economist at Ned Davis Research. The more important variable when projecting economic growth is the size of the working-age population. When it comes to the stock market’s long-term prospects, furthermore, it is the size of “the maturing age population that is important,” she says.
The MO ratio
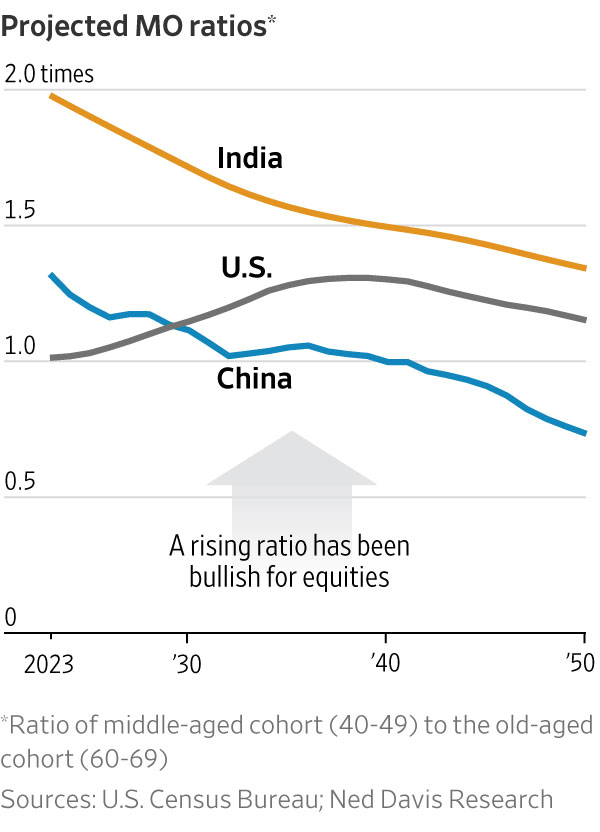
The indicator that perhaps best captures the relative size of these two groups is the so-called MO ratio, says John Geanakoplos, an economics professor at Yale University. The numerator of this ratio—“M,” for middle-aged—is the number of those ages 40 to 49, while the denominator—“O,” for old—contains those from ages 60 to 69. Prof. Geanakoplos is the co-author of an academic paper, published in 2002, documenting that demographic variables such as the MO ratio historically have been significantly correlated with the stock market.

Prof. Geanakoplos says the correlation stems from the fact that the MO ratio is a good proxy for how many people in a country are saving and investing for retirement relative to how many are withdrawing money from the stock market to pay for their retirement. When the ratio is high, there are more savers and investors relative to spenders, which means that capital will be relatively plentiful and interest rates will be lower than they would otherwise be. That in turn means that the discounted value of companies’ future earnings and dividends will be higher. When the ratio is low, in contrast, interest rates will tend to be higher and the present value of future earnings and dividends will be lower.
Prof. Geanakoplos adds that the absolute level of the MO ratio is less important for the stock market’s prospects than its trend. That poses a special challenge to China’s stock market over the longer term, since the country’s MO ratio is projected to decline precipitously over the next several decades—from its current 1.32 to 0.73 in 2050, according to data from Ned Davis Research. This means there will be nearly a doubling in the number of retirees in China pulling money out of the economy and the stock market between now and 2050, relative to the number who are saving and investing.
“Insofar as demography is destiny” Prof. Geanakoplos says, “the long-term prospects for the Chinese stock market are relatively poor.”
India’s MO ratio, in contrast, is projected to decline at a more moderate pace over the next three decades compared with China’s, from its current 1.98 to 1.34. That means that, though demographic factors will be headwinds to both countries’ stock markets in coming decades, not tailwinds, those headwinds will be stronger in China than in India.
Other factors
Ms. Grindal says that while the impact of population trends shouldn’t be minimised, there are many other factors—both political and economic—that will influence the two countries’ economics and stock markets in coming decades.
To put into perspective the demographic headwinds that China and India will be facing, consider the U.S.’s MO ratio. According to Ned Davis Research data, the ratio is projected to rise from its current 1.01 to 1.31 by the end of the 2030s, before declining to 1.15 by 2050. This increase will come as a surprise to many, given recent media attention to Social Security’s financing shortfall. But, Ms. Grindal points out, the millennial generation “is about the same size, if not slightly larger, than the baby boom population,” and is about to enter the 40-49 age cohort. That’s largely what will cause the U.S. MO ratio to rise. Relative to China and India, in other words, the U.S. MO appears quite favourable.
 Copyright 2020, Dow Jones & Company, Inc. All Rights Reserved Worldwide. LEARN MORE
This stylish family home combines a classic palette and finishes with a flexible floorplan
Just 55 minutes from Sydney, make this your creative getaway located in the majestic Hawkesbury region.
Continued stagflation and cost of living pressures are causing couples to think twice about starting a family, new data has revealed, with long term impacts expected
Australia is in the midst of a ‘baby recession’ with preliminary estimates showing the number of births in 2023 fell by more than four percent to the lowest level since 2006, according to KPMG. The consultancy firm says this reflects the impact of cost-of-living pressures on the feasibility of younger Australians starting a family.
KPMG estimates that 289,100 babies were born in 2023. This compares to 300,684 babies in 2022 and 309,996 in 2021, according to the Australian Bureau of Statistics (ABS). KPMG urban economist Terry Rawnsley said weak economic growth often leads to a reduced number of births. In 2023, ABS data shows gross domestic product (GDP) fell to 1.5 percent. Despite the population growing by 2.5 percent in 2023, GDP on a per capita basis went into negative territory, down one percent over the 12 months.
“Birth rates provide insight into long-term population growth as well as the current confidence of Australian families,” said Mr Rawnsley. “We haven’t seen such a sharp drop in births in Australia since the period of economic stagflation in the 1970s, which coincided with the initial widespread adoption of the contraceptive pill.”
Mr Rawnsley said many Australian couples delayed starting a family while the pandemic played out in 2020. The number of births fell from 305,832 in 2019 to 294,369 in 2020. Then in 2021, strong employment and vast amounts of stimulus money, along with high household savings due to lockdowns, gave couples better financial means to have a baby. This led to a rebound in births.
However, the re-opening of the global economy in 2022 led to soaring inflation. By the start of 2023, the Australian consumer price index (CPI) had risen to its highest level since 1990 at 7.8 percent per annum. By that stage, the Reserve Bank had already commenced an aggressive rate-hiking strategy to fight inflation and had raised the cash rate every month between May and December 2022.
Five more rate hikes during 2023 put further pressure on couples with mortgages and put the brakes on family formation. “This combination of the pandemic and rapid economic changes explains the spike and subsequent sharp decline in birth rates we have observed over the past four years,” Mr Rawnsley said.
The impact of high costs of living on couples’ decision to have a baby is highlighted in births data for the capital cities. KPMG estimates there were 60,860 births in Sydney in 2023, down 8.6 percent from 2019. There were 56,270 births in Melbourne, down 7.3 percent. In Perth, there were 25,020 births, down 6 percent, while in Brisbane there were 30,250 births, down 4.3 percent. Canberra was the only capital city where there was no fall in the number of births in 2023 compared to 2019.
“CPI growth in Canberra has been slightly subdued compared to that in other major cities, and the economic outlook has remained strong,” Mr Rawnsley said. “This means families have not been hurting as much as those in other capital cities, and in turn, we’ve seen a stabilisation of births in the ACT.”
This stylish family home combines a classic palette and finishes with a flexible floorplan
Just 55 minutes from Sydney, make this your creative getaway located in the majestic Hawkesbury region.


