ASX Reporting Season 2026: 5 Biggest Winners and Losers So Far
Overall, the season showed that share prices react less to whether profits rose or fell than to the gap between results and expectations
 5 min
5 min
Reporting season has once again reminded investors that a strong profit does not guarantee a rising share price, and a large loss does not always trigger a sell-off. What matters most is how each result compares with expectations and, increasingly, what management says about the year ahead. During the August 2026 season, companies offering credible turnarounds or unexpectedly strong guidance were rewarded handsomely, while those flagging weaker margins, slowing demand or greater uncertainty were punished.
The following ranking draws on Morningstar’s review of 164 ASX-listed companies and measures each company’s share-price movement on the day it reported. This captures the market’s immediate response to the earnings announcement, before subsequent economic developments, dividends and company-specific news cloud the picture. Here are the five biggest winners, and the five hardest-hit losers, of the season so far.
The five winners
1. Bapcor (ASX:BAP): +41.0%
Bapcor delivered reporting season’s largest relief rally after presenting early evidence that its troubled automotive-parts business was stabilising. Although underlying revenue fell 1.8% to $1.92 billion and underlying NPAT collapsed 85% to $10.8 million, underlying EBITDA of $152.5 million exceeded guidance.
More importantly, working-capital initiatives released $68.5 million in the second half, lifting cash conversion to 109.4% and reducing net debt by 63% to $135 million. The statutory loss was $431.6 million, largely because of non-cash impairments. Investors focused on improving operational momentum, stronger liquidity and management’s expectation of modest FY27 revenue growth.
2. Zip Co (ASX:ZIP): +18.2%
Zip comfortably surpassed its FY26 targets, sending the buy-now-pay-later provider’s shares sharply higher. Transaction volume rose 23% to $16.7 billion, while cash earnings before tax, depreciation and amortisation jumped 58% to a record $268.9 million. Statutory profit climbed 46% to $116.4 million, and the cash operating margin expanded by 4.2 percentage points to 20%.
The strongest signal was guidance for FY27 cash earnings of $340 million—around 26% growth and above analysts’ forecasts. US transaction volume increased 42.5% and now represents three-quarters of group volume, offsetting weaker customer activity in Australia.
3. CSL (ASX:CSL): +17.3%
CSL’s result was hardly spectacular in isolation, but it cleared a market bar that had fallen dramatically following earlier downgrades and restructuring announcements. Underlying NPATA was US$3.1 billion, down 2% in constant-currency terms, while operating cash flow reached US$3.51 billion.
CSL maintained its full-year dividend at US$2.92 per share and completed a A$1 billion buyback. The real catalyst was FY27 guidance for approximately 5% underlying profit growth, compared with market expectations closer to 2%. After an extended period of earnings disappointments, investors interpreted the outlook as evidence that CSL’s core plasma business was approaching a sustainable recovery.
4. Judo Capital (ASX:JDO): +16.9%
Judo Capital demonstrated strong operating leverage as its specialist business-lending franchise expanded. Full-year profit before tax rose 34% to $168.1 million, while pre-provision profit increased 42%. Gross loans and advances grew 18% to $14.7 billion, reaching the top of the bank’s guidance range and comfortably exceeding broader system growth.
Deposits increased 24% to $12.2 billion, return on equity improved by 1.1 percentage points to 6.4%, and earnings per share rose 29% to 9.9 cents. Reaffirmation of the FY27 outlook gave investors confidence that loan growth could continue without sacrificing margins or credit quality.
5. Super Retail Group (ASX:SUL): +15.8%
The owner of Supercheap Auto, rebel, BCF and Macpac reported record sales of $4.2 billion, up 3.2%, despite cautious discretionary spending. Profitability went backwards: normalised profit before tax fell 7% to $306 million and normalised NPAT declined 2.8% to $226 million as transformation spending weighed on margins. Nevertheless, the result exceeded subdued expectations, online sales grew 5.3% and membership across the group’s loyalty programs reached 13.1 million. Investors were also encouraged by positive early FY27 trading, stable gross margins and continued market-share gains. A fully franked 33-cent final dividend added to the appeal.
The five losers
1. Hansen Technologies (ASX:HSN): –21.2%
Hansen’s historic result met expectations, but investors recoiled from its outlook. The utility and communications software provider achieved an underlying EBITDA margin of 31%, exceeding its 30% target, while generating strong cash flow. However, management designated FY27 an “investment and transition year”, signalling a roughly five-percentage-point margin contraction as spending on products, sales capabilities and organisational changes increased.
Revenue had already been broadly flat, leaving investors concerned that the investment program would depress earnings before new growth appeared. Leadership changes, including the chief executive’s departure, added uncertainty. Management expects revenue growth and margins above 30% to return in FY28, but the market was unwilling to wait.
2. Life360 (ASX:360): –19.4%
Life360’s headline growth was impressive: quarterly revenue rose 38% to US$159 million, subscription revenue increased 31%, and adjusted EBITDA climbed 53% to US$31.1 million. Monthly active users reached 102.4 million and paying circles grew 27% to 3.2 million. The sell-off reflected expectations rather than a collapsing business.
Net income fell 18%, the net margin contracted from 6% to 3%, hardware shipments dropped 18%, and full-year EBITDA guidance was merely maintained. After a strong valuation run, investors wanted a larger upgrade and clearer evidence that heavy investment in advertising, international expansion and artificial intelligence would generate additional earnings.
3. PEXA Group (ASX:PXA): –17.0%
PEXA reported a 7% increase in continuing-operations revenue and 12% EBITDA growth to $152 million, accompanied by a two-percentage-point margin expansion. Free cash flow increased 39%, suggesting the core Australian electronic-conveyancing platform remained highly profitable. Investors instead concentrated on management’s warning that property-transfer volumes could decline, alongside regulatory uncertainty surrounding the fees PEXA can charge.
The company is also continuing to invest heavily in its loss-making international expansion. Morningstar considered the market reaction excessive, arguing that structural transfer-volume assumptions had not materially changed, but the combination of softer near-term activity and regulatory risk overwhelmed the respectable headline numbers.
4. SEEK (ASX:SEK): –14.3%
SEEK produced solid FY26 figures, including 10% revenue growth to $1.20 billion, a 15% rise in EBITDA and 28% growth in adjusted earnings per share. It also lifted its fully franked annual dividend by 13% to a record 52 cents. Those achievements were overshadowed by falling paid job-ad volumes and cautious FY27 assumptions.
The statutory accounts included a $201 million loss from the SEEK Growth Fund and $377 million of significant items, making the headline result considerably less attractive. Investors were particularly concerned that economic weakness could limit volumes while the company continued investing in platform integration and artificial-intelligence products.
5. JB Hi-Fi (ASX:JBH): –12.3%
JB Hi-Fi’s full-year result was broadly respectable, with group sales rising 5% to $11.1 billion and underlying earnings per share increasing 6% to $4.48. The damage came from its current-trading update. Australian sales were almost flat during the June quarter and deteriorated further in July, while earnings in the core Australian electronics business fell 3.6%.
Housing-related categories were particularly weak as higher living costs and interest rates constrained household budgets. With JB Hi-Fi entering the season on a demanding valuation, an in-line historic result was not sufficient: the loss of sales momentum prompted investors to rapidly reduce their expectations for FY27.
Overall, the season showed that share prices react less to whether profits rose or fell than to the gap between results and expectations. Bapcor was rewarded for being less troubled than feared, while several fundamentally profitable companies were punished because their outlooks failed to justify elevated valuations.

From making unpopular decisions to learning when to listen, leaders from five businesses reveal what nobody prepared them for — and how running a company has challenged their expectations.

Technology and semiconductor shares fell sharply as investors questioned the debt financing the AI infrastructure boom and confronted higher rates and Chinese competition.
Technology and semiconductor shares fell sharply as investors questioned the debt financing the AI infrastructure boom and confronted higher rates and Chinese competition.
4 minA sharp technology sell-off has exposed a new anxiety on global markets: whether the enormous borrowing behind the artificial-intelligence infrastructure boom can generate sufficient returns as interest rates rise and Chinese competition intensifies.
The artificial-intelligence investment boom has powered technology shares, semiconductor manufacturers and data-centre operators to extraordinary heights. Last week, investors were given a reminder that much of this expansion is being built with borrowed money.
The technology-heavy Nasdaq Composite fell 4.5 per cent over the week ended October 16, its weakest performance since late June. Semiconductor shares suffered an even deeper correction, with the Philadelphia Semiconductor Index losing about 11.4 per cent.
The selling spread quickly through global markets. Micron Technology fell 14.6 per cent over the week, while South Korea’s Samsung Electronics and SK Hynix dropped approximately 18 per cent and 24 per cent respectively.
This was more than a routine bout of profit-taking. Investors were reassessing three interconnected risks: higher interest rates, the rapidly expanding debt burden attached to AI infrastructure and the prospect of stronger competition from Chinese memory-chip manufacturers.
The debt behind the AI build-out
Artificial intelligence requires a physical infrastructure network of enormous scale. Data centres must be built, advanced processors purchased, power supplies secured and cooling systems installed before customers begin generating meaningful revenue from them.
Technology companies are increasingly supplementing their own cash with corporate bonds, syndicated loans, equipment leases, private credit and project-level financing.
JPMorgan describes the emerging funding model as a combination of conventional corporate borrowing and project finance tied to individual data-centre assets. In Australia, the Reserve Bank estimates that syndicated loans accounted for approximately three-quarters of data-centre financing during 2025 and 2026 to date.
The numbers are becoming large enough to affect broader credit markets. The Federal Reserve Bank of Dallas has cited Wall Street estimates suggesting AI-related investment-grade bond issuance could approach US$300 billion in 2026 alone.
That borrowing is not automatically problematic. Debt can be an efficient way to finance long-lived infrastructure when future revenue is sufficiently predictable. The concern is that AI technology, customer demand and computing economics are changing much faster than the repayment schedules attached to the assets.
A data centre financed today may carry debt for years. Investors must therefore make assumptions about future utilisation rates, electricity prices, chip performance, customer concentration and the amount businesses will ultimately pay for AI computing.
When interest rates rise, those assumptions become less forgiving.
Inflation changes the calculation
September’s US inflation data intensified the pressure. Consumer prices increased 3.7 per cent over the year, ahead of market expectations and up from 3.4 per cent in August.
The hotter reading reduced confidence that interest rates would fall quickly and pushed bond yields higher. That matters particularly for companies whose valuations depend on profits expected well into the future, as well as highly leveraged infrastructure operators that may need to refinance.
CoreWeave has emerged as a closely watched test case. The specialist cloud-computing company has accumulated substantial debt and lease obligations to build AI capacity, while relying on a concentrated group of large technology customers.
Its shares fell sharply during the sell-off, while the cost of insuring its debt against default climbed. CoreWeave has argued that its contracted backlog more than covers its obligations and that financial markets do not always understand its business model. Nevertheless, its securities have become a proxy for investor confidence in debt-funded AI infrastructure.
Oracle, another major investor in AI computing capacity, fell 8.8 per cent in Friday trading, while CoreWeave dropped 15.5 per cent.
The question is shifting from how much AI infrastructure can be built to how profitably it can be operated.
China adds another source of pressure
Interest rates were not the only catalyst. Reports of advances by Chinese memory-chip producer ChangXin Memory Technologies raised concerns that lower-cost Chinese products could increase competition across the global semiconductor industry.
Memory chips are essential to AI systems, but the industry is historically cyclical. Periods of tight supply and high pricing can encourage rapid investment, eventually producing oversupply and falling margins.
The prospect of a well-funded Chinese competitor expanding its technological capabilities unsettled investors in Samsung, SK Hynix and Micron. It also demonstrated that AI-related demand does not insulate chipmakers from conventional competitive pressures.
That combination—slower rate cuts, more expensive financing and potentially cheaper supply—challenged the assumption that every company exposed to AI would enjoy continually expanding margins.
A reset rather than the end of the boom
The sell-off does not establish that the AI boom is ending. Demand for computing power remains strong, the largest technology companies continue to generate formidable cash flows and many infrastructure projects are backed by long-term customer contracts.
What has changed is the market’s willingness to overlook the price and financing structure of that growth.
The most resilient companies are likely to be those able to fund investment from operating cash flow, secure long-duration customers and demonstrate that new capacity will earn returns comfortably above its financing costs.
More speculative operators may face greater scrutiny, particularly where debt is expensive, customers are concentrated or expected revenue depends on demand that has not yet materialised.
For Australian investors, the lesson extends beyond US technology shares. Local data-centre operators, infrastructure funds, electricity suppliers and property groups are increasingly exposed to the same investment cycle.
Artificial intelligence may remain one of the defining growth themes of the decade. But last week’s correction showed that enthusiasm for the technology does not eliminate financial discipline.
The next stage of the AI boom will be judged not only by computing power, model performance or demand for chips, but by something more traditional: whether the assets being financed can generate enough cash to repay the money borrowed to build them.
Fact box
Nasdaq Composite: Down 4.5 per cent for the week ended October 16, 2026
Philadelphia Semiconductor Index: Down approximately 11.4 per cent
Micron Technology: Down approximately 14.6 per cent
Samsung Electronics: Down approximately 18 per cent
SK Hynix: Down approximately 24 per cent
US September inflation: 3.7 per cent annually
Estimated 2026 AI-related investment-grade issuance: Approximately US$300 billion

Two coming 2027 models – the first of the “Neue Klasse” cars coming to the U.S. early next year – have been revealed.
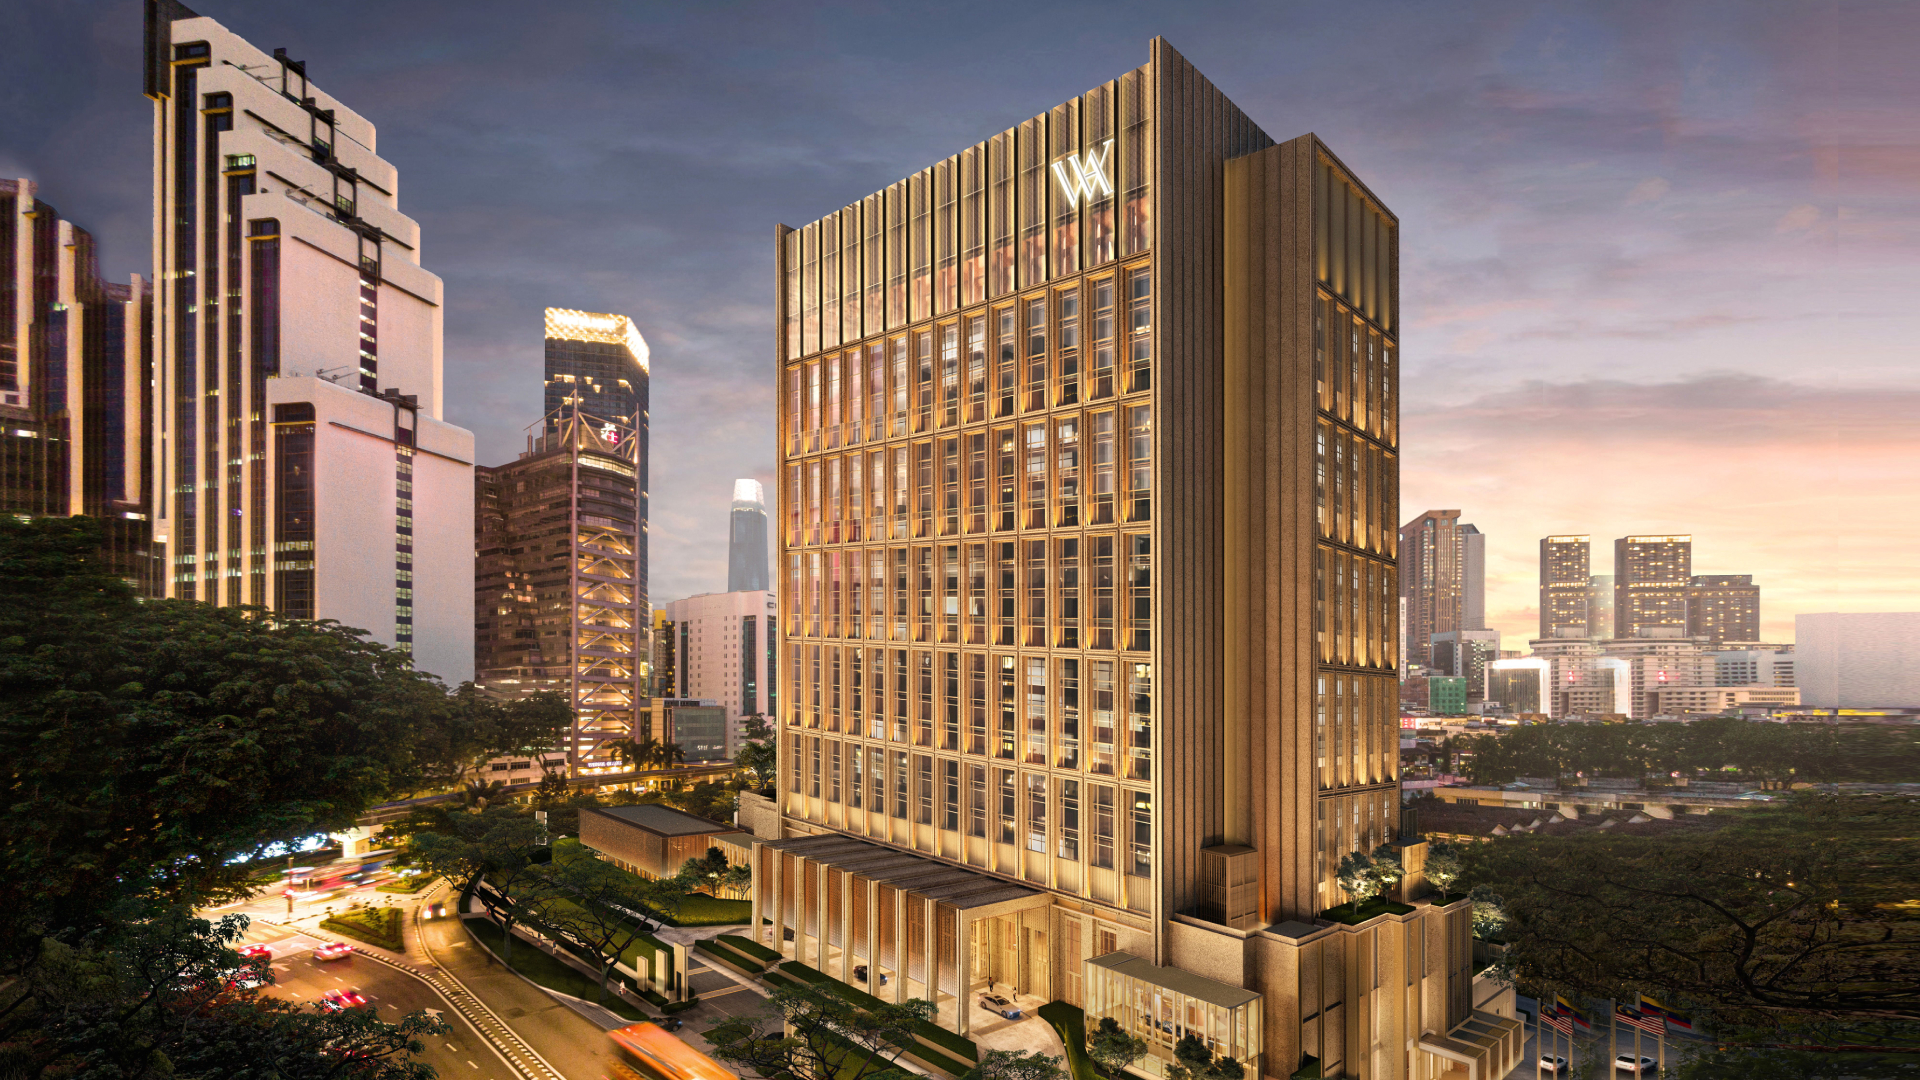
Waldorf Astoria Kuala Lumpur is scheduled to open on 30 October, introducing the Hilton luxury brand to Malaysia with an all-suite hotel in the city’s Golden Triangle.