Australians Intend to Spend $30 Billion This Christmas
Flights are the most expensive item in holiday budgets this silly season
 2 min
2 min
Despite the cost of living crisis, Australians intend to spend $30 billion this Christmas on presents and festivities, which is about 10% more than they did in 2022. This averages out to about $1,479 per person, up from $1,361 in 2022, according to Finder’s Consumer Sentiment Tracker survey conducted last month.
The survey asked people aged over 18 in Australia’s five biggest states how much they intended to spend across the key categories of presents, food, alcohol, eating out and travel this Christmas. Victorians have the biggest spending budgets of $1,765 per person, followed by those in New South Wales at $1,657. The lowest spending state will be Queensland at $1,067 per person. Among the generational age groups, millennials intend to spend the most this Christmas at $1,924 per person on average, and Gen Z plans to spend the least at $1,023 per person.
The biggest budget category is airfares with an estimated $533 average spend per person. Residents of New South Wales will spend the most at $710 per person, while those living in one of Australia’s most traditionally popular holiday destinations – Queensland – will spend the least at $316 per person. Gen Y Australians will be the biggest travel spenders this season by a large margin, spending $898 per person for flights compared to an average of $440 or less across all other generational age brackets.
Domestic airfares hit a historical high in December 2022. They have since fallen but remain above pre-pandemic levels. A report released by the Australian Competition and Consumer Commission (ACCC) in June found that prices were coming down due to lower jet fuel costs, an easing in post-COVID travel demand and “the rising cost of living becoming a greater concern for consumers”.
But on a long-term view, the ACCC says a lack of industry competition means airfares will remain relatively expensive in Australia. “Without a real threat of losing passengers to other airlines, the Qantas and Virgin Australia airline groups have had less incentive to offer attractive airfares, develop more direct routes, operate more reliable services, and invest in systems to provide high levels of customer service, ACCC Chair Gina Cass-Gottlieb said. “Rex’s expansion onto major intercity routes and Bonza’s launch have been positive developments for competition, but their share of the market is small and there are barriers to growth.”
After flights, the next most expensive Christmas category was presents, with Australians planning to spend an average of $373. Among the remaining categories, Australians will spend an average of $249 on food, $192 on alcohol and $133 on dining out. Baby boomers are planning the booziest Christmas with an average alcohol spend of $524 per person, which is vastly higher than all other age groups who intend to spend $110 or less.
Many Australians say they are trying to rein in their spending by planning their Christmas celebrations early. The survey found 26% of respondents planned to take advantage of Black Friday sales and 25% will buy food and presents early to help control their spending. Almost one in five Aussies say they will implement a gift-giving limit, while 8% plan to make gifts and 7% plan to re-gift unwanted presents. Some families are giving up on gifts altogether, with 6% saying they’ve agreed to a present-free Christmas this year.
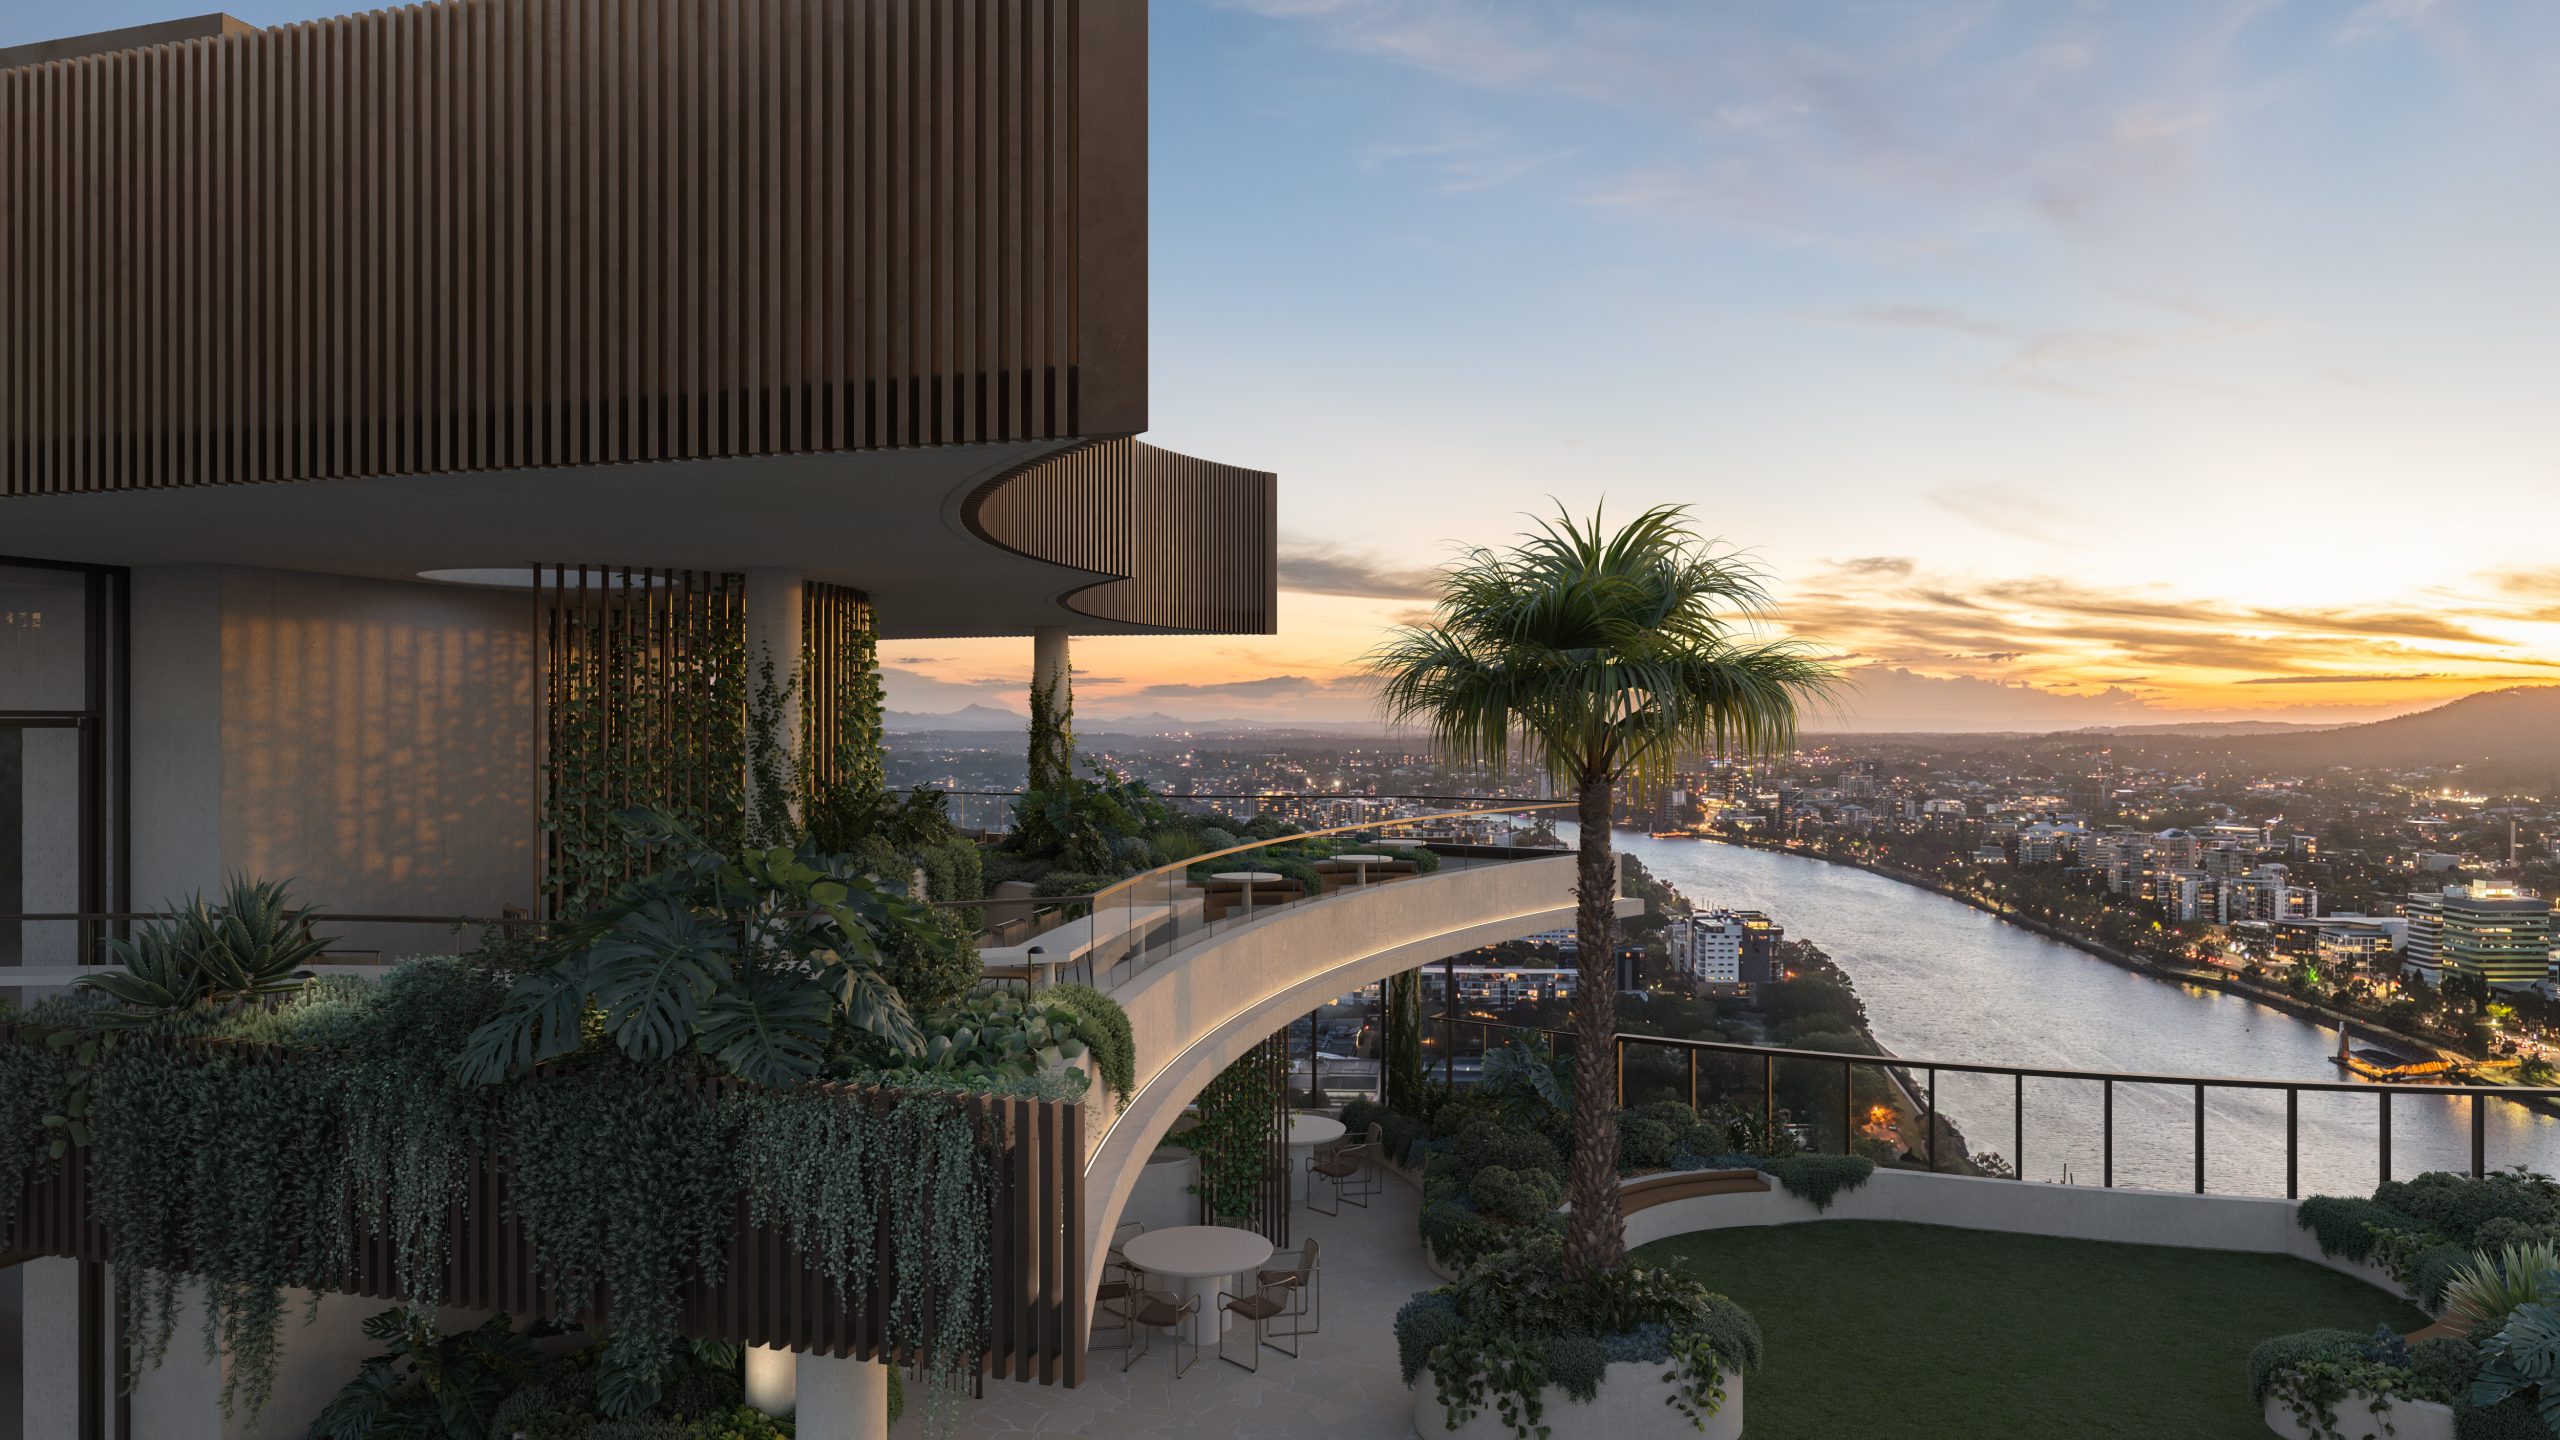
Set on one of the city’s last absolute riverfront sites, The Riversdale by Mosaic combines irreplaceable waterfront ownership with one of Brisbane’s most significant residential opportunities.
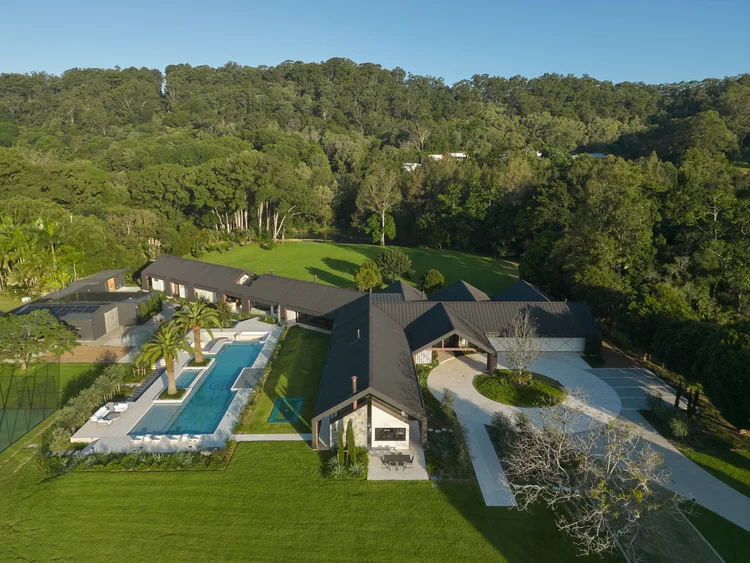
Margot Robbie may have travelled from a Queensland farm to the highest reaches of Hollywood, but a reported $28 million property deal suggests the Gold Coast has never lost its hold on her. The Australian actor and producer is believed to be the mystery buyer of Redwood, a seven-acre Currumbin Valley estate transformed into the …
Continue reading “Margot Robbie Reportedly Behind $28 Million Currumbin Valley Homecoming”


The federal budget has rattled property investors. But the biggest mistake isn’t the tax changes, it’s the conclusion many are drawing from them.
2 min
The recent budget has forced a reckoning for property investors.
Negative gearing now restricted to new residential builds, the CGT discount gone and on paper, the numbers look different.
And many investors are responding by pivoting toward yield, prioritising cash flow over capital growth in a way that property strategists say misses the point entirely.
“The debate has shifted to yield versus growth as if they are opposing forces,” says Abdullah Nouh, founder of Melbourne-based buyers’ agency Mecca Property Group. “But that framing is itself the mistake.”
Nouh, who works with high-net-worth families and investors on long-term acquisition strategy, argues that capital growth remains the primary driver of genuine wealth creation and that the post-budget environment has made quality assets more important, not less.
The numbers make his case plainly. An additional $500 per week in rental income is welcome. A prestige asset appreciating by $1 million over a market cycle is transformative.
These are not equivalent outcomes, and portfolios built around yield at the expense of location and land value tend to generate income while wealth stands largely still.
The more nuanced shift Nouh is seeing among sophisticated investors is a move toward assets where both outcomes can be engineered simultaneously – established homes on substantial land in quality locations, where the existing dwelling can be repositioned, rental returns improved, and the underlying land value compounds independent of what sits on it.
For investors with existing equity, commercial property is also entering the conversation in a more serious way.
Prestige industrial assets, medical centres and long-leased essential retail offer income profiles that residential property in most capital city markets cannot currently match: longer lease terms, tenants covering outgoings, and greater predictability than the residential tenancy cycle.
“The investors who build lasting wealth are rarely the ones who chased yield or growth exclusively,” says Nouh.
“They are the ones who built a strategy they could sustain – one that generated enough income to hold quality assets through multiple cycles while those assets compounded in value.”
The budget has changed the settings. It has not changed the fundamentals.

MAISON de SABRÉ’s new Spring Harvest Collection turns everyday produce into collectible leather charms and introduces fresh silhouettes in its cult Bucket bag family.

A 30-metre masterpiece unveiled in Monaco brings Lamborghini’s supercar drama to the high seas, powered by 7,600 horsepower and unmistakable Italian design.