


Best Stock-Fund Managers of 2022
In a brutal year for investing, a handful of stock pickers managed to post positive returns. The winner was up nearly 32%.

 6 min
6 min
Well at least it wasn’t as dreadful as the Great Depression. Or even the financial crisis of 2008.
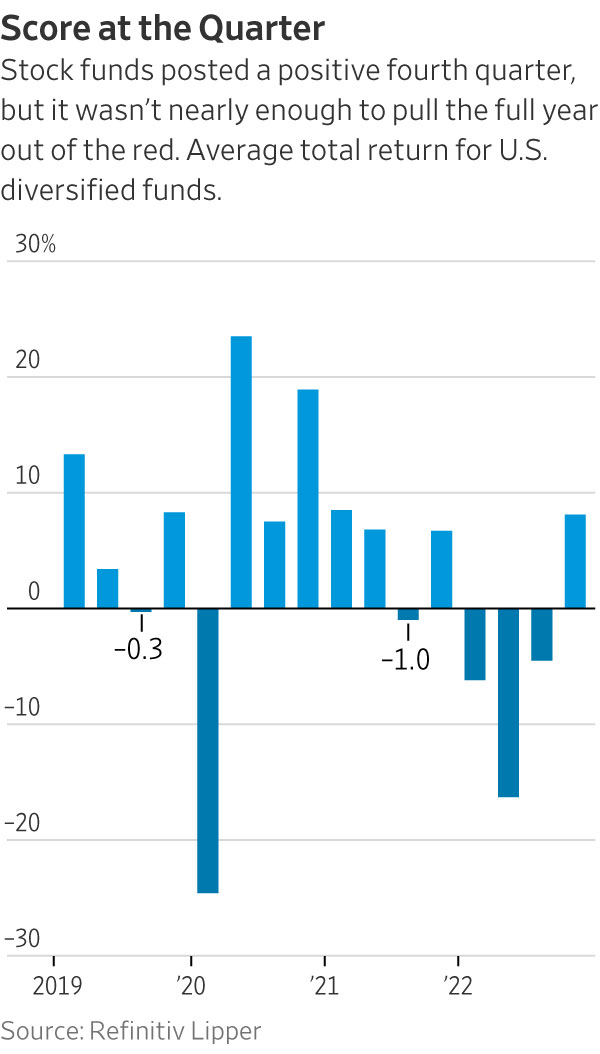
But for any mutual-fund manager trying to cope with the sea of red ink that flooded financial markets in 2022, that’s meagre consolation. In a year when soaring interest rates and sky-high inflation left the S&P 500 index with a 19% loss and triggered an even worse year for the bond market, an estimated $8.2 trillion of stock-market wealth in the U.S. simply evaporated.
Even most of those value- and income-focused mutual-fund managers who “outperformed” the broad index did so by confining their losses to the single digits—little comfort for investors.
Indeed, of the 1,410 actively managed mutual funds that met the criteria for inclusion in the Winners’ Circle, The Wall Street Journal’s quarterly survey of top-performing stock managers on a 12-month basis, a mere 40 wrapped up 2022 in positive territory. The average loss for the whole group, according to data provided by Morningstar Direct, was 18.2%.
To outperform in 2022 required a fund’s manager to have taken outsize positions in the energy sector—the only one of the 10 industries that make up the S&P 500 to record a gain in 2022. In fact, the magnitude of the rally in energy resulted in the sector coming within a whisker of doubling in its weight within that large-cap market index, hitting 5.23%.
And energy bets were what powered three Kinetics funds to top positions in the Winners’ Circle—not only the winning fund, but the runner-up and the No. 4 finisher.
“It seems as if we’re always a contrarian, but recently that has been working for us,” says James Davolos, a portfolio manager at Horizon Kinetics LLC, who serves on the investment committee for the three Kinetics funds. Between 30% and 60% of the assets of No. 1 fund Kinetics Small Cap Opportunities Fund (KSCOX), runner-up Kinetics Paradigm Fund (WWNPX) and No. 4 finisher Kinetics Market Opportunities Fund (KMKNX) were invested in energy-related holdings over the course of 2022, he says.
Kinetics Small Cap took home the crown with its 31.9% gain. The Paradigm fund gained 29.2%, and Market Opportunities gained nearly 15%.
Contest requirements
To qualify for inclusion in this Winners’ Circle survey, funds must be actively managed U.S.-stock funds with more than $50 million in assets and a record of three years or more, as well as meet a handful of other criteria. The survey excludes index and sector funds, funds that employ leverage strategies and most quantitative funds. The results are calculated by Morningstar Direct.
Important to note: These are stock funds that outperformed in specific market environments, and may have elements that make them unsuitable for some investors, ranging from their fee structure to their longer-term performance or volatility.
Mr. Davolos says he has no plans to abandon his highly concentrated and contrarian investment approach with the dawn of a new calendar year.
“The world isn’t going to quickly revert back to the way it was in 2018 or 2019,” he says. “We think we’re in the early stages of a transition to a five- or seven-year transition period. We were positioned for that in areas like energy and other hard assets that we thought would be more resilient. And we believe that most businesses will continue to face a difficult operating environment and a compression in their profit margins.”
That’s why Mr. Davolos and his team have designed the Kinetics portfolios to have hefty overweight positions in companies and industries that he believes will be able to demonstrate more-resilient profit margins. Energy royalty companies—and especially Texas Pacific Land Corp., which represented anywhere from 50.9% of assets in the Market Opportunities Fund to as much as 64.8% of the Paradigm fund’s holdings—will remain a focus, he says. Texas Pacific is one of the biggest landowners in Texas and funnels oil-and-gas royalties that it earns from those drilling on its land directly to investors.
But Mr. Davolos is also looking for opportunities to invest in other areas he believes will be equally robust in face of economic headwinds, whose stocks don’t reflect that potential.
One sector that he finds of particular interest is precious metals, and once again, he’s emphasising royalty income as a way to profit from what he sees as strong fundamentals for the sector with lower risk.
“Gold, in particular, is likely to do well in a period of draconian risk aversion and higher or rising interest rates, as people look for a store of value,” says Mr. Davolos. He also expects precious metals to respond positively to any geopolitical shocks or uncertainty, just as energy did in 2022. But he prefers to avoid exploration and production companies and the cyclicality and risk inherent in the profit cycle of these businesses, and instead looks to companies like Franco-Nevada Corp., another royalty play. “Streams of royalty income are more predictable and rewarding,” he insists.
While none of the top-performing Kinetics funds could be described as being diversified, Mr. Davolos also is keeping an eye open for opportunities to add other inflation-resistant, value-priced securities to these portfolios. For instance, noting that “government contracts are likely to be immune to inflation,” he has established and built on positions in CACI International Inc., a defence contractor that emphasises communications, cybersecurity and other technology services. He also likes Brookfield Asset Management as a way to indirectly profit from government spending on infrastructure, and has hung on to holdings in financial exchanges like CME Group Inc. and Intercontinental Exchange Inc. “Any company that provides an intermediary service—connecting two counterparties that are trying to manage their own risks—will remain critical” to the economy, he argues.
A faithful finish
Unsurprisingly, other top-performing managers in the 2022 year-end Winners’ Circle also beat the odds and triumphed by bucking conventional wisdom.
The year’s third-place finisher is one of the smallest funds in the survey. Schwartz Value Focused Fund (RCMFX) may have only $51.7 million in assets, but it turned in an impressive return for its investors, wrapping up the year with a 21.2% gain. And the fund is managed by Schwartz Investment Counsel in Plymouth, Mich., which oversees a universe of other portfolios, including Ave Maria Value Fund (AVEMX), the Catholic-values fund that ended the year with a 4.2% advance, putting it in 11th place in our survey.
Both funds are overseen by a team headed by George Schwartz, the founder, chairman and CEO of Schwartz Investment Counsel. He and son Tim, the firm’s chief investment officer, began adding energy stocks to Schwartz Value a few years ago, just as the pressure on pension funds and other mutual funds to divest their fossil-fuel holdings began to take effect.
“Our focus is on buying out-of-favour stocks when they are cheap, and when we believe they have a great recovery potential,” the elder Mr. Schwartz says. “When the energy sector had gotten so depressed it was ridiculous, we bought those stocks aggressively.” By the end of 2022, 41% of Schwartz Value’s assets were invested in an array of energy companies. “That decision has been a big boon for us,” he says.
Like Mr. Davolos, Mr. Schwartz is a fan of Texas Pacific Land, by far the fund’s single largest holding at 27.6% of fund assets. But he adopts a more, ahem, catholic (as in “all encompassing”) approach to energy investing, allocating capital to major global integrated producers and refiners like Chevron Corp., exploration-and-production companies such as Devon Energy Corp. and service companies like Schlumberger NV.
A Yeti fan
And he, too, is casting a (slightly) wider net. While hanging on to precious metals investments (Franco-Nevada and producer Barrick Gold) and what he sees as core value holdings in Berkshire Hathaway, last year Mr. Schwartz added new positions in an array of specialty manufacturing companies like A.O. Smith Corp. (water treatment and heating) and Yeti Holdings Inc. (drink coolers, drinkware and related gear). One of his largest new holdings is in RH, formerly known as Restoration Hardware, the specialty retailer of luxury furniture. “We like companies that are out of the mainstream,” he says, adding that RH shares now change hands for 15% more than the average price Schwartz Counsel paid to establish its position starting in September 2022.
Scott Barbee, manager of the No. 5 fund in the Winners’ Circle, Aegis Value Fund (AVALX), echoes his fellow outperformers in crediting the energy sector with his portfolio’s 2022 return of 10.5%.
“Back in the early stages of the pandemic, when investors were flocking to the big-name technology stocks, energy stood out like a sore thumb,” he says. Selling pressure from sustainable-investing funds and others trying to avoid fossil fuels “frightened everyone away from the sector.” But Mr. Barbee, who seeks out cyclically depressed businesses that he believes are poised for a rebound, opted to invest in the sector beginning in early 2021. “They were trading cheaply, they had long-lived asset bases, and their balance sheets are in amazing condition,” he says. The latter consideration became particularly important as interest rates began to soar last year; companies with lower debt levels remain insulated from this source of pressure.
By the end of 2022, Aegis Value had 37% of its assets invested in the fossil-fuels area, in holdings ranging from coal producer Hallador Energy Co., to International Petroleum Corp. and Akita Drilling Ltd.
“The tailwinds for this sector are likely to be with us for some time,” Mr. Barbee says. But he’s taking some of his energy holdings off the table, and redeploying that capital into other sectors. He added to the fund’s exposure to the metals mining industry (its largest position has been copper giant Amerigo Resources Ltd.) and boosted its stake in precious metals by investing in Centerra Gold Inc.—adding to a list of gold producers that already included Orezone Gold Corp. and Equinox Gold Corp. “This is another neglected corner of the market, and we believe our holdings will do well at current gold prices and phenomenally if gold goes higher” in response to inflation and interest-rate trends, he says.
None of the top-performing managers of 2022 voiced much optimism about the likelihood of seeing a broad market recovery in 2023.
“How much will be needed to bring inflation under control?” says Mr. Barbee, referring to the prospect of further interest-rate increases. “That’s why we emphasise companies with strong balance sheets, since they’re more likely to get through whatever we’ve got coming.”
 Copyright 2020, Dow Jones & Company, Inc. All Rights Reserved Worldwide. LEARN MORE


A record-breaking $11 million sale at The Centennial Collection has set a new benchmark for luxury apartment living in Bondi Junction.

As interest rates, inflation and market sentiment fluctuate, investors are being urged to focus on data, not panic.


The Federal Budget may have softened some of its proposed tax reforms, but it has exposed a bigger issue: too many families are relying on wealth structures that no longer reflect the realities of modern life.
3 min
For many Australians, the 2026 Federal Budget initially felt like a direct challenge to the way wealth is created, held and transferred between generations.
The headlines were immediate: changes to capital gains tax, reforms to discretionary trusts, restrictions on negative gearing and increased scrutiny of investment structures. Unsurprisingly, affluent families, business owners and investors began asking the same question:
Is the way we hold our wealth still fit for purpose?
In recent days, the government has announced several significant amendments following industry consultation and public feedback, including exempting testamentary trusts from the proposed 30 per cent minimum tax and expanding capital gains tax concessions for small businesses.
The backdown is welcome. But it also highlights something much bigger.
This Budget has accelerated a conversation that many Australian families have been postponing for years.
The conversation is not really about tax. It is about wealth stewardship.
For decades, Australians have built wealth through businesses, property, investments and careful long-term planning. Yet many families have not revisited the legal structures surrounding those assets in years, sometimes decades.
We often see clients who have spent years building significant wealth, only to discover their legal arrangements no longer reflect their current circumstances.
Their children are now adults. They may own multiple properties.
They may have sold a business, entered a second marriage, become grandparents or accumulated digital assets that did not exist when their original estate plans were prepared.
The trust that distributes income may need to be reconsidered. The bucket company may no longer be so attractive.
The Budget has simply exposed a reality that already existed: wealth structures cannot remain static while life continues to evolve.
Importantly, trusts themselves are not the issue.
Trusts are legitimate planning tools that provide flexibility, protection and continuity. When used appropriately, they allow families to adapt to changing circumstances over time.
And neither is tax the issue, really. Getting the fundamentals right is more important for long-term, sustainable wealth than a few favourable tax treatments around the edges.

The real issue is complacency.
Too often, families create structures and assume the job is done. It isn’t.
Estate planning is no longer a document you sign once and file away in a drawer. It is an ongoing process that should evolve alongside your life.
We are also seeing a broader shift in how Australians define wealth itself. It is no longer just the family home and an investment portfolio.
Modern wealth includes businesses, digital assets, cryptocurrency, intellectual property, frequent flyer points and increasingly complex family arrangements.
At the same time, Australians are living longer than ever before, meaning wealth may need to support multiple generations simultaneously. This creates new responsibilities and new risks.
How do you help your children enter the property market without exposing family wealth to relationship breakdowns?
How do you structure wealth so that it remains a source of opportunity rather than future conflict?
These are the questions families should be asking now.
The recent debate surrounding testamentary trusts also serves as an important reminder that policy decisions can have unintended consequences for vulnerable Australians. It is encouraging that the government has listened to feedback and clarified its position.
But the lesson remains: the wealth landscape is changing.
Increasingly, governments, regulators and tax authorities are paying closer attention to how wealth is held and transferred. That means families cannot afford to adopt a “set-and-forget” approach to their structures.
The families who will be best placed for the future are not necessarily those with the greatest wealth.
They are the families with the greatest clarity. Clarity around ownership, succession and governance. And clarity around how wealth will transition from one generation to the next.
Ultimately, preserving wealth is not about avoiding change.
It is about preparing for it.
Because the greatest risk is not change itself.
It is losing the ability to respond to it.
Anthony Hunt is Co-Founder of Wealth Lawyers and former COO of Westpac Private Bank. He advises business owners, investors and affluent Australian families on wealth protection, succession planning and intergenerational wealth transfer

Rugged coastal drives and fireside drams define a slow, indulgent journey through Scotland’s far north.

Hand-built in Melbourne and limited to just 10 cars a year, the Zeigler/Bailey Z/B 4.4 is reshaping what a modern collector car can be.

