China’s EV Juggernaut Is a Warning for the West
Competitive pressure and creativity have made Chinese-designed and -built electric cars formidable competitors
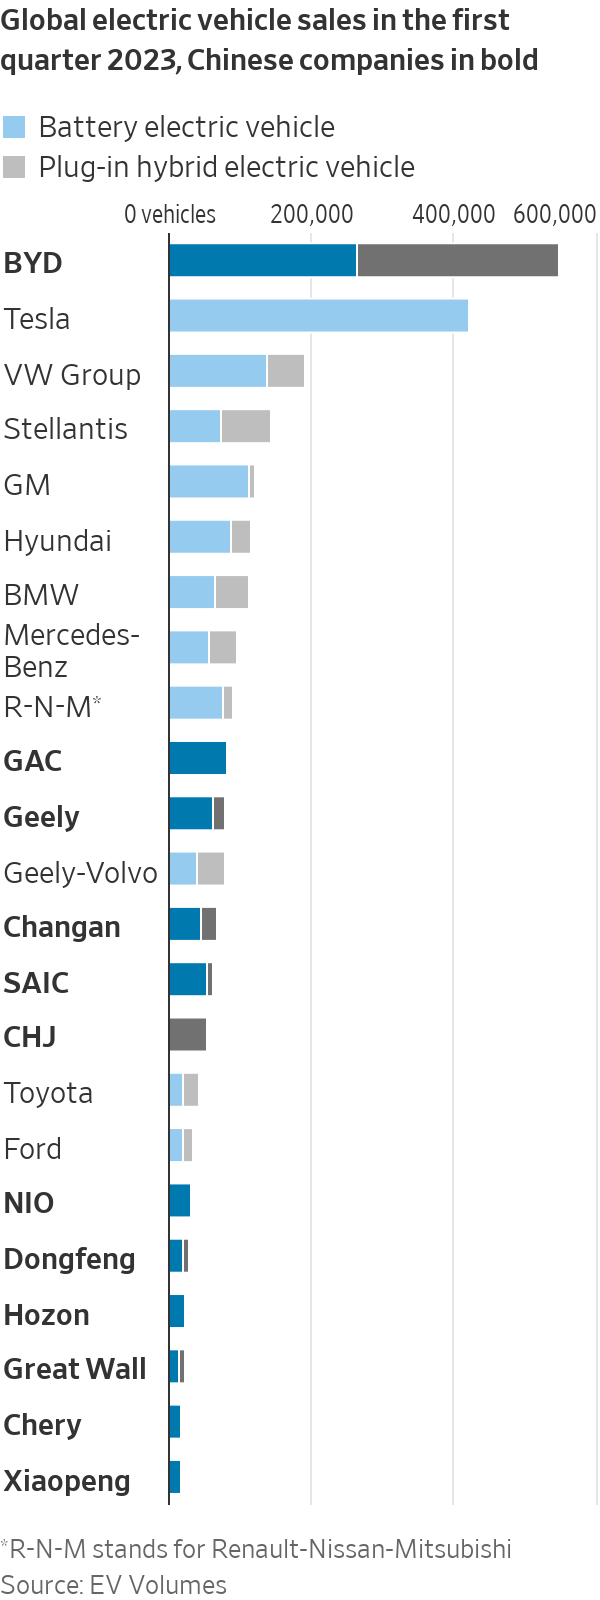
China rocked the auto world twice this year. First, its electric vehicles stunned Western rivals at the Shanghai auto show with their quality, features and price. Then came reports that in the first quarter of 2023 it dethroned Japan as the world’s largest auto exporter.
How is China in contention to lead the world’s most lucrative and prestigious consumer goods market, one long dominated by American, European, Japanese and South Korean nameplates? The answer is a unique combination of industrial policy, protectionism and homegrown competitive dynamism. Western policy makers and business leaders are better prepared for the first two than the third.
Start with industrial policy—the use of government resources to help favoured sectors. China has practiced industrial policy for decades. While it’s finding increased favour even in the U.S., the concept remains controversial. Governments have a poor record of identifying winning technologies and often end up subsidising inferior and wasteful capacity, including in China.
But in the case of EVs, Chinese industrial policy had a couple of things going for it. First, governments around the world saw climate change as an enduring threat that would require decade-long interventions to transition away from fossil fuels. China bet correctly that in transportation, the transition would favour electric vehicles.
In 2009, China started handing out generous subsidies to buyers of EVs. Public procurement of taxis and buses was targeted to electric vehicles, rechargers were subsidised, and provincial governments stumped up capital for lithium mining and refining for EV batteries. In 2020 NIO, at the time an aspiring challenger to Tesla, avoided bankruptcy thanks to a government-led bailout.
While industrial policy guaranteed a demand for EVs, protectionism ensured those EVs would be made in China, by Chinese companies. To qualify for subsidies, cars had to be domestically made, although foreign brands did qualify. They also had to have batteries made by Chinese companies, giving Chinese national champions like Contemporary Amperex Technology and BYD an advantage over then-market leaders from Japan and South Korea.
To sell in China, foreign automakers had to abide by conditions intended to upgrade the local industry’s skills. State-owned Guangzhou Automobile Group developed the manufacturing know-how necessary to become a player in EVs thanks to joint ventures with Toyota and Honda, said Gregor Sebastian, an analyst at Germany’s Mercator Institute for China Studies.
Despite all that government support, sales of EVs remained weak until 2019, when China let Tesla open a wholly owned factory in Shanghai. “It took this catalyst…to boost interest and increase the level of competitiveness of the local Chinese makers,” said Tu Le, managing director of Sino Auto Insights, a research service specialising in the Chinese auto industry.

Back in 2011 Pony Ma, the founder of Tencent, explained what set Chinese capitalism apart from its American counterpart. “In America, when you bring an idea to market you usually have several months before competition pops up, allowing you to capture significant market share,” he said, according to Fast Company, a technology magazine. “In China, you can have hundreds of competitors within the first hours of going live. Ideas are not important in China—execution is.”
Thanks to that competition and focus on execution, the EV industry went from a niche industrial-policy project to a sprawling ecosystem of predominantly private companies. Much of this happened below the Western radar while China was cut off from the world because of Covid-19 restrictions.
When Western auto executives flew in for April’s Shanghai auto show, “they saw a sea of green plates, a sea of Chinese brands,” said Le, referring to the green license plates assigned to clean-energy vehicles in China. “They hear the sounds of the door closing, sit inside and look at the quality of the materials, the fabric or the plastic on the console, that’s the other holy s— moment—they’ve caught up to us.”
Manufacturers of gasoline cars are product-oriented, whereas EV manufacturers, like tech companies, are user-oriented, Le said. Chinese EVs feature at least two, often three, display screens, one suitable for watching movies from the back seat, multiple lidars (laser-based sensors) for driver assistance, and even a microphone for karaoke (quickly copied by Tesla). Meanwhile, Chinese suppliers such as CATL have gone from laggard to leader.
Chinese dominance of EVs isn’t preordained. The low barriers to entry exploited by Chinese brands also open the door to future non-Chinese competitors. Nor does China’s success in EVs necessarily translate to other sectors where industrial policy matters less and creativity, privacy and deeply woven technological capability—such as software, cloud computing and semiconductors—matter more.
Still, the threat to Western auto market share posed by Chinese EVs is one for which Western policy makers have no obvious answer. “You can shut off your own market and to a certain extent that will shield production for your domestic needs,” said Sebastian. “The question really is, what are you going to do for the global south, countries that are still very happily trading with China?”
Western companies themselves are likely to respond by deepening their presence in China—not to sell cars, but for proximity to the most sophisticated customers and suppliers. Jörg Wuttke, the past president of the European Union Chamber of Commerce in China, calls China a “fitness centre.” Even as conditions there become steadily more difficult, Western multinationals “have to be there. It keeps you fit.”
 Copyright 2020, Dow Jones & Company, Inc. All Rights Reserved Worldwide. LEARN MORE
This stylish family home combines a classic palette and finishes with a flexible floorplan
Just 55 minutes from Sydney, make this your creative getaway located in the majestic Hawkesbury region.
Continued stagflation and cost of living pressures are causing couples to think twice about starting a family, new data has revealed, with long term impacts expected
Australia is in the midst of a ‘baby recession’ with preliminary estimates showing the number of births in 2023 fell by more than four percent to the lowest level since 2006, according to KPMG. The consultancy firm says this reflects the impact of cost-of-living pressures on the feasibility of younger Australians starting a family.
KPMG estimates that 289,100 babies were born in 2023. This compares to 300,684 babies in 2022 and 309,996 in 2021, according to the Australian Bureau of Statistics (ABS). KPMG urban economist Terry Rawnsley said weak economic growth often leads to a reduced number of births. In 2023, ABS data shows gross domestic product (GDP) fell to 1.5 percent. Despite the population growing by 2.5 percent in 2023, GDP on a per capita basis went into negative territory, down one percent over the 12 months.
“Birth rates provide insight into long-term population growth as well as the current confidence of Australian families,” said Mr Rawnsley. “We haven’t seen such a sharp drop in births in Australia since the period of economic stagflation in the 1970s, which coincided with the initial widespread adoption of the contraceptive pill.”
Mr Rawnsley said many Australian couples delayed starting a family while the pandemic played out in 2020. The number of births fell from 305,832 in 2019 to 294,369 in 2020. Then in 2021, strong employment and vast amounts of stimulus money, along with high household savings due to lockdowns, gave couples better financial means to have a baby. This led to a rebound in births.
However, the re-opening of the global economy in 2022 led to soaring inflation. By the start of 2023, the Australian consumer price index (CPI) had risen to its highest level since 1990 at 7.8 percent per annum. By that stage, the Reserve Bank had already commenced an aggressive rate-hiking strategy to fight inflation and had raised the cash rate every month between May and December 2022.
Five more rate hikes during 2023 put further pressure on couples with mortgages and put the brakes on family formation. “This combination of the pandemic and rapid economic changes explains the spike and subsequent sharp decline in birth rates we have observed over the past four years,” Mr Rawnsley said.
The impact of high costs of living on couples’ decision to have a baby is highlighted in births data for the capital cities. KPMG estimates there were 60,860 births in Sydney in 2023, down 8.6 percent from 2019. There were 56,270 births in Melbourne, down 7.3 percent. In Perth, there were 25,020 births, down 6 percent, while in Brisbane there were 30,250 births, down 4.3 percent. Canberra was the only capital city where there was no fall in the number of births in 2023 compared to 2019.
“CPI growth in Canberra has been slightly subdued compared to that in other major cities, and the economic outlook has remained strong,” Mr Rawnsley said. “This means families have not been hurting as much as those in other capital cities, and in turn, we’ve seen a stabilisation of births in the ACT.”
This stylish family home combines a classic palette and finishes with a flexible floorplan
Just 55 minutes from Sydney, make this your creative getaway located in the majestic Hawkesbury region.


