Companies Say Push to Decarbonise Comes From Their Own Boards
Call to cut corporate carbon footprints is loudest from inside organizations, outweighing demand from customers and regulators, survey finds

 2 min
2 min
The pressure on companies to cut their carbon footprint is coming more from within the organisations themselves than from customers and regulators, according to a new report.
Three-quarters of business leaders from across the Group of 20 nations said the push to invest in renewable energy is being driven mainly by their own corporate boards, with 77% of U.S. business leaders saying the pressure was extreme or significant, according to a new survey conducted by law firm Ashurst.
The corporate call to decarbonise is intensifying, Ashurst said, with 30% of business leaders saying the pressure from their own boards was extreme, up from 25% in 2022.
“We’re seeing that the energy transition is an area that is firmly embedded in the thinking of investors, corporates, governments and others, so there is a real emphasis on setting and acting on these plans now,” said Michael Burns, global co-head of energy at Ashurst. “That said, the pace of transition and the stage of the journey very much depends from business to business.”
The shift in sentiment comes as companies ramp up investment in renewable spending to meet their net-zero goals. Ashurst found that 71% of the more than 2,000 respondents to its survey had committed to a net-zero target, while 26% of respondents said their targets were under development.
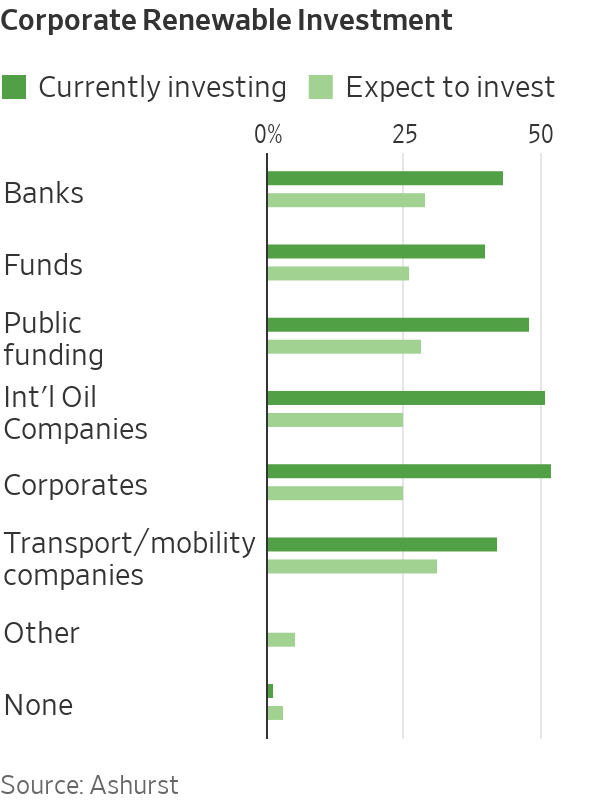
Ashurst also found that solar was the most popular method to decarbonise, with 72% of respondents currently investing in or committed to investing in the clean energy technology. The law firm also found that companies tended to be the most active when it comes to renewable investments, with 52% of the respondents falling into this category. The average turnover of those companies was $15.1 billion.
Meanwhile, 81% of energy-sector respondents to the survey said they see investment in renewables as essential to the organisation’s strategic growth.
Burns said the 2030 timeline to reach net zero was very important to the companies it surveyed. “We are increasingly seeing corporate and other stakeholders actively setting and embracing trajectories to achieve net zero. However, greater clarity and transparency on the standards for measuring and managing these net-zero commitments is needed to ensure consistency in approach and, importantly, outcome,” he said.
Legal battles over climate change and renewable investing are also likely to rise, with 68% of respondents saying they expect to see an increase in legal disputes over the next five years, while only 16% anticipate a decrease, the report said.
 Copyright 2020, Dow Jones & Company, Inc. All Rights Reserved Worldwide. LEARN MORE


From elevated skincare to handcrafted home pieces, this year’s most thoughtful gifts go beyond the expected.

A haven for hedge-fund titans and Hollywood grandees, Greenwich is one of the world’s most expensive residential enclaves, where eye-watering prices meet unapologetic grandeur.


The lunar flyby would be the deepest humans have traveled in space in decades.
4 min
It’s go time for the highest-stakes mission at NASA in more than 50 years.
On April 1, the agency is set to launch four astronauts around the moon, the deepest human spaceflight since the final Apollo lunar landing in 1972.
The launch window for Artemis II , as the mission is called, opens at 6:24 p.m. ET.
National Aeronautics and Space Administration teams have been preparing the vehicles to depart from Florida’s Kennedy Space Center on the planned roughly 10-day trip. Crew members have trained for years for this moment.
Reid Wiseman, the NASA astronaut serving as mission commander, said he doesn’t fear taking the voyage. A widower, he does worry at times about what he is putting his daughters through.
“I could have a very comfortable life for them,” Wiseman said in an interview last September.
“But I’m also a human, and I see the spirit in their eyes that is burning in my soul too. And so we’ve just got to never stop going.”
Wiseman’s crewmates on Artemis II are NASA’s Victor Glover and Christina Koch, as well as Canadian Space Agency astronaut Jeremy Hansen.

What are the goals for Artemis II?
The biggest one: Safely fly the crew on vehicles that have never carried astronauts before.
The towering Space Launch System rocket has the job of lofting a vehicle called Orion into space and on its way to the moon.
Orion is designed to carry the crew around the moon and back. Myriad systems on the ship—life support, communications, navigation—will be tested with the astronauts on board.
SLS and Orion don’t have much flight experience. The vehicles last flew in 2022, when the agency completed its uncrewed Artemis I mission .
How is the mission expected to unfold?
Artemis II will begin when SLS takes off from a launchpad in Florida with Orion stacked on top of it.
The so-called upper stage of SLS will later separate from the main part of the rocket with Orion attached, and use its engine to set up the latter vehicle for a push to the moon.
After Orion separates from the upper stage, it will conduct what is called a translunar injection—the engine firing that commits Orion to soaring out to the moon. It will fly to the moon over the course of a few days and travel around its far side.
Orion will face a tough return home after speeding through space. As it hits Earth’s atmosphere, Orion will be flying at 25,000 miles an hour and face temperatures of 5,000 degrees as it slows down. The capsule is designed to land under parachutes in the Pacific Ocean, not far from San Diego.

Is it possible Artemis II will be delayed?
Yes.
For safety reasons, the agency won’t launch if certain tough weather conditions roll through the Cape Canaveral, Fla., area. Delays caused by technical problems are possible, too. NASA has other dates identified for the mission if it doesn’t begin April 1.
Who are the astronauts flying on Artemis II?
The crew will be led by Wiseman, a retired Navy pilot who completed military deployments before joining NASA’s astronaut corps. He traveled to the International Space Station in 2014.
Two other astronauts will represent NASA during the mission: Glover, an experienced Navy pilot, and Koch, who began her career as an electrical engineer for the agency and once spent a year at a research station in the South Pole. Both have traveled to the space station before.
Hansen is a military pilot who joined Canada’s astronaut corps in 2009. He will be making his first trip to space.
Koch’s participation in Artemis II will mark the first time a woman has flown beyond orbits near Earth. Glover and Hansen will be the first African-American and non-American astronauts, respectively, to do the same.
What will the astronauts do during the flight?
The astronauts will evaluate how Orion flies, practice emergency procedures and capture images of the far side of the moon for scientific and exploration purposes (they may become the first humans to see parts of the far side of the lunar surface). Health-tracking projects of the astronauts are designed to inform future missions.
Those efforts will play out in Orion’s crew module, which has about two minivans worth of living area.
On board, the astronauts will spend about 30 minutes a day exercising, using a device that allows them to do dead lifts, rowing and more. Sleep will come in eight-hour stretches in hammocks.
There is a custom-made warmer for meals, with beef brisket and veggie quiche on the menu.
Each astronaut is permitted two flavored beverages a day, including coffee. The crew will hold one hourlong shared meal each day.
The Universal Waste Management System—that’s the toilet—uses air flow to pull fluid and solid waste away into containers.
What happens after Artemis II?
Assuming it goes well, NASA will march on to Artemis III, scheduled for next year. During that operation, NASA plans to launch Orion with crew members on board and have the ship practice docking with lunar-lander vehicles that Elon Musk’s SpaceX and Jeff Bezos’ Blue Origin have been developing. The rendezvous operations will occur relatively close to Earth.
NASA hopes that its contractors and the agency itself are ready to attempt one or more lunar landing missions in 2028. Many current and former spaceflight officials are skeptical that timeline is feasible.

Australia’s market is on the move again, and not always where you’d expect. We’ve found the surprise suburbs where prices are climbing fastest.

From citrus oils to warming spices, the classic G&T is being reimagined at home as a more thoughtful, seasonal ritual for modern entertaining.