Gender pay gap greatest among Australian managers
Kanebridge News
    HOUSE MEDIAN ASKING PRICES AND WEEKLY CHANGE     Sydney $1,603,134 (+0.55%)       elbourne $989,193 (-0.36%)       Brisbane $963,516 (+0.83%)       Adelaide $873,972 (+1.09%)       Perth $833,820 (+0.12%)       Hobart $754,479 (+3.18%)       Darwin $668,319 (-0.54%)       Canberra $993,398 (-1.72%)       National $1,033,710 (+0.29%)                UNIT MEDIAN ASKING PRICES AND WEEKLY CHANGE     Sydney $748,302 (+0.18%)       Melbourne $497,833 (-0.44%)       Brisbane $540,964 (-1.56%)       Adelaide $441,967 (-0.38%)       Perth $442,262 (+1.33%)       Hobart $525,313 (+0.38%)       Darwin $347,105 (-0.72%)       Canberra $496,490 (+0.93%)       National $528,262 (-0.02%)                HOUSES FOR SALE AND WEEKLY CHANGE     Sydney 10,189 (-104)       Melbourne 14,713 (+210)       Brisbane 7,971 (+283)       Adelaide 2,420 (+58)       Perth 6,383 (+298)       Hobart 1,336 (+6)       Darwin 228 (-12)       Canberra 1,029 (+8)       National 44,269 (+747)                UNITS FOR SALE AND WEEKLY CHANGE     Sydney 8,795 (-1)       Melbourne 8,207 (+293)       Brisbane 1,636 (+1)       Adelaide 421 (-4)       Perth 1,664 (+15)       Hobart 204 (-1)       Darwin 404 (-2)       Canberra 988 (+12)       National 22,319 (+313)                HOUSE MEDIAN ASKING RENTS AND WEEKLY CHANGE     Sydney $800 (+$5)       Melbourne $600 ($0)       Brisbane $640 (+$10)       Adelaide $600 ($0)       Perth $660 ($0)       Hobart $550 ($0)       Darwin $700 ($0)       Canberra $690 ($0)       National $663 (+$2)                UNIT MEDIAN ASKING RENTS AND WEEKLY CHANGE     Sydney $750 ($0)       Melbourne $590 (+$10)       Brisbane $630 ($0)       Adelaide $490 (+$10)       Perth $600 ($0)       Hobart $475 (+$23)       Darwin $550 ($0)       Canberra $570 (+$5)       National $593 (+$4)                HOUSES FOR RENT AND WEEKLY CHANGE     Sydney 5,364 (+80)       Melbourne 5,428 (+4)       Brisbane 4,002 (+12)       Adelaide 1,329 (+16)       Perth 2,113 (+91)       Hobart 398 (0)       Darwin 99 (-5)       Canberra 574 (+39)       National 19,307 (+237)                UNITS FOR RENT AND WEEKLY CHANGE     Sydney 7,687 (+257)       Melbourne 4,793 (+88)       Brisbane 2,098 (+33)       Adelaide 354 (-11)       Perth 650 (+5)       Hobart 135 (-1)       Darwin 176 (-9)       Canberra 569 (+14)       National 16,462 (+376)                HOUSE ANNUAL GROSS YIELDS AND TREND       Sydney 2.59% (↑)      Melbourne 3.15% (↑)      Brisbane 3.45% (↑)        Adelaide 3.57% (↓)       Perth 4.12% (↓)       Hobart 3.79% (↓)     Darwin 5.45% (↑)      Canberra 3.61% (↑)      National 3.33% (↑)             UNIT ANNUAL GROSS YIELDS AND TREND         Sydney 5.21% (↓)     Melbourne 6.16% (↑)      Brisbane 6.06% (↑)      Adelaide 5.77% (↑)        Perth 7.05% (↓)     Hobart 4.70% (↑)      Darwin 8.24% (↑)        Canberra 5.97% (↓)     National 5.84% (↑)             HOUSE RENTAL VACANCY RATES AND TREND       Sydney 0.8% (↑)      Melbourne 0.7% (↑)      Brisbane 0.7% (↑)      Adelaide 0.4% (↑)      Perth 0.4% (↑)      Hobart 0.9% (↑)      Darwin 0.8% (↑)      Canberra 1.0% (↑)      National 0.7% (↑)             UNIT RENTAL VACANCY RATES AND TREND       Sydney 0.9% (↑)      Melbourne 1.1% (↑)      Brisbane 1.0% (↑)      Adelaide 0.5% (↑)      Perth 0.5% (↑)        Hobart 1.4% (↓)     Darwin 1.7% (↑)      Canberra 1.4% (↑)      National 1.1% (↑)             AVERAGE DAYS TO SELL HOUSES AND TREND       Sydney 29.7 (↑)      Melbourne 30.9 (↑)      Brisbane 31.2 (↑)      Adelaide 25.1 (↑)      Perth 34.4 (↑)      Hobart 35.8 (↑)      Darwin 35.9 (↑)      Canberra 30.4 (↑)      National 31.7 (↑)             AVERAGE DAYS TO SELL UNITS AND TREND       Sydney 30.0 (↑)      Melbourne 30.5 (↑)      Brisbane 28.8 (↑)        Adelaide 25.2 (↓)       Perth 38.3 (↓)       Hobart 27.8 (↓)     Darwin 45.8 (↑)      Canberra 38.1 (↑)      National 33.1 (↑)            
Share Button

Gender pay gap greatest among Australian managers

Detailed earnings information released by the ABS today reveal a clearer picture of the differences between men and women’s pay packets

By KANEBRIDGE NEWS
Wed, Jan 24, 2024 12:23pmGrey Clock 2 min

Women in management experience the greatest hourly pay gap, new data from the Australian Bureau of Statistics shows.

The Survey of Employee Earnings and Hours released today showed the difference between average hourly earnings for men and women in management roles in May 2023 was $14.10 per hour, ABS head of labour statistics, Bjorn Jarvis said. In percentage terms, that represents a 19 percent difference.
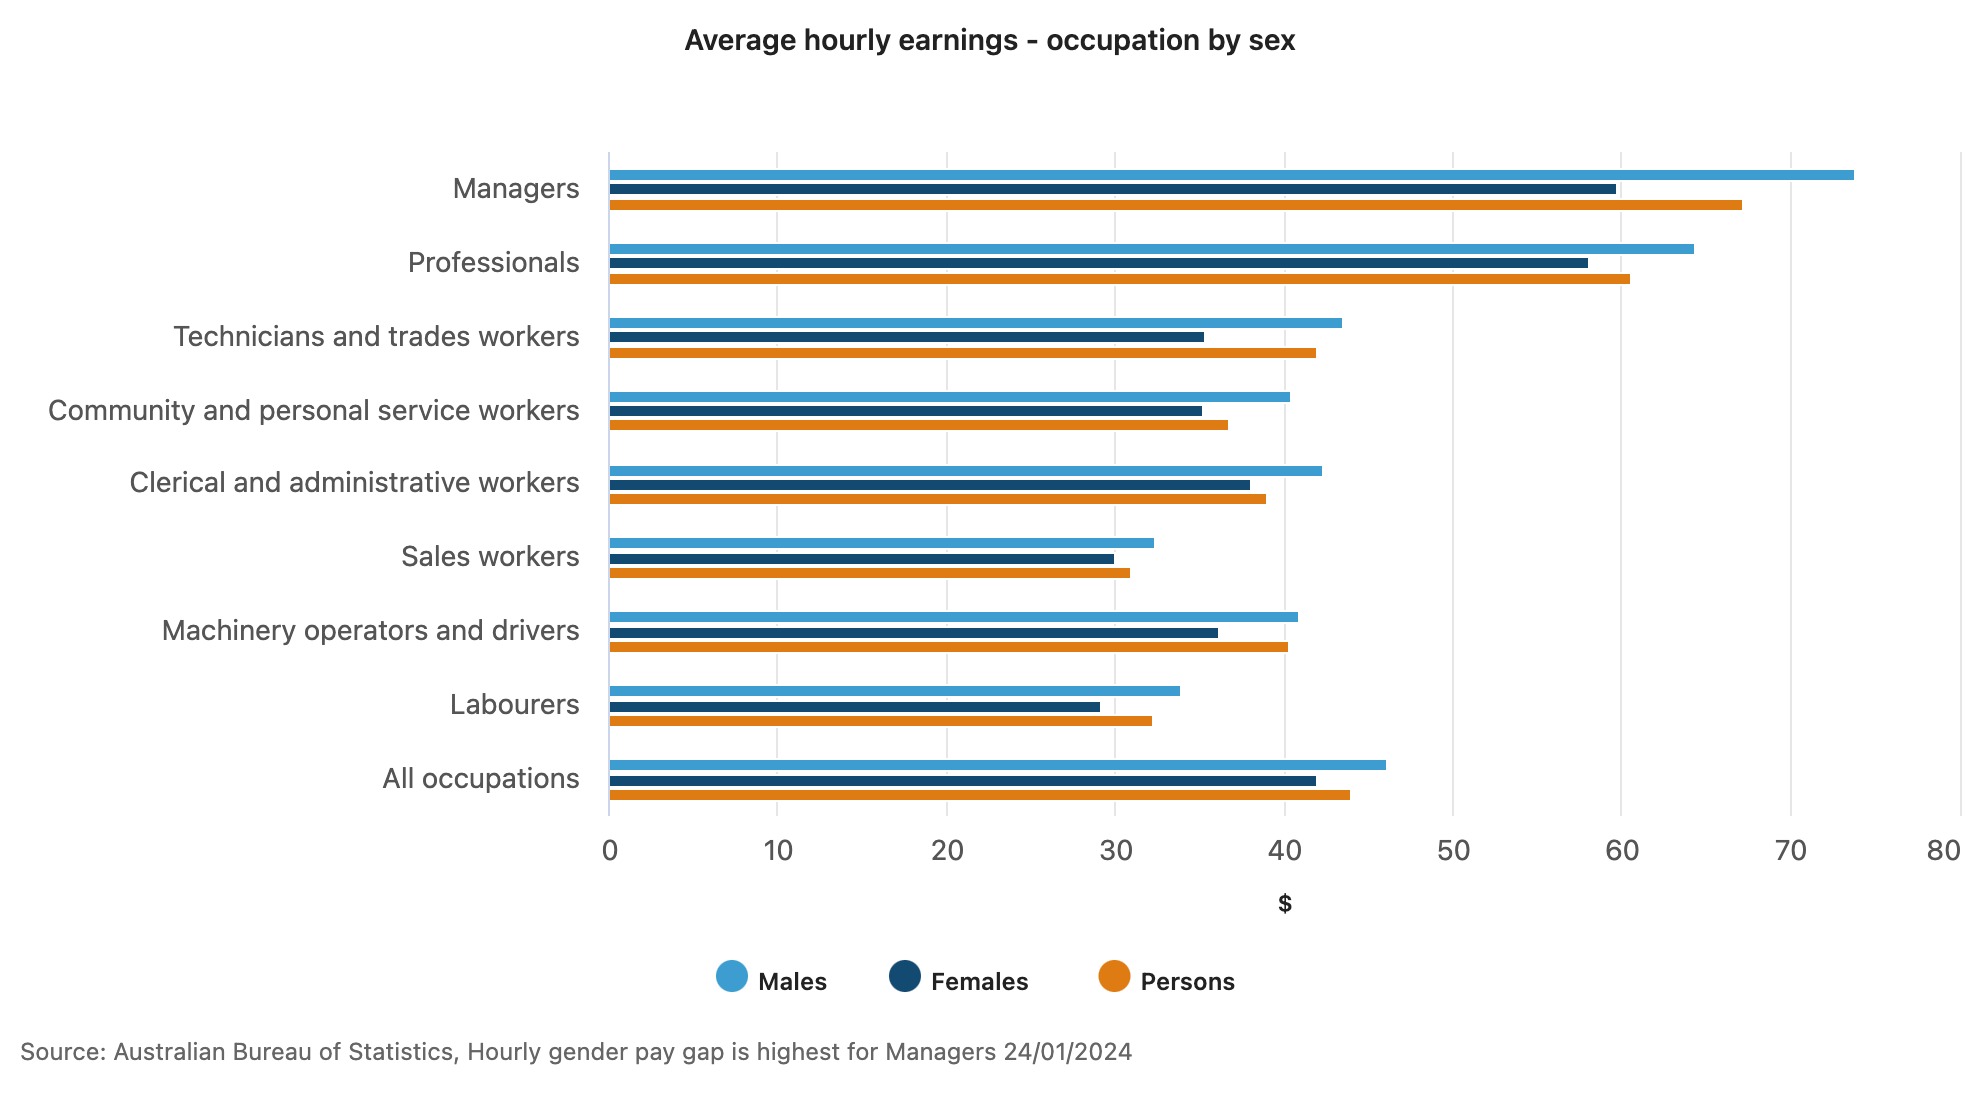
While the gap was starkest at the top level, men continued to earn more per hour across all eight major occupation groups, the statistics revealed, with the smallest gap among sales workers at 7 percent.

In terms of weekly earnings, men earned an average of $1,731 and women $1,261. The average pay for all employees was $1,490 in May 2023.

“Analysing the difference between male and female earnings is complex and there is no single measure that can provide a complete picture,” Mr Jarvis said. “Hourly earnings comparisons are particularly useful in understanding gender pay differences beyond weekly earnings measures, given women are more likely to work part-time than men.”

For part time workers, where women make up the majority at 69 percent of employees, women earn more on average at $817 compared with $759 for men.

“This reflects the greater use of part-time working arrangements by women in higher paying jobs, compared to men,” Mr Jarvis says.

Across the employment sector, distributional data showed that the top 25 percent of workers earned more than $1,956 per week in May 2023 while the lowest 25 percent earned less than $785. On an hourly basis, managers came out on top at $67.20 per hour, followed by professionals at $60.60, followed by labourers ($32.20) and sales workers ($30.90). 


MOST POPULAR
11 ACRES ROAD, KELLYVILLE, NSW

This stylish family home combines a classic palette and finishes with a flexible floorplan

35 North Street Windsor

Just 55 minutes from Sydney, make this your creative getaway located in the majestic Hawkesbury region.

Related Stories
Property
How much income is required to service a mortgage? It depends on where you live
By Bronwyn Allen 25/04/2024
Money
Australian Inflation Stays Strong, Highlighting Challenge Facing RBA
By DAVID WINNING 25/04/2024
Money
Personal Wardrobe of the Iconic Late Fashion Designer Vivienne Westwood Goes up for Auction
By CASEY FARMER 25/04/2024
How much income is required to service a mortgage? It depends on where you live

New research suggests spending 40 percent of household income on loan repayments is the new normal

By Bronwyn Allen
Thu, Apr 25, 2024 3 min

Requiring more than 30 percent of household income to service a home loan has long been considered the benchmark for ‘housing stress’. Yet research shows it is becoming the new normal. The 2024 ANZ CoreLogic Housing Affordability Report reveals home loans on only 17 percent of homes are ‘serviceable’ if serviceability is limited to 30 percent of the median national household income.

Based on 40 percent of household income, just 37 percent of properties would be serviceable on a mortgage covering 80 percent of the purchase price. ANZ CoreLogic suggest 40 may be the new 30 when it comes to home loan serviceability. “Looking ahead, there is little prospect for the mortgage serviceability indicator to move back into the 30 percent range any time soon,” says the report.

“This is because the cash rate is not expected to be cut until late 2024, and home values have continued to rise, even amid relatively high interest rate settings.” ANZ CoreLogic estimate that home loan rates would have to fall to about 4.7 percent to bring serviceability under 40 percent.

CoreLogic has broken down the actual household income required to service a home loan on a 6.27 percent interest rate for an 80 percent loan based on current median house and unit values in each capital city. As expected, affordability is worst in the most expensive property market, Sydney.

Sydney

Sydney’s median house price is $1,414,229 and the median unit price is $839,344.

Based on 40 percent serviceability, households need a total income of $211,456 to afford a home loan for a house and $125,499 for a unit. The city’s actual median household income is $120,554.

Melbourne

Melbourne’s median house price is $935,049 and the median apartment price is $612,906.

Based on 40 percent serviceability, households need a total income of $139,809 to afford a home loan for a house and $91,642 for a unit. The city’s actual median household income is $110,324.

Brisbane

Brisbane’s median house price is $909,988 and the median unit price is $587,793.

Based on 40 percent serviceability, households need a total income of $136,062 to afford a home loan for a house and $87,887 for a unit. The city’s actual median household income is $107,243.

Adelaide

Adelaide’s median house price is $785,971 and the median apartment price is $504,799.

Based on 40 percent serviceability, households need a total income of $117,519 to afford a home loan for a house and $75,478 for a unit. The city’s actual median household income is $89,806.

Perth

Perth’s median house price is $735,276 and the median unit price is $495,360.

Based on 40 percent serviceability, households need a total income of $109,939 to afford a home loan for a house and $74,066 for a unit. The city’s actual median household income is $108,057.

Hobart

Hobart’s median house price is $692,951 and the median apartment price is $522,258.

Based on 40 percent serviceability, households need a total income of $103,610 to afford a home loan for a house and $78,088 for a unit. The city’s actual median household income is $89,515.

Darwin

Darwin’s median house price is $573,498 and the median unit price is $367,716.

Based on 40 percent serviceability, households need a total income of $85,750 to afford a home loan for a house and $54,981 for a unit. The city’s actual median household income is $126,193.

Canberra

Canberra’s median house price is $964,136 and the median apartment price is $585,057.

Based on 40 percent serviceability, households need a total income of $144,158 to afford a home loan for a house and $87,478 for a unit. The city’s actual median household income is $137,760.


MOST POPULAR
11 ACRES ROAD, KELLYVILLE, NSW

This stylish family home combines a classic palette and finishes with a flexible floorplan

35 North Street Windsor

Just 55 minutes from Sydney, make this your creative getaway located in the majestic Hawkesbury region.

Related Stories
Money
Barron’s 100 Most Sustainable Companies
By LAUREN FOSTER 25/02/2024
Lifestyle
Fisker Stock Tanks After Poor Earnings. EV Concerns Accelerate.
By Al Root 15/11/2023
Property
If You’re Buying a Home Near a Nightmare Neighbour, You Might Want to Think Again
By ROBYN A. FRIEDMAN 14/03/2024
0
    Your Cart
    Your cart is emptyReturn to Shop