He Stole Hundreds of iPhones and Looted People’s Life Savings. He Told Us How.
A convicted iPhone thief explains how a vulnerability in Apple’s software got him fast cash—and then a stint in a high-security prison

 5 min
5 min
RUSH CITY, Minn.—Before the guards let you through the barbed-wire fences and steel doors at this Minnesota Correctional Facility, you have to leave your phone in a locker. Not a total inconvenience when you’re there to visit a prolific iPhone thief.
I wasn’t worried that Aaron Johnson would steal my iPhone, though. I came to find out how he’d steal it.
“I’m already serving time. I just feel like I should try to be on the other end of things and try to help people,” Johnson, 26 years old, told me in an interview we filmed inside the high-security prison where he’s expected to spend the next several years.
For the past year, my colleague Nicole Nguyen and I have investigated a nationwide spate of thefts, where thieves watch iPhone owners tap their passcodes, then steal their targets’ phones—and upend their financial and digital lives.
Johnson, along with a crew of others, operated in Minneapolis for at least a year during 2021 and 2022. In and around bars at night, he would befriend young people, slyly learn their passcodes and take their phones. Using that code, he’d lock victims out of their Apple accounts and loot thousands of dollars from their bank apps. Finally, he’d sell the phones themselves.
It was an elaborate, opportunistic scheme that exploited the Apple ecosystem and targeted trusting iPhone owners who figured a stolen phone was just a stolen phone.
Last week, Apple announced Stolen Device Protection, a feature that likely will protect against these passcode-assisted crimes.
Yet even when you install the software, due in iOS 17.3, there will be loopholes. The biggest loophole? Us. By hearing how Johnson did what he did, we can learn how to better secure the devices that hold so much of our lives.
How he got started
Johnson isn’t a sophisticated cybercriminal. He said he got his start pickpocketing on the streets of Minneapolis. “I was homeless,” he said. “Started having kids and needed money. I couldn’t really find a job. So that’s just what I did.”
Soon he realised the phones he was nabbing could be worth a lot more—if only he had a way to get inside them. Johnson said no one taught him the passcode trick, he just stayed up late one night fiddling with a phone and figured out how to use the passcode to unlock a bounty of protected services.
“That passcode is the devil,” he said. “It could be God sometimes—or it could be the devil.”
According to the Minneapolis Police Department’s arrest warrant, Johnson and the other 11 members of the enterprise allegedly accumulated nearly $300,000. According to him, it was likely more.
“I had a rush for large amounts at a time,” he said. “I just got too carried away.”
In March, Johnson, who had prior robbery and theft convictions, pleaded guilty to racketeering and was sentenced to 94 months. He told the judge he was sorry for what he did.
How he did it
Here’s how the nightly operation would go down, according to interviews with Johnson, law-enforcement officials and some of the victims:
Pinpoint the victim. Dimly lit and full of people, bars became his ideal location. College-age men became his ideal target. “They’re already drunk and don’t know what’s going on for real,” Johnson said. Women, he said, tended to be more guarded and alert to suspicious behaviour.
Get the passcode. Friendly and energetic, that’s how victims described Johnson. Some told me he approached them offering drugs. Others said Johnson would tell them he was a rapper and wanted to add them on Snapchat. After talking for a bit, they would hand over the phone to Johnson, thinking he’d just input his info and hand it right back.
“I say, ‘Hey, your phone is locked. What’s the passcode?’ They say, ‘2-3-4-5-6,’ or something. And then I just remember it,” Johnson described. Sometimes he would record people typing their passcodes.
Once the phone was in his hand, he’d leave with it or pass it to someone else in the crew.
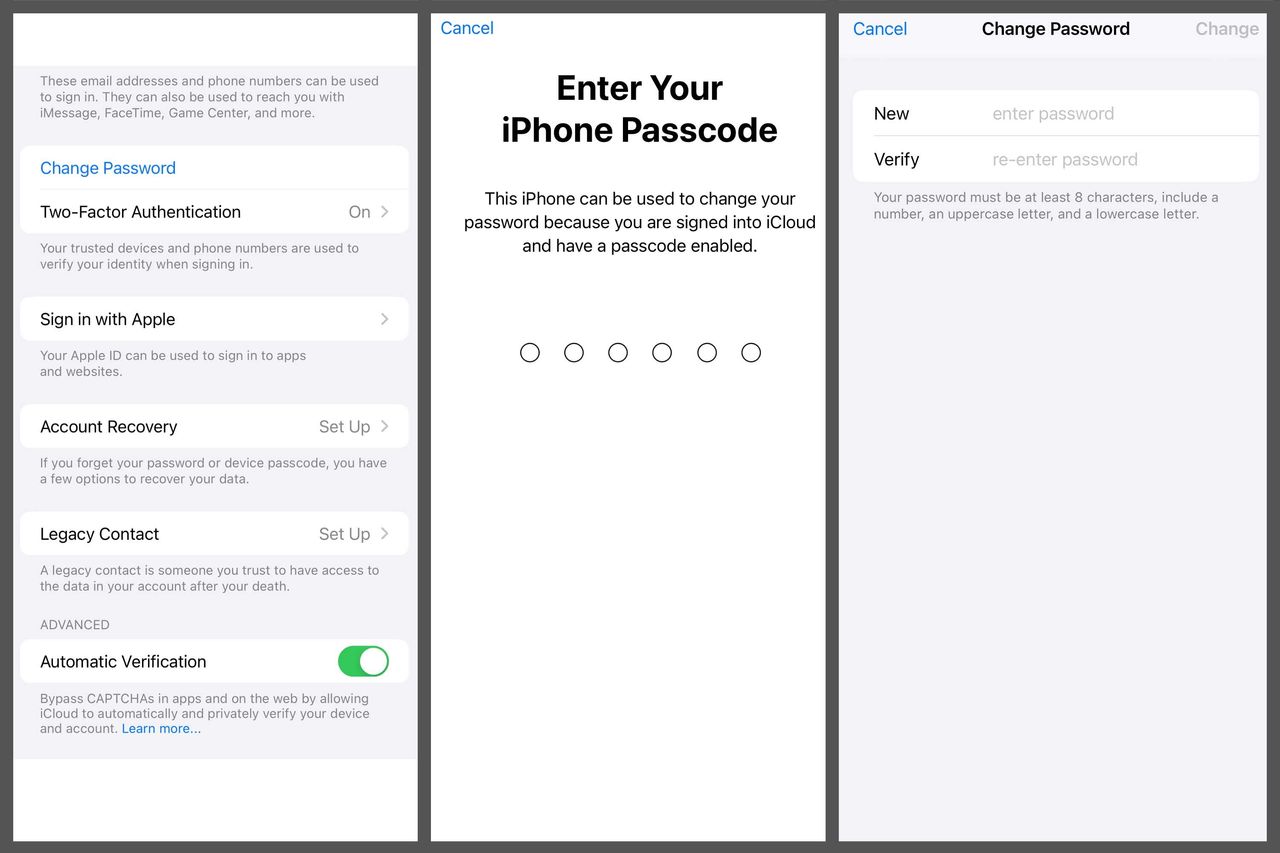
Lock them out—fast. Within minutes of taking the iPhones, Johnson was in the Settings menu, changing the Apple ID password. He’d then use the new password to turn off Find My iPhone so victims couldn’t log in on some other phone or computer to remotely locate—and even erase—the stolen device.
Johnson was changing passwords fast—“faster than you could say supercalifragilisticexpialidocious,” he said. “You gotta beat the mice to the cheese.”
Take the money. Johnson said he would then enrol his face in Face ID because “when you got your face on there, you got the key to everything.” The biometric authentication gave Johnson quick access to passwords saved in iCloud Keychain.
Savings, checking, cryptocurrency apps—he was looking to transfer large sums of money out. And if he had trouble getting into those money apps, he’d look for extra information, such as Social Security numbers, in the Notes and Photos apps.
By the morning, he’d have the money transferred. That’s when he’d head to stores to buy stuff using Apple Pay. He’d also use the stolen Apple devices to buy more Apple devices, most often $1,200 iPad Pro models, to sell for cash.
Sell the phones. Finally, he’d erase the phone and sell it to Zhongshuang “Brandon” Su who, according to his arrest warrant, sold them overseas.
While Johnson did steal some Android phones, he went after iPhones because of their higher resale value. At bars, he’d scope out the scene—looking for iPhone Pro models with their telltale trio of cameras. He said Pro Max with a terabyte of storage could get him $900. Su also bought Johnson’s purchased iPads.
Su pleaded guilty to receiving stolen property and was sentenced to 120 days at an adult corrections facility in Hennepin County, Minn. Neither Su nor his lawyer responded to requests for comment.
On a good weekend, Johnson said, he was selling up to 30 iPhones and iPads to Su and making around $20,000—not including money he’d taken from victims’ bank apps, Apple Pay and more.
How you can prevent it
A week after my trip to Minnesota, Apple announced Stolen Device Protection. The security setting will likely foil most of Johnson’s tricks, but it won’t be turned on automatically.
If you don’t turn it on, you’re as vulnerable as ever. Switching it on adds a line of defence to your phone when away from familiar locations such as home or work.
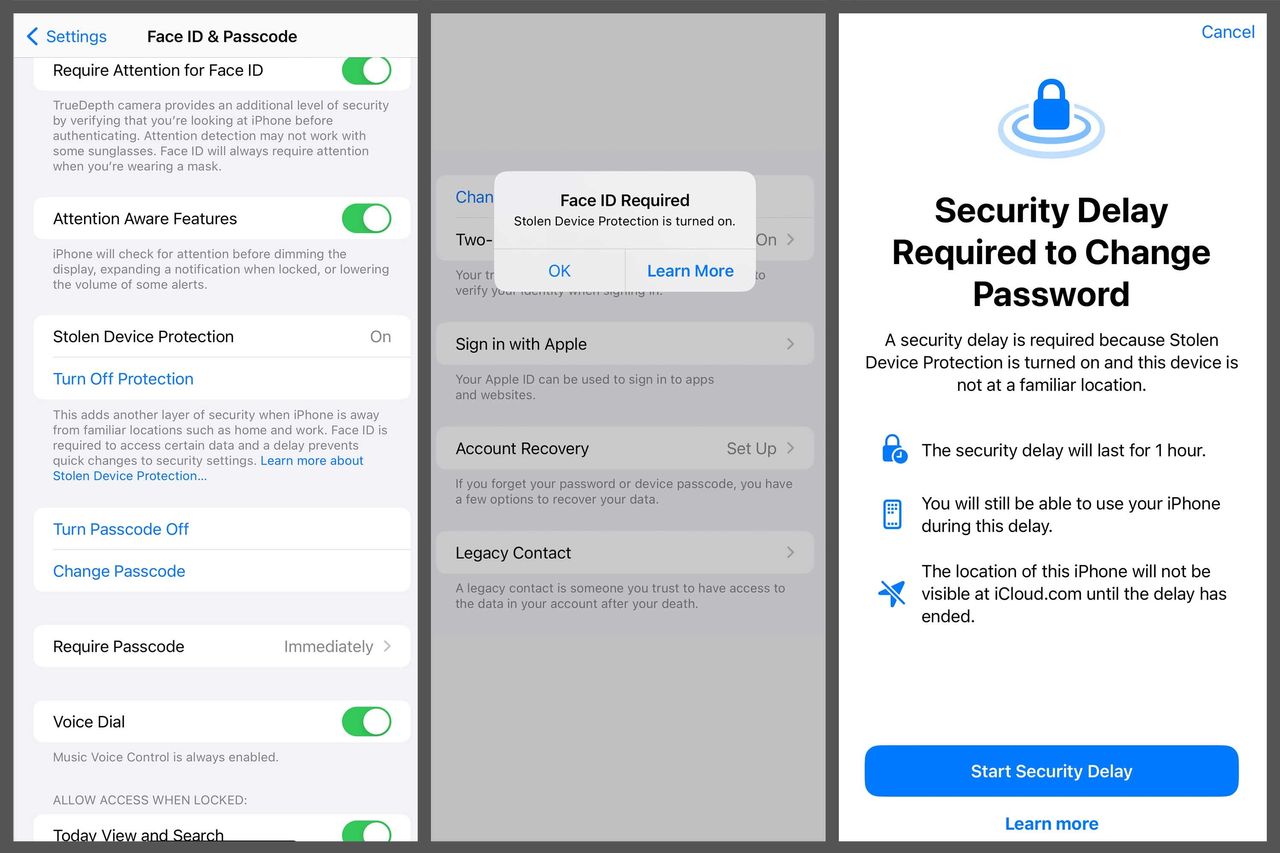
To change the Apple ID password, a thief would need Face ID or Touch ID biometric scans—that is, your face or your finger. The passcode alone won’t work. And the process has a built-in hourlong delay, followed by another biometric scan. This same slow process is also required for adding a new Face ID and disabling Find my iPhone.
Some functions, such as accessing saved passwords in iCloud Keychain or erasing the iPhone, are available without the delay but still require Face ID or Touch ID.
A criminal might still be motivated to kidnap a person with lots of money, then slowly break through these layers of security. However, the protections will likely dissuade thieves who just want to grab phones and flee the scene.
So what loopholes remain? A thief who gets the passcode could still buy things with Apple Pay. And any app that isn’t protected by an additional password or PIN—like your email, Venmo, PayPal and more—is also vulnerable.
That’s why you should also:
- Add a distinct passcode to money apps, like Venmo and Cash App.
- Delete any notes or photos that include personal information such as passwords or Social Security numbers. Store that stuff in a secure note inside a third-party password manager, such as Dashlane or 1Password.
- Create a stronger iPhone passcode—one that uses letters and numbers.
The most obvious is Johnson’s advice: Watch your surroundings and don’t give your passcode out.
If this crime has taught us anything, it’s that a single device now contains access to our entire lives—our memories, our money and more. It’s on us to protect them.
—Nicole Nguyen contributed to this article.
 Copyright 2020, Dow Jones & Company, Inc. All Rights Reserved Worldwide. LEARN MORE


Brickworks has enlisted acclaimed architecture studio Kennedy Nolan to explore how homes could become more adaptable, energy-efficient and connected to community.

Ophora Tallawong has launched its final release of quality apartments priced under $700,000.


With US$40 million already committed, the Global Talent Fund is attracting investor attention with a strategy focused on building globally scalable consumer brands alongside high-profile talent.
2 min
A new investment fund targeting celebrity-founded consumer brands has secured US$40 million in commitments and is rapidly approaching its US$50 million fundraising target, signalling growing investor appetite for alternative opportunities beyond traditional asset classes.
The Global Talent Fund, which has a maximum raise of US$100 million, focuses on building and investing in consumer businesses alongside celebrities, athletes, and influential personalities who play an active role as co-founders rather than simply endorsing products.
The strategy is based on the belief that changes in consumer behaviour, particularly the rise of social media and digital engagement, have fundamentally altered how brands are built and scaled.
GTF founding partner Jeremy Hunt, who is helping lead the fund’s strategy, said consumers increasingly feel connected to personalities they follow online and are more willing to support products developed by those individuals.
“Consumers are searching for content to engage with, and when a celebrity they like or follow takes them on the journey of creating a product or brand, they genuinely feel part of that process,” he said.
The fund is targeting high-growth consumer sectors including wellness, hydration, beauty and recovery, areas Hunt believes continue to benefit from strong global demand and ongoing innovation.
Rather than backing celebrity endorsement deals, the fund is seeking businesses where talent is deeply involved in product development, brand creation and long-term growth.
According to Hunt, authenticity remains one of the biggest differentiators between successful celebrity-backed brands and those that fail.
“The consumer can see clearly if someone is simply being paid to promote a product,” he said. “The winners are typically the brands where the celebrity has genuinely helped build the business from the ground up.”
The model has attracted support from several prominent Australian investors and business families, reflecting broader interest in alternative investments with global growth potential.
Hunt said consumer brands offered a level of tangibility that many investors found appealing.
“Consumer brands are what we touch, feel, smell and taste every day,” he said. “Our investors understand the growth potential in the model, but they also want to be part of the journey.”
The fund’s rapid progress towards its fundraising target comes amid growing recognition that celebrity influence, when combined with strong commercial execution and scalable business models, can create significant enterprise value.
With several high-profile celebrity-founded businesses generating billion-dollar exits in recent years, supporters of the strategy believe the opportunity remains in its early stages.
For more information, contact marc@kanebridge.com.au

Two coming 2027 models – the first of the “Neue Klasse” cars coming to the U.S. early next year – have been revealed.

As the season turns, Handpicked Wines’ latest Pinot Noir and Chardonnay releases reveal how subtle shifts in place shape what ends up in the glass.