How Is China’s Economy Doing? Not Nearly as Well as China Says It Is
2023 was supposed to be the year that China turned things around. Instead, the opposite happened.

 5 min
5 min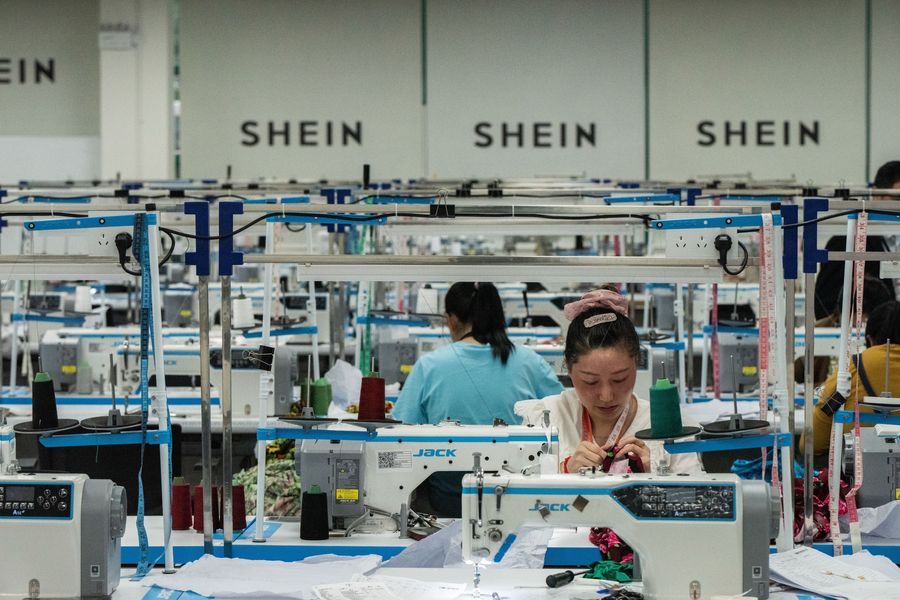
This year was supposed to be a turning point for China, a time when the economy headed toward recovery. It turned out to be the opposite.
It’s hard to remember now, but at the start of 2023, the country’s prospects couldn’t have been brighter—in part because of the terrible human price leaders had elected to pay for getting back to growth by ripping off the Band-Aid of its zero-Covid policy toward the end of 2022.
Six months later, everybody was scrambling to understand why their predictions had gone awry.
The common answer—that it was due to the damage to household sentiment caused by draconian pandemic lockdowns—missed the forest for the trees. Well before the pandemic, Beijing’s property bubble, government fiscal tricks and delays in market overhauls had foreordained stagnation. Covid-era conditions didn’t cause this structural crunch, but rather masked its inevitability. On the eve of 2023, Beijing was reporting just 3% GDP expansion, though it is easy to argue that growth in 2022 was actually negative.
Despite the obvious, Chinese officials forecast a 5% to 6% target for 2023.
Once the target was set, officials got to work to make sure it happened. But with business investment still flat or negative due to the still-falling property sector, net exports declining and government spending constrained by shrinking tax and fee revenues, the full burden of delivering China’s forecast growth fell on household consumption.
By spring, it was becoming evident that getting enough consumption to drive 5% GDP growth would require government stimulus. However, though support for state-owned enterprises and banks was perennial, rumours of leader distaste for support for households as “welfarism” swirled, and fiscal stimulus never happened.
Changing the facts
This left officials with only one option for making their targets: They changed previous consumption statistics to make the numbers add up to 5%-plus growth for 2023. While this result is fundamentally inconsistent with evidence over the year, the IMF accepted Beijing’s calculations and updated its own 2023 China projection, out of cycle, on Nov. 7.
An independent tally of 2023 growth might accept Beijing’s official figures of 5% consumption growth as of the third quarter, but the other components of GDP remain flat or negative: government spending, net exports and business investment. Taken together, depending on how negative property investment is assumed to have been in 2023, China’s 2023 GDP probably grew 0 to 2.5%.
This slower growth estimate is far out of whack with the official figures endorsed by Beijing and the IMF, but is far easier to reconcile with the anecdotal evidence this year:
- Localities cutting bus service and street lighting
- Unexplained alteration of statistics to inflate apparent growth
- Suppression of data series telling a bleak story
- Negative foreign direct investment for the first time in modern history
- Price deflation
- Emergency expansion of fiscal deficit despite reporting solid growth
- Further takeover of private developers
- Net collection of debt repayment from Belt and Road Initiative countries rather than new official development assistance
- Persistent effort to fix the value of the renminbi stronger against the dollar all year
- Among the worst-performing major stock markets of the year
- Strong reported and unreported capital outflows
- The lowest marriage and birth rates on record
These are just selected bearish indications that are widely known. Officials regularly airbrush over evidence of economic stress, and citizens can be punished for being negative.
Private pessimism
In private, though, Chinese economists were more frank this year. One stated to me that having already shrunk from greater than 70% of the size of the U.S. economy to 67%, bad policy choices were locking in an inevitable descent to 40%. Another said it was a miracle the property downturn hadn’t spilled over into a full-blown financial crisis, yet. Yet another said that neglect of economic growth could lead to social and political instability.
Despite this evidence, Chinese officials put political targets over economic credibility, finding ways to claim growth was on track, such as by stipulating that hard-to-measure services activity was suddenly booming—a claim that couldn’t be refuted given the paucity of quality services-sector data. Authorities insisted the system was working fine and GDP growth would be above 5%, brushing off questions about why foreign firms were leaving, private domestic firms were refusing to invest or make new hires, and consumers were behaving with such caution.
Beijing often claimed weak global conditions explained China’s headwinds, but the U.S.’s performance was the mirror opposite of China’s this year. Having already jacked up interest rates to 4.5% from near-zero a year before, in 2023 the Fed lifted rates four more times to 5.5%. This was widely expected to lead to recession, but by the third quarter real U.S. GDP was holding even with China’s (exaggerated) 4.9% growth, inflation was stabilizing, employment levels were excellent, and foreign firms (including Chinese, where permitted) were making a beeline to the U.S. to avail themselves of subsidies and tax breaks.
What a difference a year makes. In January, the betting was that China’s growth would be five times U.S. growth; instead, taking the statistical funny business out of China’s numbers, the U.S. growth is outpacing China’s. Given the weak renminbi, this picture is even stronger in U.S. dollar terms.
Business leaders have long known that doing business in China meant tolerating risk. There was political risk, intellectual-property-theft risk, market-competition risk, reputational risk, exchange-rate risk, and countless other concerns. But one thing that didn’t require CEO attention was macroeconomic risk: China was a pain, but since it was a huge fraction of global growth, that was tolerable.
This was the year that changed, and macroeconomic risk became just as concerning in China as it is in other economies. In 2022, Covid could be blamed for everything; in 2023, policy and business leaders recognized that China’s goldilocks era was over. Now Beijing would have the same odds of solving unresolved middle-income problems as anyone else.
What next?
Three implications for 2024 flow from this.
First, after the severe 2021-23 property correction, we are approaching a bottom, and construction could add to growth next year instead of subtracting. But few other cyclical drivers are set to turn up, and long-term structural constraints on consumption, government spending and net exports remain.
Crisis risks and liabilities were only kicked down the road in 2023, not resolved, and will continue to drive anxiety in 2024. Compared with this year’s anemic actual GDP, China could see a modest cyclical improvement in 2024, but nowhere near the aspiration of 5%.
Second, 2024 is the year the global spillover implications of China’s slowdown will sink in. Advanced economies will downgrade the importance of market access in China, and Global South nations will be forced to find other engines of development. This means a new phase of geopolitical conditions, with the anchor assumption of a rising China and declining U.S. being retired. The implications of this will be far reaching and challenging to forecast.
Finally, the 2024 wild card is that China could turn back to the market pragmatism that made it the star of globalization over past decades. Security and political experts doubt that Xi Jinping has a single reform-oriented bone in his body. Maybe not, but if market overhaul is the only thing that can enable the Communist Party to pay its bills and finance its aspirations, then no one should rule it out.
In fact, in his first term, starting in 2013, Xi tried to make the market more central, only to suspend the effort after realizing how challenging it would be. Yes, it is difficult to imagine China reversing course on statism today, but it was just as hard to imagine it ending zero-Covid policies last year, or selling stakes in the national oil companies to foreigners 20 years ago.
Reform isn’t the base case for China 2024, but China has a record of surprising, and reform is more than a trivial possibility. That is why smart firms are protecting the option to stay in the China game, even while breathless American politicians talk about gratuitous and unlimited decoupling. In 2024, smart Western officials will give priority to rationality on China, so they can take advantage of Beijing’s economic stumbles—without needlessly damaging the economic and geopolitical interests of their own nations.
 Copyright 2020, Dow Jones & Company, Inc. All Rights Reserved Worldwide. LEARN MORE





From making unpopular decisions to learning when to listen, leaders from five businesses reveal what nobody prepared them for — and how running a company has challenged their expectations.

Technology and semiconductor shares fell sharply as investors questioned the debt financing the AI infrastructure boom and confronted higher rates and Chinese competition.

Technology and semiconductor shares fell sharply as investors questioned the debt financing the AI infrastructure boom and confronted higher rates and Chinese competition.
4 minA sharp technology sell-off has exposed a new anxiety on global markets: whether the enormous borrowing behind the artificial-intelligence infrastructure boom can generate sufficient returns as interest rates rise and Chinese competition intensifies.
The artificial-intelligence investment boom has powered technology shares, semiconductor manufacturers and data-centre operators to extraordinary heights. Last week, investors were given a reminder that much of this expansion is being built with borrowed money.
The technology-heavy Nasdaq Composite fell 4.5 per cent over the week ended October 16, its weakest performance since late June. Semiconductor shares suffered an even deeper correction, with the Philadelphia Semiconductor Index losing about 11.4 per cent.
The selling spread quickly through global markets. Micron Technology fell 14.6 per cent over the week, while South Korea’s Samsung Electronics and SK Hynix dropped approximately 18 per cent and 24 per cent respectively.
This was more than a routine bout of profit-taking. Investors were reassessing three interconnected risks: higher interest rates, the rapidly expanding debt burden attached to AI infrastructure and the prospect of stronger competition from Chinese memory-chip manufacturers.
The debt behind the AI build-out
Artificial intelligence requires a physical infrastructure network of enormous scale. Data centres must be built, advanced processors purchased, power supplies secured and cooling systems installed before customers begin generating meaningful revenue from them.
Technology companies are increasingly supplementing their own cash with corporate bonds, syndicated loans, equipment leases, private credit and project-level financing.
JPMorgan describes the emerging funding model as a combination of conventional corporate borrowing and project finance tied to individual data-centre assets. In Australia, the Reserve Bank estimates that syndicated loans accounted for approximately three-quarters of data-centre financing during 2025 and 2026 to date.
The numbers are becoming large enough to affect broader credit markets. The Federal Reserve Bank of Dallas has cited Wall Street estimates suggesting AI-related investment-grade bond issuance could approach US$300 billion in 2026 alone.
That borrowing is not automatically problematic. Debt can be an efficient way to finance long-lived infrastructure when future revenue is sufficiently predictable. The concern is that AI technology, customer demand and computing economics are changing much faster than the repayment schedules attached to the assets.
A data centre financed today may carry debt for years. Investors must therefore make assumptions about future utilisation rates, electricity prices, chip performance, customer concentration and the amount businesses will ultimately pay for AI computing.
When interest rates rise, those assumptions become less forgiving.
Inflation changes the calculation
September’s US inflation data intensified the pressure. Consumer prices increased 3.7 per cent over the year, ahead of market expectations and up from 3.4 per cent in August.
The hotter reading reduced confidence that interest rates would fall quickly and pushed bond yields higher. That matters particularly for companies whose valuations depend on profits expected well into the future, as well as highly leveraged infrastructure operators that may need to refinance.
CoreWeave has emerged as a closely watched test case. The specialist cloud-computing company has accumulated substantial debt and lease obligations to build AI capacity, while relying on a concentrated group of large technology customers.
Its shares fell sharply during the sell-off, while the cost of insuring its debt against default climbed. CoreWeave has argued that its contracted backlog more than covers its obligations and that financial markets do not always understand its business model. Nevertheless, its securities have become a proxy for investor confidence in debt-funded AI infrastructure.
Oracle, another major investor in AI computing capacity, fell 8.8 per cent in Friday trading, while CoreWeave dropped 15.5 per cent.
The question is shifting from how much AI infrastructure can be built to how profitably it can be operated.
China adds another source of pressure
Interest rates were not the only catalyst. Reports of advances by Chinese memory-chip producer ChangXin Memory Technologies raised concerns that lower-cost Chinese products could increase competition across the global semiconductor industry.
Memory chips are essential to AI systems, but the industry is historically cyclical. Periods of tight supply and high pricing can encourage rapid investment, eventually producing oversupply and falling margins.
The prospect of a well-funded Chinese competitor expanding its technological capabilities unsettled investors in Samsung, SK Hynix and Micron. It also demonstrated that AI-related demand does not insulate chipmakers from conventional competitive pressures.
That combination—slower rate cuts, more expensive financing and potentially cheaper supply—challenged the assumption that every company exposed to AI would enjoy continually expanding margins.
A reset rather than the end of the boom
The sell-off does not establish that the AI boom is ending. Demand for computing power remains strong, the largest technology companies continue to generate formidable cash flows and many infrastructure projects are backed by long-term customer contracts.
What has changed is the market’s willingness to overlook the price and financing structure of that growth.
The most resilient companies are likely to be those able to fund investment from operating cash flow, secure long-duration customers and demonstrate that new capacity will earn returns comfortably above its financing costs.
More speculative operators may face greater scrutiny, particularly where debt is expensive, customers are concentrated or expected revenue depends on demand that has not yet materialised.
For Australian investors, the lesson extends beyond US technology shares. Local data-centre operators, infrastructure funds, electricity suppliers and property groups are increasingly exposed to the same investment cycle.
Artificial intelligence may remain one of the defining growth themes of the decade. But last week’s correction showed that enthusiasm for the technology does not eliminate financial discipline.
The next stage of the AI boom will be judged not only by computing power, model performance or demand for chips, but by something more traditional: whether the assets being financed can generate enough cash to repay the money borrowed to build them.
Fact box
Nasdaq Composite: Down 4.5 per cent for the week ended October 16, 2026
Philadelphia Semiconductor Index: Down approximately 11.4 per cent
Micron Technology: Down approximately 14.6 per cent
Samsung Electronics: Down approximately 18 per cent
SK Hynix: Down approximately 24 per cent
US September inflation: 3.7 per cent annually
Estimated 2026 AI-related investment-grade issuance: Approximately US$300 billion

All three vehicles will form part of a broader charitable initiative benefiting Big Brothers Big Sisters of America, the American Red Cross and Starlight Children’s Foundation

Singapore’s Formula 1 weekend has always looked different. Held beneath floodlights on the Marina Bay Street Circuit, the race transforms the city into a nocturnal spectacle of speed, heat and saturated colour. It is this distinctive atmosphere — and one of Singapore’s most important natural symbols — that has shaped IWC Schaffhausen’s latest motorsport-inspired watch. …
Continue reading “IWC’s purple Formula 1 chronograph pays tribute to Singapore after dark”