Many Boards Are Playing Catch-Up on ESG and Green Issues
Company board directors say ESG efforts have brought about real benefits, but the political backlash has had an impact

 5 min
5 min
Many corporate board directors aren’t confident about their ability—or their board’s—to oversee sustainability and social impact issues, even as companies pursue such goals and regulators want more disclosures on environmental, social and governance impact.
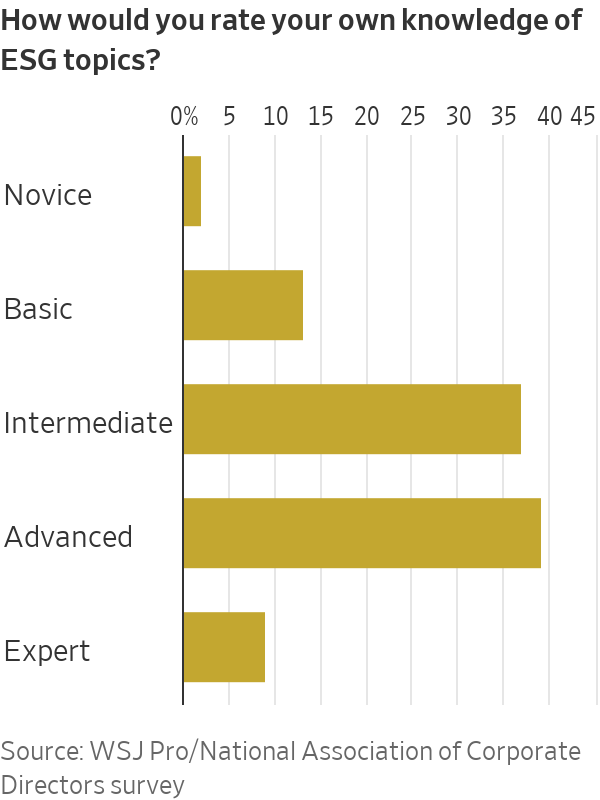
Eighty-three percent of directors surveyed said ESG topics were critical knowledge for directors, but less than half considered themselves to have “advanced” or “expert” level knowledge, according to a survey of board directors conducted in July by WSJ Pro in collaboration with the National Association of Corporate Directors.Directors of larger firms and listed companies expressed higher confidence, as did those in the energy industry.Respondents relied on external advisers to build their knowledge.
Other findings were that most believed sustainability efforts had brought real benefits and said ESG engagement with investors had been mostly positive. Directors also said the anti-ESG movement had an impact. They also reported that while about half of big companies had ESG targets—many linked to executive compensation—smaller, private companies lagged behind.
The survey’s 506 respondents covered a range of company sizes and included public, private and not-for-profit organizations from many sectors, with a concentration in financial services, industry, tech and energy. They said their ESG maturity level was across the spectrum: 4% self-identified as industry leaders, 27% as well developed, 36% as somewhat developed, 28% as early stage and 5% hadn’t started with ESG. Overall respondents rated their own ESG expertise slightly higher than that of their fellow board members.
Training up on sustainability
“As a board member, if you’re hoping that ESG is just a fad that will pass with time, we have enough data now from the last 2½ decades to know ESG is here to stay and boards need to be ready,” said Kristin Campbell, general counsel and chief ESG officer of Hilton Worldwide Holdings and board director at ODP and Regency Centers.
Campbell said boards must evaluate ESG as part of the company’s long-term strategy, otherwise activists, regulators, customers or someone else might do it for them, perhaps in a way that will be painful operationally or harmful to their reputation. “It’s that classic story of either you’re at the table or you’re on the menu,” said Campbell.
Alan Smith—responsible for the strategic management of the Church of England’s £10.1 billion (equivalent to $12.6 billion) perpetual endowment fund—said many boards had brushed up on ESG knowledge with in-house training, e-learning packages or advisers to run workshops. A former senior adviser at HSBC on climate and ESG risk and current First Church Estates Commissioner, Smith said he also found it helpful to see projects, such as offshore-wind farms, and speak to their operators in person.
“I think an integrated approach to board director education—of which one important part is getting on the ground and in the mud or on the boat—is very important,” he said.
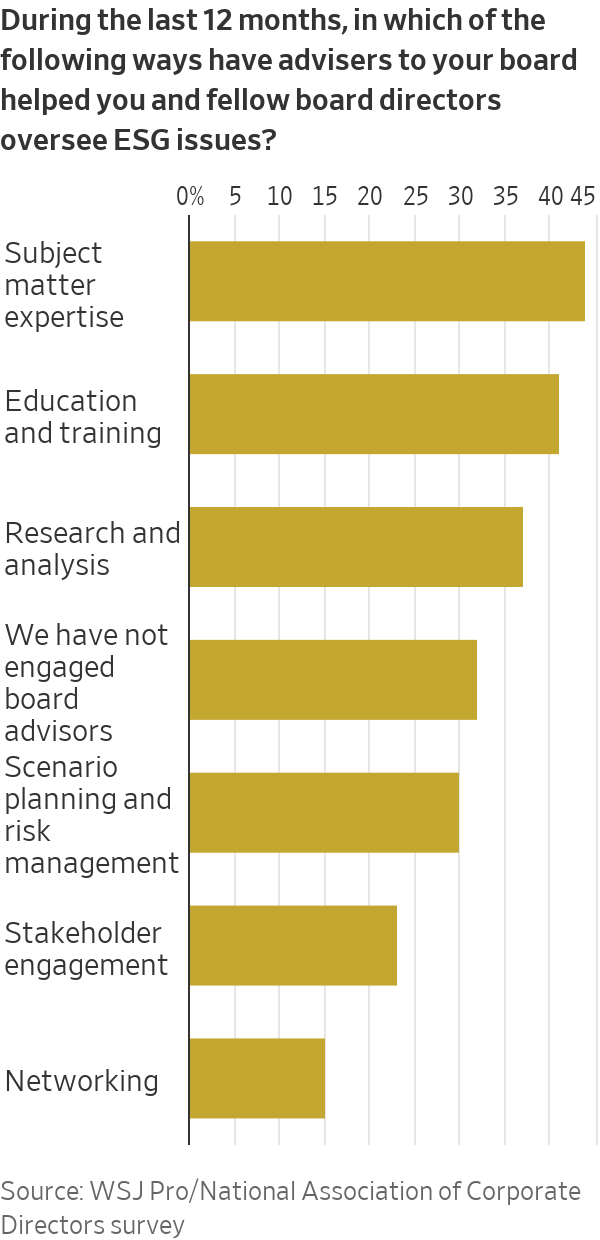
More than two thirds of directors said their organisations brought in external advisers to complement or build board’s ESG skills, with most advisers providing subject matter expertise (44%), education and training (41%), or research and analysis (37%).
“What we know about ESG will change today and will probably change tomorrow,” Hilton’s Campbell said. “It’s the job of an external adviser to know what’s going to happen next week and next year, which is useful in keeping the board ahead of the game.”
Stakeholder engagement
Overall, investors were the most influential stakeholders on board decisions related to ESG strategy, followed by company executives, regulators and customers. For public companies investors were most influential, followed by regulators, while directors of private businesses ranked their customers as top with investors in second place.
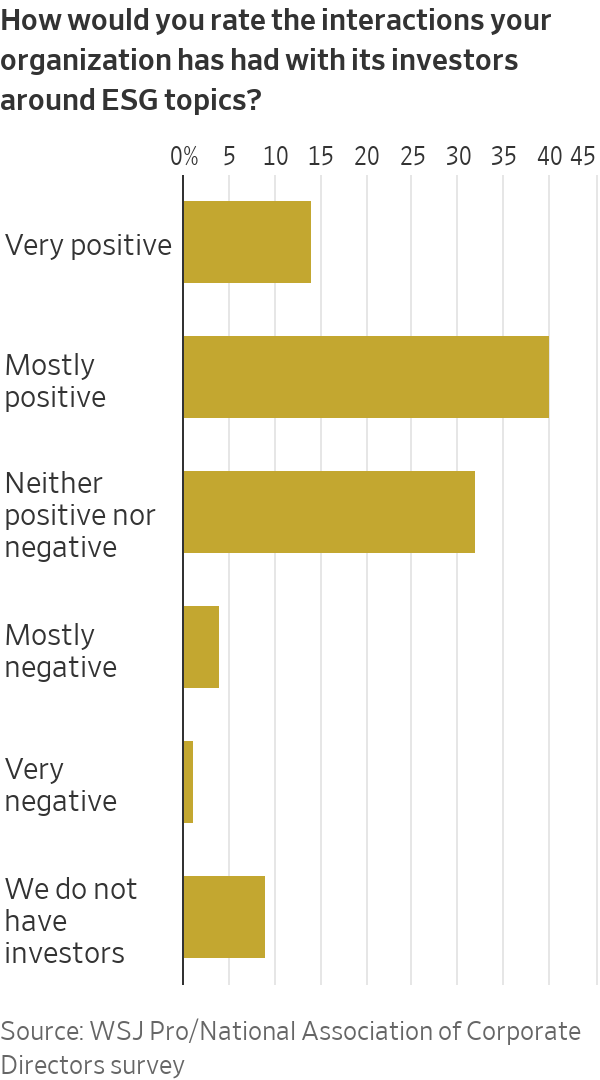
Respondents ranked their ESG-related interactions with investors as largely positive or neutral. Seventy-one percent of directors of organisations with investors said their largest ones had engaged with the board over the past 12 months on ESG topics.
However, public and private businesses approached this engagement quite differently. Private company investors most often engaged with the full board or directly with management, whereas public company investors worked most often with individual directors or sometimes with the full board, but rarely with management.
Anti-ESG impact
The survey also examined the impact of the rising anti-ESG movement in the U.S. Many boards started their ESG journey in 2020, but, particularly in the last six to 12 months, the extent of the political backlash in the U.S. has made it more complicated, said Smith. “You had a wind that was giving companies and boards energy, and now you have a countervailing wind of political backlash,” Smith said.
As the pressure has mounted, there have been numerous reports of green-hushing—when a company scales back what it says about its climate and social initiatives in corporate communications. The survey found evidence to support this: 7% of directors said their company no longer publicly communicates about its ESG activities, and 14% said their board and management no longer use the term ESG when referring to relevant activities.
Respondents report substantive changes too. One in five said their companies are reassessing their approach to ESG, 12% said they have deprioritised ESG as a critical business issue, and 15% of directors, primarily in smaller private businesses, believe ESG is negatively affecting their business decisions and strategy.
Despite those changes, half of respondents believe ESG will continue to be an important driver of their business decisions and strategy. Nearly as many say their board and management remain committed to ESG as an opportunity for growth and a driver of long-term risk reduction.
Driving ESG performance
While most respondents said ESG is critical knowledge for directors, only 37% of their organisations have set a climate-impact reduction target, although that was 54% for large organisations. Nine out of 10 of those companies with a target said their boards monitored their progress toward those goals and four out of five believed they were achievable.
To encourage management to hit targets, over one quarter of respondents said their company had linked executive pay to ESG goals, and a further 29% were considering doing so in the next 12 months.
“If we’re going to be more serious about ESG and building it into a company’s long-term strategy then I think it needs to be tied to executive compensation like any other [key performance indicator],” Campbell said.
Nearly a fifth of directors surveyed said reducing the impact of climate change is a priority regardless of financial performance. Almost half said it is a priority but not at the cost of financial performance, while the remaining third said it isn’t a priority at all.
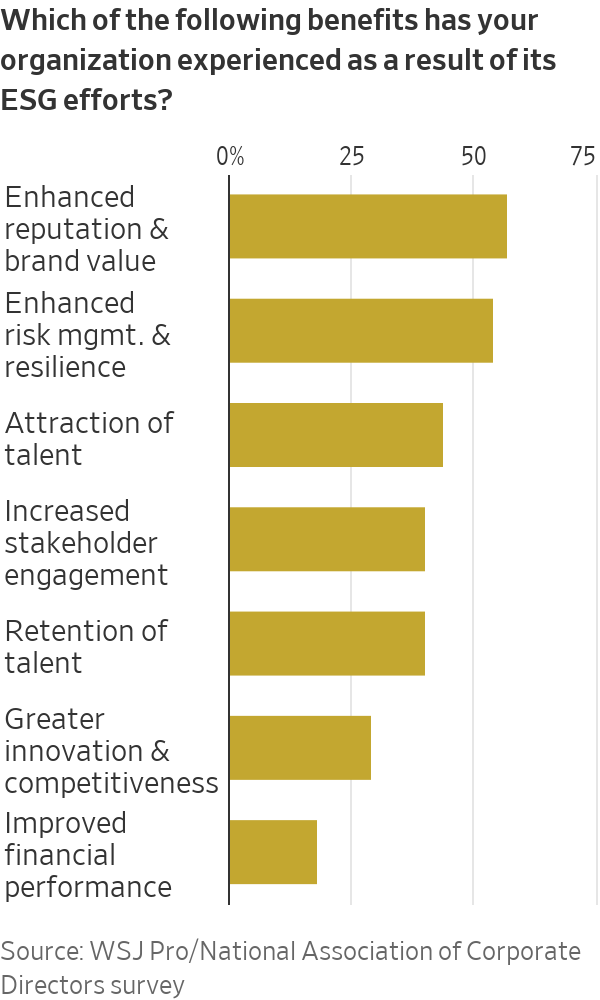
Many directors report real benefits from their ESG efforts. In particular it has enhanced their company’s reputation and brand value (57%), risk management and resilience (54%), and ability to attract and retain talent (44% and 40%, respectively).
Climate change was talked about more frequently in 43% of the boardrooms, while in 31% it actually decreased. The topic was discussed at most or every board meeting for 29% of respondents, 36% said it came up at some meetings, and 23% said it was rarely talked about. Only 11%—primarily small, private companies—hadn’t discussed it at all.
Smith said it was particularly important for smaller companies to keep climate change front of mind: “Those that say they aren’t doing anything yet are paradoxically the ones that may be hit first because they’re downstream of big companies setting more immediate net zero carbon neutral targets.”
As well as calling it a business differentiator for small businesses, Smith said a focus on climate impact reduction was “a survival mechanism.”
 Copyright 2020, Dow Jones & Company, Inc. All Rights Reserved Worldwide. LEARN MORE





From making unpopular decisions to learning when to listen, leaders from five businesses reveal what nobody prepared them for — and how running a company has challenged their expectations.

Technology and semiconductor shares fell sharply as investors questioned the debt financing the AI infrastructure boom and confronted higher rates and Chinese competition.

Technology and semiconductor shares fell sharply as investors questioned the debt financing the AI infrastructure boom and confronted higher rates and Chinese competition.
4 minA sharp technology sell-off has exposed a new anxiety on global markets: whether the enormous borrowing behind the artificial-intelligence infrastructure boom can generate sufficient returns as interest rates rise and Chinese competition intensifies.
The artificial-intelligence investment boom has powered technology shares, semiconductor manufacturers and data-centre operators to extraordinary heights. Last week, investors were given a reminder that much of this expansion is being built with borrowed money.
The technology-heavy Nasdaq Composite fell 4.5 per cent over the week ended October 16, its weakest performance since late June. Semiconductor shares suffered an even deeper correction, with the Philadelphia Semiconductor Index losing about 11.4 per cent.
The selling spread quickly through global markets. Micron Technology fell 14.6 per cent over the week, while South Korea’s Samsung Electronics and SK Hynix dropped approximately 18 per cent and 24 per cent respectively.
This was more than a routine bout of profit-taking. Investors were reassessing three interconnected risks: higher interest rates, the rapidly expanding debt burden attached to AI infrastructure and the prospect of stronger competition from Chinese memory-chip manufacturers.
The debt behind the AI build-out
Artificial intelligence requires a physical infrastructure network of enormous scale. Data centres must be built, advanced processors purchased, power supplies secured and cooling systems installed before customers begin generating meaningful revenue from them.
Technology companies are increasingly supplementing their own cash with corporate bonds, syndicated loans, equipment leases, private credit and project-level financing.
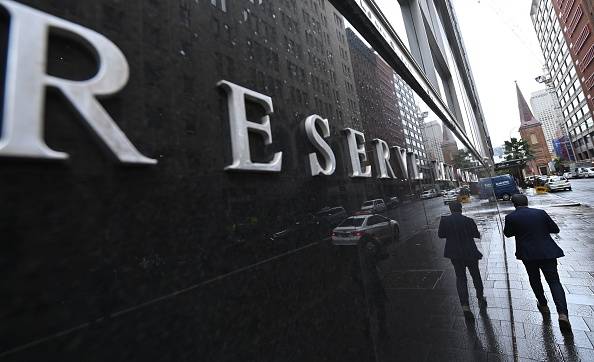
JPMorgan describes the emerging funding model as a combination of conventional corporate borrowing and project finance tied to individual data-centre assets. In Australia, the Reserve Bank estimates that syndicated loans accounted for approximately three-quarters of data-centre financing during 2025 and 2026 to date.
The numbers are becoming large enough to affect broader credit markets. The Federal Reserve Bank of Dallas has cited Wall Street estimates suggesting AI-related investment-grade bond issuance could approach US$300 billion in 2026 alone.
That borrowing is not automatically problematic. Debt can be an efficient way to finance long-lived infrastructure when future revenue is sufficiently predictable. The concern is that AI technology, customer demand and computing economics are changing much faster than the repayment schedules attached to the assets.
A data centre financed today may carry debt for years. Investors must therefore make assumptions about future utilisation rates, electricity prices, chip performance, customer concentration and the amount businesses will ultimately pay for AI computing.
When interest rates rise, those assumptions become less forgiving.
Inflation changes the calculation
September’s US inflation data intensified the pressure. Consumer prices increased 3.7 per cent over the year, ahead of market expectations and up from 3.4 per cent in August.
The hotter reading reduced confidence that interest rates would fall quickly and pushed bond yields higher. That matters particularly for companies whose valuations depend on profits expected well into the future, as well as highly leveraged infrastructure operators that may need to refinance.
CoreWeave has emerged as a closely watched test case. The specialist cloud-computing company has accumulated substantial debt and lease obligations to build AI capacity, while relying on a concentrated group of large technology customers.
Its shares fell sharply during the sell-off, while the cost of insuring its debt against default climbed. CoreWeave has argued that its contracted backlog more than covers its obligations and that financial markets do not always understand its business model. Nevertheless, its securities have become a proxy for investor confidence in debt-funded AI infrastructure.
Oracle, another major investor in AI computing capacity, fell 8.8 per cent in Friday trading, while CoreWeave dropped 15.5 per cent.
The question is shifting from how much AI infrastructure can be built to how profitably it can be operated.
China adds another source of pressure
Interest rates were not the only catalyst. Reports of advances by Chinese memory-chip producer ChangXin Memory Technologies raised concerns that lower-cost Chinese products could increase competition across the global semiconductor industry.
Memory chips are essential to AI systems, but the industry is historically cyclical. Periods of tight supply and high pricing can encourage rapid investment, eventually producing oversupply and falling margins.
The prospect of a well-funded Chinese competitor expanding its technological capabilities unsettled investors in Samsung, SK Hynix and Micron. It also demonstrated that AI-related demand does not insulate chipmakers from conventional competitive pressures.
That combination—slower rate cuts, more expensive financing and potentially cheaper supply—challenged the assumption that every company exposed to AI would enjoy continually expanding margins.
A reset rather than the end of the boom
The sell-off does not establish that the AI boom is ending. Demand for computing power remains strong, the largest technology companies continue to generate formidable cash flows and many infrastructure projects are backed by long-term customer contracts.
What has changed is the market’s willingness to overlook the price and financing structure of that growth.
The most resilient companies are likely to be those able to fund investment from operating cash flow, secure long-duration customers and demonstrate that new capacity will earn returns comfortably above its financing costs.
More speculative operators may face greater scrutiny, particularly where debt is expensive, customers are concentrated or expected revenue depends on demand that has not yet materialised.
For Australian investors, the lesson extends beyond US technology shares. Local data-centre operators, infrastructure funds, electricity suppliers and property groups are increasingly exposed to the same investment cycle.
Artificial intelligence may remain one of the defining growth themes of the decade. But last week’s correction showed that enthusiasm for the technology does not eliminate financial discipline.
The next stage of the AI boom will be judged not only by computing power, model performance or demand for chips, but by something more traditional: whether the assets being financed can generate enough cash to repay the money borrowed to build them.
Fact box
Nasdaq Composite: Down 4.5 per cent for the week ended October 16, 2026
Philadelphia Semiconductor Index: Down approximately 11.4 per cent
Micron Technology: Down approximately 14.6 per cent
Samsung Electronics: Down approximately 18 per cent
SK Hynix: Down approximately 24 per cent
US September inflation: 3.7 per cent annually
Estimated 2026 AI-related investment-grade issuance: Approximately US$300 billion

BNW Developments has established a Sydney presence, joining Arada and Sobha Realty among the growing number of UAE developers pursuing Australian buyers and development opportunities.

A thoughtful timber-led renovation in Byron Bay has reimagined an existing house as a warm, resort-style family sanctuary grounded in natural materials.