Population projections: We’re getting older and having fewer babies
ABS projections for the next 50 years point to migration as the pathway to population growth
 3 min
3 min
Australia’s ageing population is clearly evident in the latest round of population projections just released by the Australian Bureau of Statistics (ABS). The median age in Australia is currently 38.5 years. By 2071, this will increase to between 43.8 years and 47.6 years.
The ABS comments: “Of the changes projected to occur in Australia’s population, ageing is generally considered to be the most dramatic, with significant changes to the age structure of the population. Ageing of the population is a trend which has been evident over recent decades as a result of fertility remaining below replacement level and declining mortality rates.”
The proportion of children aged 0-14 years is projected to decline from 18% in 2022 to between 13% and 16% in 2071. The working age population aged 15-64 years is projected to decrease from 65% to between 59% and 60% in 2071. People aged 65 years and over will increase from 17% in 2022 to between 25% and 27% in 2071.
Overall, our population will swell from 26 million as of 30 June 2022 (and 26.5 million today) to between 34.3 million and 45.9 million by 2071. We’ll see a stronger growth rate of between 1.2% and 1.7% per annum over the next decade, but over the entire projection period, the growth rate will average out to between 0.6% and 1.1% per year.
Australia’s population growth is comprised of natural increase (births minus deaths) and net overseas migration (migrant arrivals minus migrant departures). Migration will play a bigger role in our population growth than natural increase, according to the projections.
In 2021-22, there was a natural increase of 117,400 people in Australia. In 2071, the ABS projects natural increase to range from 104,500 people per year to 118,000 per year. If Australia had no migration at all over the projection period, the population would fall to 23.9 million by 2071. The ABS says Australia’s birth rate has been declining for many decades.The fertility rate peaked in 1961 during the ‘baby boom’ at 3.5 babies per woman. The replacement level is considered to be 2.1 babies, but we haven’t been there since 1975. The current average is 1.64 babies per woman.
Australian women are also having their babies later in life. The ABS comments: “Over the past 10 years, age-specific fertility rates have been declining for the younger age groups (women below age 30), whilst remaining stable among women aged 30 years and over, representing a continuing shift in fertility towards older ages.”
The ABS expects net overseas migration gains of between 9.2 million and 14.1 million people in total over the next 50 years. NSW and Victoria will continue to attract the lion’s share of Australia’s new arrivals. NSW will attract 35.8% and Victoria will bring in 32.8%. NSW will receive between 63,000 and 97,900 migrants (net) per year from 2032, whileVictoria will receive between 57,400 and 90,200.
In terms of net interstate migration, or the movement of Australian residents between states, Queensland is expected to remain the favourite destination. The Sunshine State overtook Victoria in 2016-17 and this trend remains. It was turbocharged during COVID-19 when remote working prompted many people to leave NSW and Victoria. Queensland’s NIM rate more than doubled from 22,600 people in 2018-19 to 48,800 people in 2021-22.
Australians are expected to continue loving big city living. The unique concentration of our population is a factor keeping metro property prices as high as they are today. As of 30 June 2022, 67% of us were choosing to live in one of eight capital cities. This trend will continue, however, Melbourne is projected to overtake Sydney as Australia’s largest city sometime between 2032 and 2046. Its population will grow from just over 5 million in 2022 to between 6.5 million and 9.9 million by 2071.
The states with the highest concentration of capital city residents are currently Perth, Adelaide and Melbourne, and this trend will continue. Perth is currently home to 80% of West Australian residents and this will either remain the case or rise slightly to 81% over the next decade. Adelaide is home to 78% of South Australia’s population and this will rise to between 79% and 80%. Currently, 76% of Victorians choose to live in Melbourne and this will either stay the same or lift to 77% by 2032.
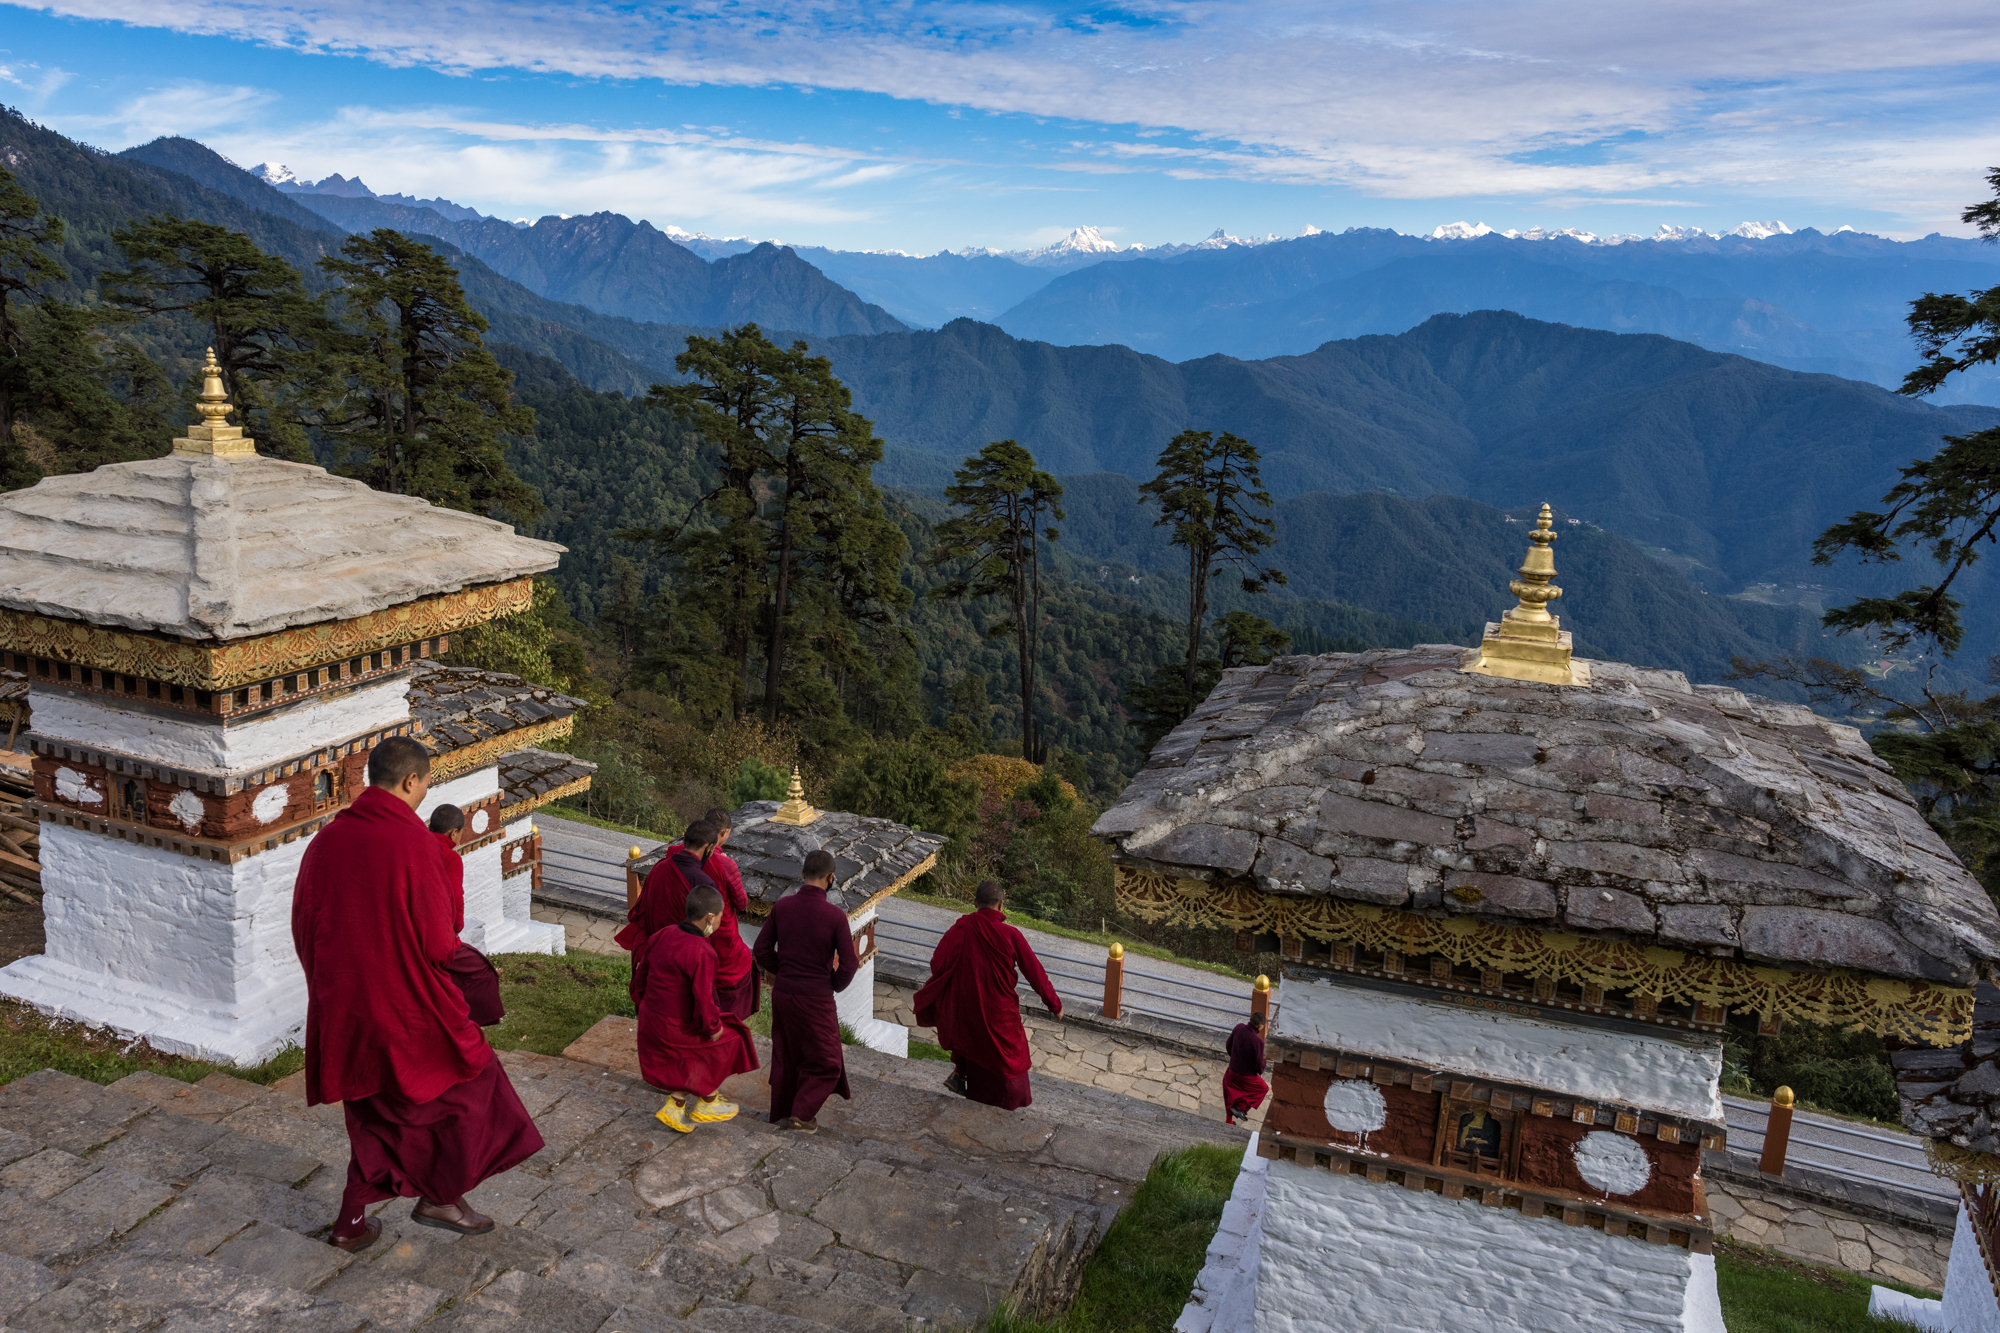
From snow-dusted valleys to festival-filled autumns, Bhutan reveals itself as a rare destination where culture, nature and spirituality unfold year-round.
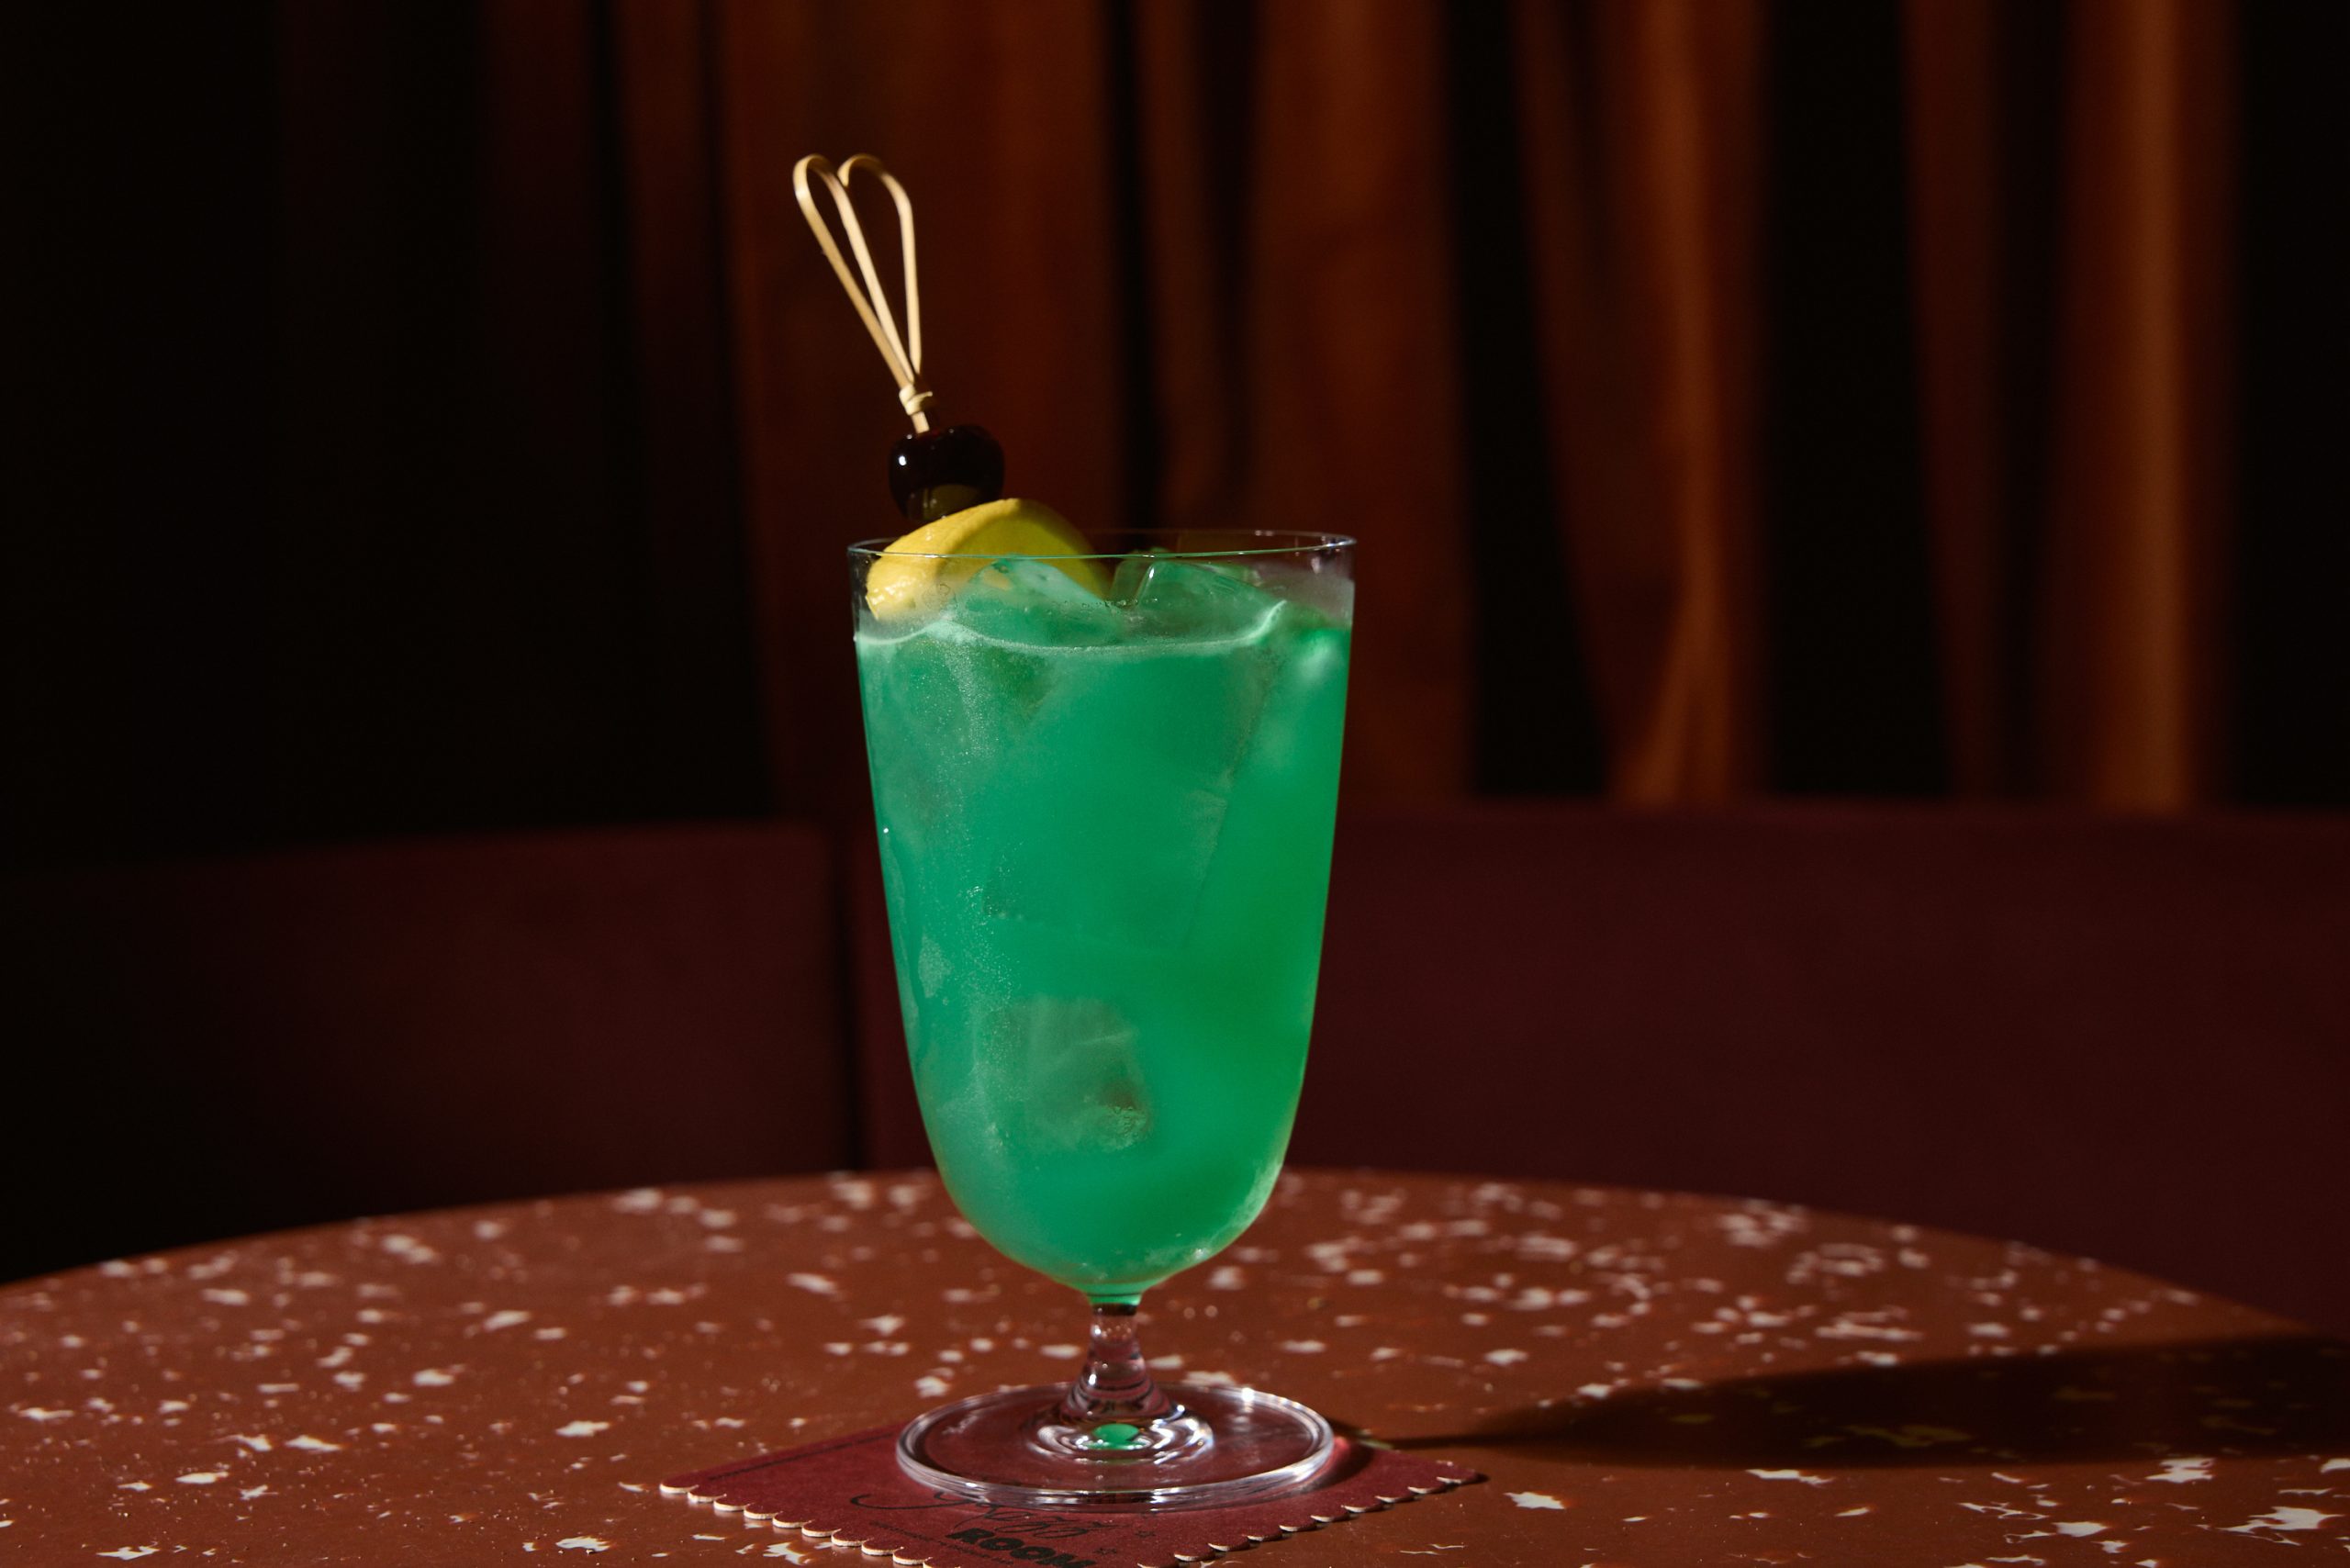
Odd Culture Group brings a new kind of after-dark energy to the CBD, where daiquiris, disco and design collide beneath the city streets.


The lunar flyby would be the deepest humans have traveled in space in decades.
4 min
It’s go time for the highest-stakes mission at NASA in more than 50 years.
On April 1, the agency is set to launch four astronauts around the moon, the deepest human spaceflight since the final Apollo lunar landing in 1972.
The launch window for Artemis II , as the mission is called, opens at 6:24 p.m. ET.
National Aeronautics and Space Administration teams have been preparing the vehicles to depart from Florida’s Kennedy Space Center on the planned roughly 10-day trip. Crew members have trained for years for this moment.
Reid Wiseman, the NASA astronaut serving as mission commander, said he doesn’t fear taking the voyage. A widower, he does worry at times about what he is putting his daughters through.
“I could have a very comfortable life for them,” Wiseman said in an interview last September.
“But I’m also a human, and I see the spirit in their eyes that is burning in my soul too. And so we’ve just got to never stop going.”
Wiseman’s crewmates on Artemis II are NASA’s Victor Glover and Christina Koch, as well as Canadian Space Agency astronaut Jeremy Hansen.

What are the goals for Artemis II?
The biggest one: Safely fly the crew on vehicles that have never carried astronauts before.
The towering Space Launch System rocket has the job of lofting a vehicle called Orion into space and on its way to the moon.
Orion is designed to carry the crew around the moon and back. Myriad systems on the ship—life support, communications, navigation—will be tested with the astronauts on board.
SLS and Orion don’t have much flight experience. The vehicles last flew in 2022, when the agency completed its uncrewed Artemis I mission .
How is the mission expected to unfold?
Artemis II will begin when SLS takes off from a launchpad in Florida with Orion stacked on top of it.
The so-called upper stage of SLS will later separate from the main part of the rocket with Orion attached, and use its engine to set up the latter vehicle for a push to the moon.
After Orion separates from the upper stage, it will conduct what is called a translunar injection—the engine firing that commits Orion to soaring out to the moon. It will fly to the moon over the course of a few days and travel around its far side.
Orion will face a tough return home after speeding through space. As it hits Earth’s atmosphere, Orion will be flying at 25,000 miles an hour and face temperatures of 5,000 degrees as it slows down. The capsule is designed to land under parachutes in the Pacific Ocean, not far from San Diego.

Is it possible Artemis II will be delayed?
Yes.
For safety reasons, the agency won’t launch if certain tough weather conditions roll through the Cape Canaveral, Fla., area. Delays caused by technical problems are possible, too. NASA has other dates identified for the mission if it doesn’t begin April 1.
Who are the astronauts flying on Artemis II?
The crew will be led by Wiseman, a retired Navy pilot who completed military deployments before joining NASA’s astronaut corps. He traveled to the International Space Station in 2014.
Two other astronauts will represent NASA during the mission: Glover, an experienced Navy pilot, and Koch, who began her career as an electrical engineer for the agency and once spent a year at a research station in the South Pole. Both have traveled to the space station before.
Hansen is a military pilot who joined Canada’s astronaut corps in 2009. He will be making his first trip to space.
Koch’s participation in Artemis II will mark the first time a woman has flown beyond orbits near Earth. Glover and Hansen will be the first African-American and non-American astronauts, respectively, to do the same.
What will the astronauts do during the flight?
The astronauts will evaluate how Orion flies, practice emergency procedures and capture images of the far side of the moon for scientific and exploration purposes (they may become the first humans to see parts of the far side of the lunar surface). Health-tracking projects of the astronauts are designed to inform future missions.
Those efforts will play out in Orion’s crew module, which has about two minivans worth of living area.
On board, the astronauts will spend about 30 minutes a day exercising, using a device that allows them to do dead lifts, rowing and more. Sleep will come in eight-hour stretches in hammocks.
There is a custom-made warmer for meals, with beef brisket and veggie quiche on the menu.
Each astronaut is permitted two flavored beverages a day, including coffee. The crew will hold one hourlong shared meal each day.
The Universal Waste Management System—that’s the toilet—uses air flow to pull fluid and solid waste away into containers.
What happens after Artemis II?
Assuming it goes well, NASA will march on to Artemis III, scheduled for next year. During that operation, NASA plans to launch Orion with crew members on board and have the ship practice docking with lunar-lander vehicles that Elon Musk’s SpaceX and Jeff Bezos’ Blue Origin have been developing. The rendezvous operations will occur relatively close to Earth.
NASA hopes that its contractors and the agency itself are ready to attempt one or more lunar landing missions in 2028. Many current and former spaceflight officials are skeptical that timeline is feasible.

As the season turns, Handpicked Wines’ latest Pinot Noir and Chardonnay releases reveal how subtle shifts in place shape what ends up in the glass.

From citrus oils to warming spices, the classic G&T is being reimagined at home as a more thoughtful, seasonal ritual for modern entertaining.