RBA Lifts Rates 0.5% For The Second Month In A Row
Kanebridge News
    HOUSE MEDIAN ASKING PRICES AND WEEKLY CHANGE     Sydney $1,495,064 (-0.25%)       Melbourne $937,672 (-0.06%)       Brisbane $829,077 (+1.01%)       Adelaide $784,986 (+0.98%)       Perth $687,232 (+0.62%)       Hobart $742,247 (+0.62%)       Darwin $658,823 (-0.42%)       Canberra $913,571 (-1.30%)       National $951,937 (-0.08%)                UNIT MEDIAN ASKING PRICES AND WEEKLY CHANGE     Sydney $713,690 (+0.15%)       Melbourne $474,891 (-0.09%)       Brisbane $455,596 (-0.07%)       Adelaide $373,446 (-0.09%)       Perth $378,534 (-0.83%)       Hobart $528,024 (-1.62%)       Darwin $340,851 (-0.88%)       Canberra $481,048 (+0.72%)       National $494,274 (-0.23%)   National $494,274                HOUSES FOR SALE AND WEEKLY CHANGE     Sydney 7,982 (-85)       Melbourne 11,651 (-298)       Brisbane 8,504 (-39)       Adelaide 2,544 (-39)       Perth 7,486 (-186)       Hobart 1,075 (-37)       Darwin 266 (+11)       Canberra 840 (-4)       National 40,348 (-677)                UNITS FOR SALE AND WEEKLY CHANGE     Sydney 7,376 (-100)       Melbourne 6,556 (-154)       Brisbane 1,783 (+12)       Adelaide 447 (+11)       Perth 2,139 (+3)       Hobart 173 (-1)       Darwin 393 (+1)       Canberra 540 (-29)       National 19,407 (-257)                HOUSE MEDIAN ASKING RENTS AND WEEKLY CHANGE     Sydney $750 ($0)       Melbourne $550 ($0)       Brisbane $650 ($0)       Adelaide $550 ($0)       Perth $595 ($0)       Hobart $550 ($0)       Darwin $720 (+$40)       Canberra $675 ($0)       National $639 (+$6)                    UNIT MEDIAN ASKING RENTS AND WEEKLY CHANGE     Sydney $750 ($0)       Melbourne $550 ($0)       Brisbane $550 ($0)       Adelaide $430 ($0)       Perth $550 ($0)       Hobart $450 ($0)       Darwin $483 (-$38)       Canberra $550 ($0)       National $555 (-$4)                HOUSES FOR RENT AND WEEKLY CHANGE     Sydney 5,759 (+74)       Melbourne 5,228 (-159)       Brisbane 2,940 (-7)       Adelaide 1,162 (-13)       Perth 1,879 (-7)       Hobart 468 (-15)       Darwin 81 (+6)       Canberra 707 (+10)       National 18,224 (-111)                UNITS FOR RENT AND WEEKLY CHANGE     Sydney 8,359 (+95)       Melbourne 5,185 (+60)       Brisbane 1,588 (-3)       Adelaide 335 (-30)       Perth 752 (+11)       Hobart 161 (-1)       Darwin 107 (-16)       Canberra 627 (-36)       National 17,114 (+80)   National 17,114                HOUSE ANNUAL GROSS YIELDS AND TREND       Sydney 2.61% (↑)      Melbourne 3.05% (↑)      Brisbane 4.08% (↑)        Adelaide 3.64% (↓)       Perth 4.50% (↓)     Hobart 3.85% (↑)        Darwin 5.68% (↓)     Canberra 3.84% (↑)      National 3.49% (↑)             UNIT ANNUAL GROSS YIELDS AND TREND       Sydney 5.46% (↑)      Melbourne 6.02% (↑)      Brisbane 6.28% (↑)        Adelaide 5.99% (↓)     Perth 7.56% (↑)        Hobart 4.43% (↓)       Darwin 7.36% (↓)     Canberra 5.95% (↑)        National 5.84% (↓)            HOUSE RENTAL VACANCY RATES AND TREND       Sydney 1.6% (↑)      Melbourne 1.8% (↑)      Brisbane 0.5% (↑)      Adelaide 0.5% (↑)      Perth 1.0% (↑)      Hobart 0.9% (↑)      Darwin 1.1% (↑)      Canberra 0.5% (↑)      National 1.2% (↑)             UNIT RENTAL VACANCY RATES AND TREND       Sydney 2.3% (↑)      Melbourne 2.8% (↑)      Brisbane 1.2% (↑)      Adelaide 0.7% (↑)      Perth 1.3% (↑)      Hobart 1.4% (↑)      Darwin 1.3% (↑)      Canberra 1.3% (↑)      National 2.1% (↑)             AVERAGE DAYS TO SELL HOUSES AND TREND       Sydney 30.9 (↑)      Melbourne 32.6 (↑)      Brisbane 37.7 (↑)      Adelaide 28.7 (↑)      Perth 40.1 (↑)      Hobart 37.6 (↑)        Darwin 36.1 (↓)     Canberra 33.0 (↑)      National 34.6 (↑)             AVERAGE DAYS TO SELL UNITS AND TREND       Sydney 32.5 (↑)      Melbourne 31.7 (↑)      Brisbane 35.2 (↑)      Adelaide 30.2 (↑)        Perth 42.8 (↓)     Hobart 36.9 (↑)        Darwin 39.6 (↓)     Canberra 36.7 (↑)      National 35.7 (↑)            
Share Button

RBA Lifts Rates 0.5% For The Second Month In A Row

Taming rising inflation is set to put further strain on household budgets.

By Kanebridge News
Tue, Jul 5, 2022 2:54pmGrey Clock < 1 min

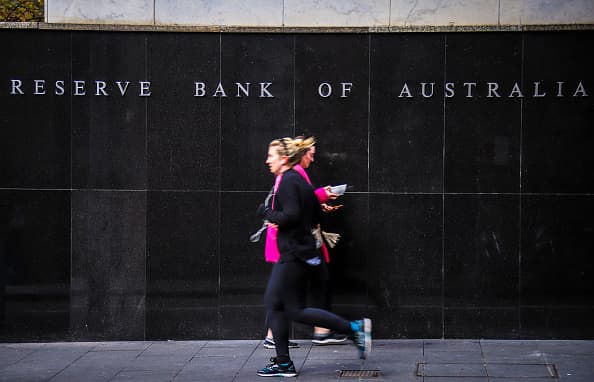
At its meeting today, the Reserve Bank of Australia decided to increase the cash rate target by 50 basis points to 1.35%.

Monetary policy globally is responding to this higher inflation with it predicted to be some time yet before it returns to target in most countries. Further, inflation is high in Australia too, with a tight labour market and capacity constraints in some sectors contributing to upward pressure on prices.

Inflation locally is forecast to peak later this year and then decline back towards the 2-3% range next year. Higher interest rates will also help establish a more sustainable balance between the demand for and the supply of goods and services.

According to Dr Philip Lowe, Governor of Monetary Policy at the RBA, the behaviour of household spending is of concern stating:

“The recent spending data have been positive, although household budgets are under pressure from higher prices and higher interest rates. Housing prices have also declined in some markets over recent months after the large increases of recent years.”

As for what’s ahead for the Australian economy and homeowners.

“The size and timing of future interest rate increases will be guided by the incoming data and the Board’s assessment of the outlook for inflation and the labour market,” said Lowe in the statement.

“The Board is committed to doing what is necessary to ensure that inflation in Australia returns to target over time.”


MOST POPULAR

Chris Dixon, a partner who led the charge, says he has a ‘very long-term horizon’

Americans now think they need at least $1.25 million for retirement, a 20% increase from a year ago, according to a survey by Northwestern Mutual

Related Stories
Money
Investments in Solar Power Eclipse Oil for First Time
By WILL HORNER 01/06/2023
Money
China’s Fading Recovery Reveals Deeper Economic Struggles
By STELLA YIFAN XIE 31/05/2023
Money
Germany Enters Recession in Blow to Europe’s Economy
By PAUL HANNON 30/05/2023
Investments in Solar Power Eclipse Oil for First Time

Government spending, including Biden’s Inflation Reduction Act, has helped drive a gap between clean-energy spending and fossil-fuel investments

By WILL HORNER
Thu, Jun 1, 2023 3 min

Investments in solar power are on course to overtake spending on oil production for the first time, the foremost example of a widening gap between renewable-energy funding and stagnating fossil-fuel industries, according to the head of the International Energy Agency.

More than $1 billion a day is expected to be invested in solar power this year, which is higher than total spending expected for new upstream oil projects, the IEA said in its annual World Energy Investment report.

Spending on so-called clean-energy projects—which includes renewable energy, electric vehicles, low-carbon hydrogen and battery storage, among other things—is rising at a “striking” rate and vastly outpacing spending on traditional fossil fuels, Fatih Birol, the IEA’s executive director said in an interview. The figures should raise hopes that worldwide efforts to keep global warming within manageable levels are heading in the right direction, he said.

Birol pointed to a “powerful alignment of major factors,” driving clean-energy spending higher, while spending on oil and other fossil fuels remains subdued. This includes mushrooming government spending aimed at driving adherence to global climate targets such as President Biden’s Inflation Reduction Act.

“A new clean global energy economy is emerging,” Birol told The Wall Street Journal. “There has been a substantial increase in a short period of time—I would consider this to be a dramatic shift.”

A total of $2.8 trillion will be invested in global energy supplies this year, of which $1.7 trillion, or more than 60% will go toward clean-energy projects. The figure marks a sharp increase from previous years and highlights the growing divergence between clean-energy spending and traditional fossil-fuel industries such as oil, gas and coal. For every $1 spent on fossil-fuel energy this year, $1.70 will be invested into clean-energy technologies compared with five years ago when the spending between the two was broadly equal, the IEA said.

While investments in clean energy have been strong, they haven’t been evenly split. Ninety percent of the growth in clean-energy spending occurs in the developed world and China, the IEA said. Developing nations have been slower to embrace renewable-energy sources, put off by the high upfront price tag of emerging technologies and a shortage of affordable financing. They are often financially unable to dole out large sums on subsidies and state backing, as the U.S., European Union and China have done.

The Covid-19 pandemic appears to have marked a turning point for global energy spending, the IEA’s data shows. The powerful economic rebound that followed the end of lockdown measures across most of the globe helped prompt the divergence between spending on clean energy and fossil fuels.

The energy crisis that followed Russia’s invasion of Ukraine last year has further driven the trend. Soaring oil and gas prices after the war began made emerging green-energy technologies comparatively more affordable. While clean-energy technologies have recently been hit by some inflation, their costs remain sharply below their historic levels. The war also heightened attention on energy security, with many Western nations, particularly in Europe, seeking to remove Russian fossil fuels from their economies altogether, often replacing them with renewables.

While clean-energy spending has boomed, spending on fossil fuels has been tepid. Despite earning record profits from soaring oil and gas prices, energy companies have shown a reluctance to invest in new fossil-fuel projects when demand for them appears to be approaching its zenith.

Energy forecasters are split on when demand for fossil fuels will peak, but most have set out a timeline within the first half of the century. The IEA has said peak fossil-fuel demand could come as soon as this decade. The Organization of the Petroleum Exporting Countries, a cartel of the world’s largest oil-producing nations, has said demand for crude oil could peak in developed nations in the mid-2020s, but that demand in the developing world will continue to grow until at least 2045.

Investments in clean energy and fossil fuels were largely neck-and-neck in the years leading up to the pandemic, but have diverged sharply since. While spending on fossil fuels has edged higher over the last three years, it remains lower than pre pandemic levels, the IEA said.

Only large state-owned national oil companies in the Middle East are expected to spend more on oil production this year than in 2022. Almost half of the extra spending will be absorbed by cost inflation, the IEA said. Last year marked the first one where oil-and-gas companies spent more on debt repayments, dividends and share buybacks than they did on capital expenditure.

The lack of spending on fossil fuels raises a question mark around rising prices. Oil markets are already tight and are expected to tighten further as demand grows following the pandemic, with seemingly few sources of new supply to compensate. Higher oil prices could further encourage the shift toward clean-energy sources.

“If there is not enough investment globally to reduce the oil demand growth and there is no investment at the same time [in] upstream oil we may see further volatility in global oil prices,” Birol said.

MOST POPULAR

Chris Dixon, a partner who led the charge, says he has a ‘very long-term horizon’

Americans now think they need at least $1.25 million for retirement, a 20% increase from a year ago, according to a survey by Northwestern Mutual

0
    Your Cart
    Your cart is emptyReturn to Shop