Revealed: The Smart Way Into Commercial Real Estate
Industrial assets offer a simple, low-risk entry into commercial real estate.
 3 min
3 min
Falling interest rates are sparking a rebound in interest in commercial property. However, for many first-time investors, commercial property can feel very intimidating. With commercial property, there are typically numerous different numbers, complex leases, and unfamiliar terminology.
But once you understand what to look for, the pathway into commercial becomes much clearer and far more achievable than most people realise. So, what does a smart entry point into commercial property actually look like?
If there’s one standout option, it’s typically an industrial property with value-add potential.
Why industrial is the right place to start
Among all the commercial sectors, industrial is currently the most stable and accessible. Demand is being driven by the trades, small manufacturers, logistics operators and e-commerce businesses, many of which are growing rapidly and need practical space to operate from.
Unlike retail and office properties, industrial assets are typically simpler to understand. They’re often lower maintenance, easier to lease and more resilient to changes in the economy. This makes them well-suited to first-time investors who want to enter the market with confidence.
The importance of value-add potential
When looking at entry-level opportunities, many investors make the mistake of prioritising presentation. But it’s generally not the flashiest property that delivers the best returns. It’s the one where you can create the most upside.
That might mean buying a property where the current rent is well below market value. When the lease ends, you have the opportunity to negotiate a new lease at a higher rate, instantly increasing the property’s value.
In other cases, it may be a warehouse with a short-term lease in a high-demand area, providing you the opportunity to renegotiate the terms and secure a better return. Even basic improvements like repainting, improving access, or updating signage can make a big difference to tenant demand.
Don’t chase yield for the sake of it
A common trap for first-time commercial buyers is chasing the highest yield on offer. While yield is an important consideration, it shouldn’t be the only one. A high yield can sometimes signal a risky investment, one with a poor location, limited tenant demand, or low capital growth prospects.
Instead, smart investors focus on balance. A net yield of six to seven per cent in a strong, established area with reliable tenants and good fundamentals is often a far better outcome than a nine per cent yield in a declining market.
Yield is only part of the story. A good commercial investment is one where the income is sustainable, the asset has growth potential, and the risk is well-managed.
The risks of starting with retail or office
Retail and office properties can be suitable for experienced investors, but they’re often more complex and carry higher risk, especially for those just starting out. Retail in particular has faced significant changes in recent years, with e-commerce altering the way consumers shop.
Unless the property is in a high-traffic, local strip with essential services like medical, food or personal care, vacancy risk can be high. Office space is still adapting to the post-COVID shift towards remote work, and in many cases, demand has softened. If you’re entering the commercial market for the first time, it’s better to stick to simple, functional industrial assets in proven locations.
Where to look, and why
For first-time investors, some of the best opportunities can be found in outer-metro industrial precincts or larger regional centres.
Suburbs in places like Geelong, Logan, Toowoomba or Altona North offer a compelling combination of affordability, strong tenant demand and relatively low vacancy risk.
These areas often have diverse local economies that don’t rely on a single industry and offer entry points between $600,000 and $1 million, a sweet spot where competition from institutional investors is limited and owner-occupiers are still active.
What a good entry deal looks like
Imagine purchasing an industrial shed for $750,000 with a tenant in place and a current net yield of 6.5 per cent. The lease has about 18 months left, and you know the current rent is around $10,000 below market.
Once the lease expires, you can renegotiate or re-lease at the correct rate, increasing the income and, by extension, the value of the asset.
That’s a textbook example of a good commercial entry point. The property is tenanted, it generates income from day one, and it has a clear path to growing your equity within 12 to 24 months.
Abdullah Nouh is the founder of Mecca Property Group, a boutique buyer’s agency in Melbourne helping Australians build wealth through strategic property investment.

Technology and semiconductor shares fell sharply as investors questioned the debt financing the AI infrastructure boom and confronted higher rates and Chinese competition.
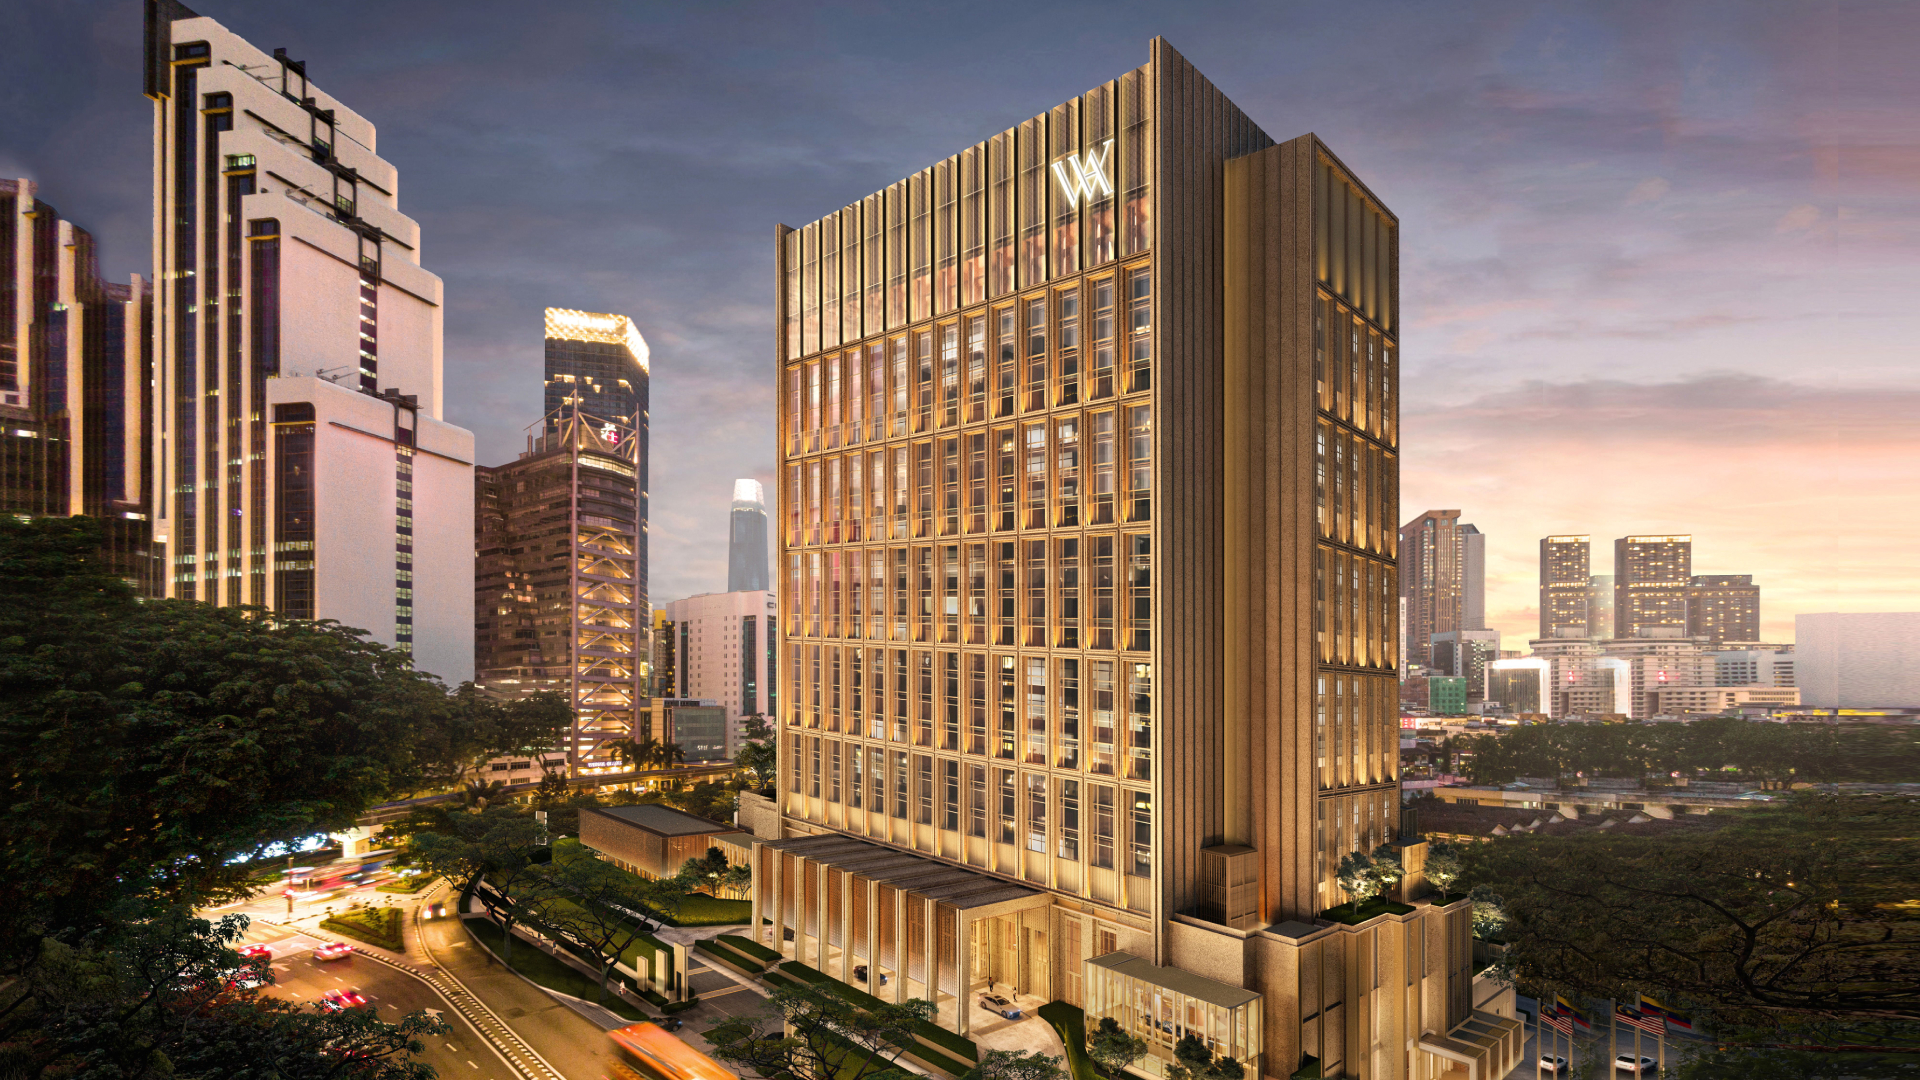
Waldorf Astoria Kuala Lumpur is scheduled to open on 30 October, introducing the Hilton luxury brand to Malaysia with an all-suite hotel in the city’s Golden Triangle.
Technology and semiconductor shares fell sharply as investors questioned the debt financing the AI infrastructure boom and confronted higher rates and Chinese competition.
4 minA sharp technology sell-off has exposed a new anxiety on global markets: whether the enormous borrowing behind the artificial-intelligence infrastructure boom can generate sufficient returns as interest rates rise and Chinese competition intensifies.
The artificial-intelligence investment boom has powered technology shares, semiconductor manufacturers and data-centre operators to extraordinary heights. Last week, investors were given a reminder that much of this expansion is being built with borrowed money.
The technology-heavy Nasdaq Composite fell 4.5 per cent over the week ended October 16, its weakest performance since late June. Semiconductor shares suffered an even deeper correction, with the Philadelphia Semiconductor Index losing about 11.4 per cent.
The selling spread quickly through global markets. Micron Technology fell 14.6 per cent over the week, while South Korea’s Samsung Electronics and SK Hynix dropped approximately 18 per cent and 24 per cent respectively.
This was more than a routine bout of profit-taking. Investors were reassessing three interconnected risks: higher interest rates, the rapidly expanding debt burden attached to AI infrastructure and the prospect of stronger competition from Chinese memory-chip manufacturers.
The debt behind the AI build-out
Artificial intelligence requires a physical infrastructure network of enormous scale. Data centres must be built, advanced processors purchased, power supplies secured and cooling systems installed before customers begin generating meaningful revenue from them.
Technology companies are increasingly supplementing their own cash with corporate bonds, syndicated loans, equipment leases, private credit and project-level financing.
JPMorgan describes the emerging funding model as a combination of conventional corporate borrowing and project finance tied to individual data-centre assets. In Australia, the Reserve Bank estimates that syndicated loans accounted for approximately three-quarters of data-centre financing during 2025 and 2026 to date.
The numbers are becoming large enough to affect broader credit markets. The Federal Reserve Bank of Dallas has cited Wall Street estimates suggesting AI-related investment-grade bond issuance could approach US$300 billion in 2026 alone.
That borrowing is not automatically problematic. Debt can be an efficient way to finance long-lived infrastructure when future revenue is sufficiently predictable. The concern is that AI technology, customer demand and computing economics are changing much faster than the repayment schedules attached to the assets.
A data centre financed today may carry debt for years. Investors must therefore make assumptions about future utilisation rates, electricity prices, chip performance, customer concentration and the amount businesses will ultimately pay for AI computing.
When interest rates rise, those assumptions become less forgiving.
Inflation changes the calculation
September’s US inflation data intensified the pressure. Consumer prices increased 3.7 per cent over the year, ahead of market expectations and up from 3.4 per cent in August.
The hotter reading reduced confidence that interest rates would fall quickly and pushed bond yields higher. That matters particularly for companies whose valuations depend on profits expected well into the future, as well as highly leveraged infrastructure operators that may need to refinance.
CoreWeave has emerged as a closely watched test case. The specialist cloud-computing company has accumulated substantial debt and lease obligations to build AI capacity, while relying on a concentrated group of large technology customers.
Its shares fell sharply during the sell-off, while the cost of insuring its debt against default climbed. CoreWeave has argued that its contracted backlog more than covers its obligations and that financial markets do not always understand its business model. Nevertheless, its securities have become a proxy for investor confidence in debt-funded AI infrastructure.
Oracle, another major investor in AI computing capacity, fell 8.8 per cent in Friday trading, while CoreWeave dropped 15.5 per cent.
The question is shifting from how much AI infrastructure can be built to how profitably it can be operated.
China adds another source of pressure
Interest rates were not the only catalyst. Reports of advances by Chinese memory-chip producer ChangXin Memory Technologies raised concerns that lower-cost Chinese products could increase competition across the global semiconductor industry.
Memory chips are essential to AI systems, but the industry is historically cyclical. Periods of tight supply and high pricing can encourage rapid investment, eventually producing oversupply and falling margins.
The prospect of a well-funded Chinese competitor expanding its technological capabilities unsettled investors in Samsung, SK Hynix and Micron. It also demonstrated that AI-related demand does not insulate chipmakers from conventional competitive pressures.
That combination—slower rate cuts, more expensive financing and potentially cheaper supply—challenged the assumption that every company exposed to AI would enjoy continually expanding margins.
A reset rather than the end of the boom
The sell-off does not establish that the AI boom is ending. Demand for computing power remains strong, the largest technology companies continue to generate formidable cash flows and many infrastructure projects are backed by long-term customer contracts.
What has changed is the market’s willingness to overlook the price and financing structure of that growth.
The most resilient companies are likely to be those able to fund investment from operating cash flow, secure long-duration customers and demonstrate that new capacity will earn returns comfortably above its financing costs.
More speculative operators may face greater scrutiny, particularly where debt is expensive, customers are concentrated or expected revenue depends on demand that has not yet materialised.
For Australian investors, the lesson extends beyond US technology shares. Local data-centre operators, infrastructure funds, electricity suppliers and property groups are increasingly exposed to the same investment cycle.
Artificial intelligence may remain one of the defining growth themes of the decade. But last week’s correction showed that enthusiasm for the technology does not eliminate financial discipline.
The next stage of the AI boom will be judged not only by computing power, model performance or demand for chips, but by something more traditional: whether the assets being financed can generate enough cash to repay the money borrowed to build them.
Fact box
Nasdaq Composite: Down 4.5 per cent for the week ended October 16, 2026
Philadelphia Semiconductor Index: Down approximately 11.4 per cent
Micron Technology: Down approximately 14.6 per cent
Samsung Electronics: Down approximately 18 per cent
SK Hynix: Down approximately 24 per cent
US September inflation: 3.7 per cent annually
Estimated 2026 AI-related investment-grade issuance: Approximately US$300 billion

Exclusive eco-conscious lodges are attracting wealthy travellers seeking immersive experiences that prioritise conservation, community and restraint over excess.

Singapore’s Formula 1 weekend has always looked different. Held beneath floodlights on the Marina Bay Street Circuit, the race transforms the city into a nocturnal spectacle of speed, heat and saturated colour. It is this distinctive atmosphere — and one of Singapore’s most important natural symbols — that has shaped IWC Schaffhausen’s latest motorsport-inspired watch. …
Continue reading “IWC’s purple Formula 1 chronograph pays tribute to Singapore after dark”