Stocks Suffer Worst Day Since June 2020
Annual inflation eased to 8.3% in August but came in higher than economists anticipated

 3 min
3 min
Stocks suffered their worst day in more than two years after hotter-than-expected inflation data dashed investors’ hopes that cooling price pressures would prompt the US Federal Reserve to moderate its campaign of interest-rate increases.
Investors sold everything from stocks and bonds to oil and gold. All 30 stocks in the Dow Jones Industrial Average declined, as did all 11 sectors in the S&P 500. Only five stocks in the broad benchmark finished the session in the green. Facebook parent Meta Platforms dropped 9.4%, BlackRock declined 7.5% and Boeing fell 7.2%.
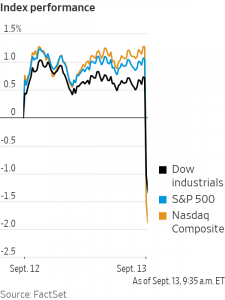
The Dow fell 1276.37 points, or 3.9%, to 31104.97. The S&P 500 declined 177.72 points, or 4.3%, to 3932.69. The Nasdaq Composite slid 632.84 points, or 5.2%, to 11633.57.
All three indexes posted their steepest one-day losses since June 11, 2020. The declines left the Dow industrials down 14% in 2022, while the S&P 500 has lost 17% and the Nasdaq Composite has retreated 26%.
Investors had eagerly anticipated Tuesday’s release of the consumer-price index, which provided a last major look at inflation before the central bank’s interest-rate-setting committee meets next week. Expectations for the path of monetary policy have held sway over the markets as investors factor higher rates into asset prices and try to project how well the economy will hold up as rates rise.
“It increases the probability of recession if the Fed has to move more significantly to address inflation,” said Chris Shipley, chief investment strategist for North America at Northern Trust Asset Management.
The new data showed the consumer-price index rose 8.3% in August from the same month a year ago. That was down from 8.5% in July and 9.1% in June—the highest inflation rate in four decades.
The figures show inflation is easing, but at a slower pace than investors and economists had anticipated. Economists surveyed by The Wall Street Journal had been expecting consumer prices to rise 8% annually in August.
Analysts had hoped that officials would consider easing their pace of interest-rate increases if data continued to show inflation subsiding. The data undercut those hopes, seeming to settle the case for the Fed to raise rates by at least 0.75 percentage point next week. After the release, stock futures fell, bond yields rose and the dollar rallied.
Traders began to consider the possibility that the central bank will raise interest rates by a full percentage point next week.
As of Tuesday afternoon, they assigned a 34% probability to a 1-percentage-point increase at that meeting, up from a 0% chance a day earlier, according to CME Group’s FedWatch Tool.
The market-based probability of a half-percentage-point increase, by contrast, fell to 0% from 9% on Monday, according to the CME data.
The most likely scenario remained an increase of 0.75 percentage point.
Beyond next week, the suggestion that inflation is sticking around raises the possibility that the Fed might ultimately raise rates higher than markets had been anticipating.
“That’s really the challenge,” said Matt Forester, chief investment officer of Lockwood Advisors at BNY Mellon Pershing. “The Fed might have to do a lot more work in order to contain inflation.”
Fed Chairman Jerome Powell said earlier this month that the central bank is squarely focused on bringing down high inflation to prevent it from becoming entrenched as it did in the 1970s.
With Tuesday’s declines, the S&P 500 is up 7.3% from its June low. While investors broadly expect volatility to continue shaking the stock market, some suspect the economy remains strong enough to avert a major leg lower from here.
“We think a lot of the weakness is likely in the price at this stage,” said Holly MacDonald, chief investment officer at Bessemer Trust.
Still, the reaction to the new inflation reading could be seen across asset classes on Tuesday.
The communication services, technology and consumer discretionary sectors of the S&P 500 all fell more than 5%. Semiconductor stocks were particularly hard hit: Nvidia, Advanced Micro Devices and Micron Technology declined more than 7%.
In bond markets, the yield on the benchmark 10-year U.S. Treasury note jumped to 3.422%—near its highest level of 2022—from 3.361% Monday. Meanwhile, the yield on the two-year note, which is more sensitive to near-term rate expectations, settled at 3.754%, the highest since 2007. Yields and prices move in opposite directions. The rise in bond yields was an additional sign that investors were expecting higher interest rates after the data.
Brent crude, the international benchmark for oil prices, fell 0.9% to $93.17 a barrel. Gold prices declined 1.3%.
The U.S. dollar, by contrast, rallied Tuesday. The WSJ Dollar Index, which measures the greenback against a basket of other currencies, rose 1.4% in its largest one-day gain since March 2020. The strong dollar has weighed on the value of other currencies against the greenback this year.
Overseas, the pan-continental Stoxx Europe 600 fell about 1.5%. In Asia, major indexes closed mixed. South Korea’s Kospi Composite rallied 2.7% , while Hong Kong’s Hang Seng declined 0.2%.
 Copyright 2020, Dow Jones & Company, Inc. All Rights Reserved Worldwide. LEARN MORE


This stylish family home combines a classic palette and finishes with a flexible floorplan

Just 55 minutes from Sydney, make this your creative getaway located in the majestic Hawkesbury region.


Continued stagflation and cost of living pressures are causing couples to think twice about starting a family, new data has revealed, with long term impacts expected
2 min
Australia is in the midst of a ‘baby recession’ with preliminary estimates showing the number of births in 2023 fell by more than four percent to the lowest level since 2006, according to KPMG. The consultancy firm says this reflects the impact of cost-of-living pressures on the feasibility of younger Australians starting a family.
KPMG estimates that 289,100 babies were born in 2023. This compares to 300,684 babies in 2022 and 309,996 in 2021, according to the Australian Bureau of Statistics (ABS). KPMG urban economist Terry Rawnsley said weak economic growth often leads to a reduced number of births. In 2023, ABS data shows gross domestic product (GDP) fell to 1.5 percent. Despite the population growing by 2.5 percent in 2023, GDP on a per capita basis went into negative territory, down one percent over the 12 months.
“Birth rates provide insight into long-term population growth as well as the current confidence of Australian families,” said Mr Rawnsley. “We haven’t seen such a sharp drop in births in Australia since the period of economic stagflation in the 1970s, which coincided with the initial widespread adoption of the contraceptive pill.”
Mr Rawnsley said many Australian couples delayed starting a family while the pandemic played out in 2020. The number of births fell from 305,832 in 2019 to 294,369 in 2020. Then in 2021, strong employment and vast amounts of stimulus money, along with high household savings due to lockdowns, gave couples better financial means to have a baby. This led to a rebound in births.
However, the re-opening of the global economy in 2022 led to soaring inflation. By the start of 2023, the Australian consumer price index (CPI) had risen to its highest level since 1990 at 7.8 percent per annum. By that stage, the Reserve Bank had already commenced an aggressive rate-hiking strategy to fight inflation and had raised the cash rate every month between May and December 2022.
Five more rate hikes during 2023 put further pressure on couples with mortgages and put the brakes on family formation. “This combination of the pandemic and rapid economic changes explains the spike and subsequent sharp decline in birth rates we have observed over the past four years,” Mr Rawnsley said.
The impact of high costs of living on couples’ decision to have a baby is highlighted in births data for the capital cities. KPMG estimates there were 60,860 births in Sydney in 2023, down 8.6 percent from 2019. There were 56,270 births in Melbourne, down 7.3 percent. In Perth, there were 25,020 births, down 6 percent, while in Brisbane there were 30,250 births, down 4.3 percent. Canberra was the only capital city where there was no fall in the number of births in 2023 compared to 2019.
“CPI growth in Canberra has been slightly subdued compared to that in other major cities, and the economic outlook has remained strong,” Mr Rawnsley said. “This means families have not been hurting as much as those in other capital cities, and in turn, we’ve seen a stabilisation of births in the ACT.”
This stylish family home combines a classic palette and finishes with a flexible floorplan
Just 55 minutes from Sydney, make this your creative getaway located in the majestic Hawkesbury region.