Tech’s Decade of Stock-Market Dominance Ends, For Now
Sector’s tumble is worst since 2002; value investors take victory lap.
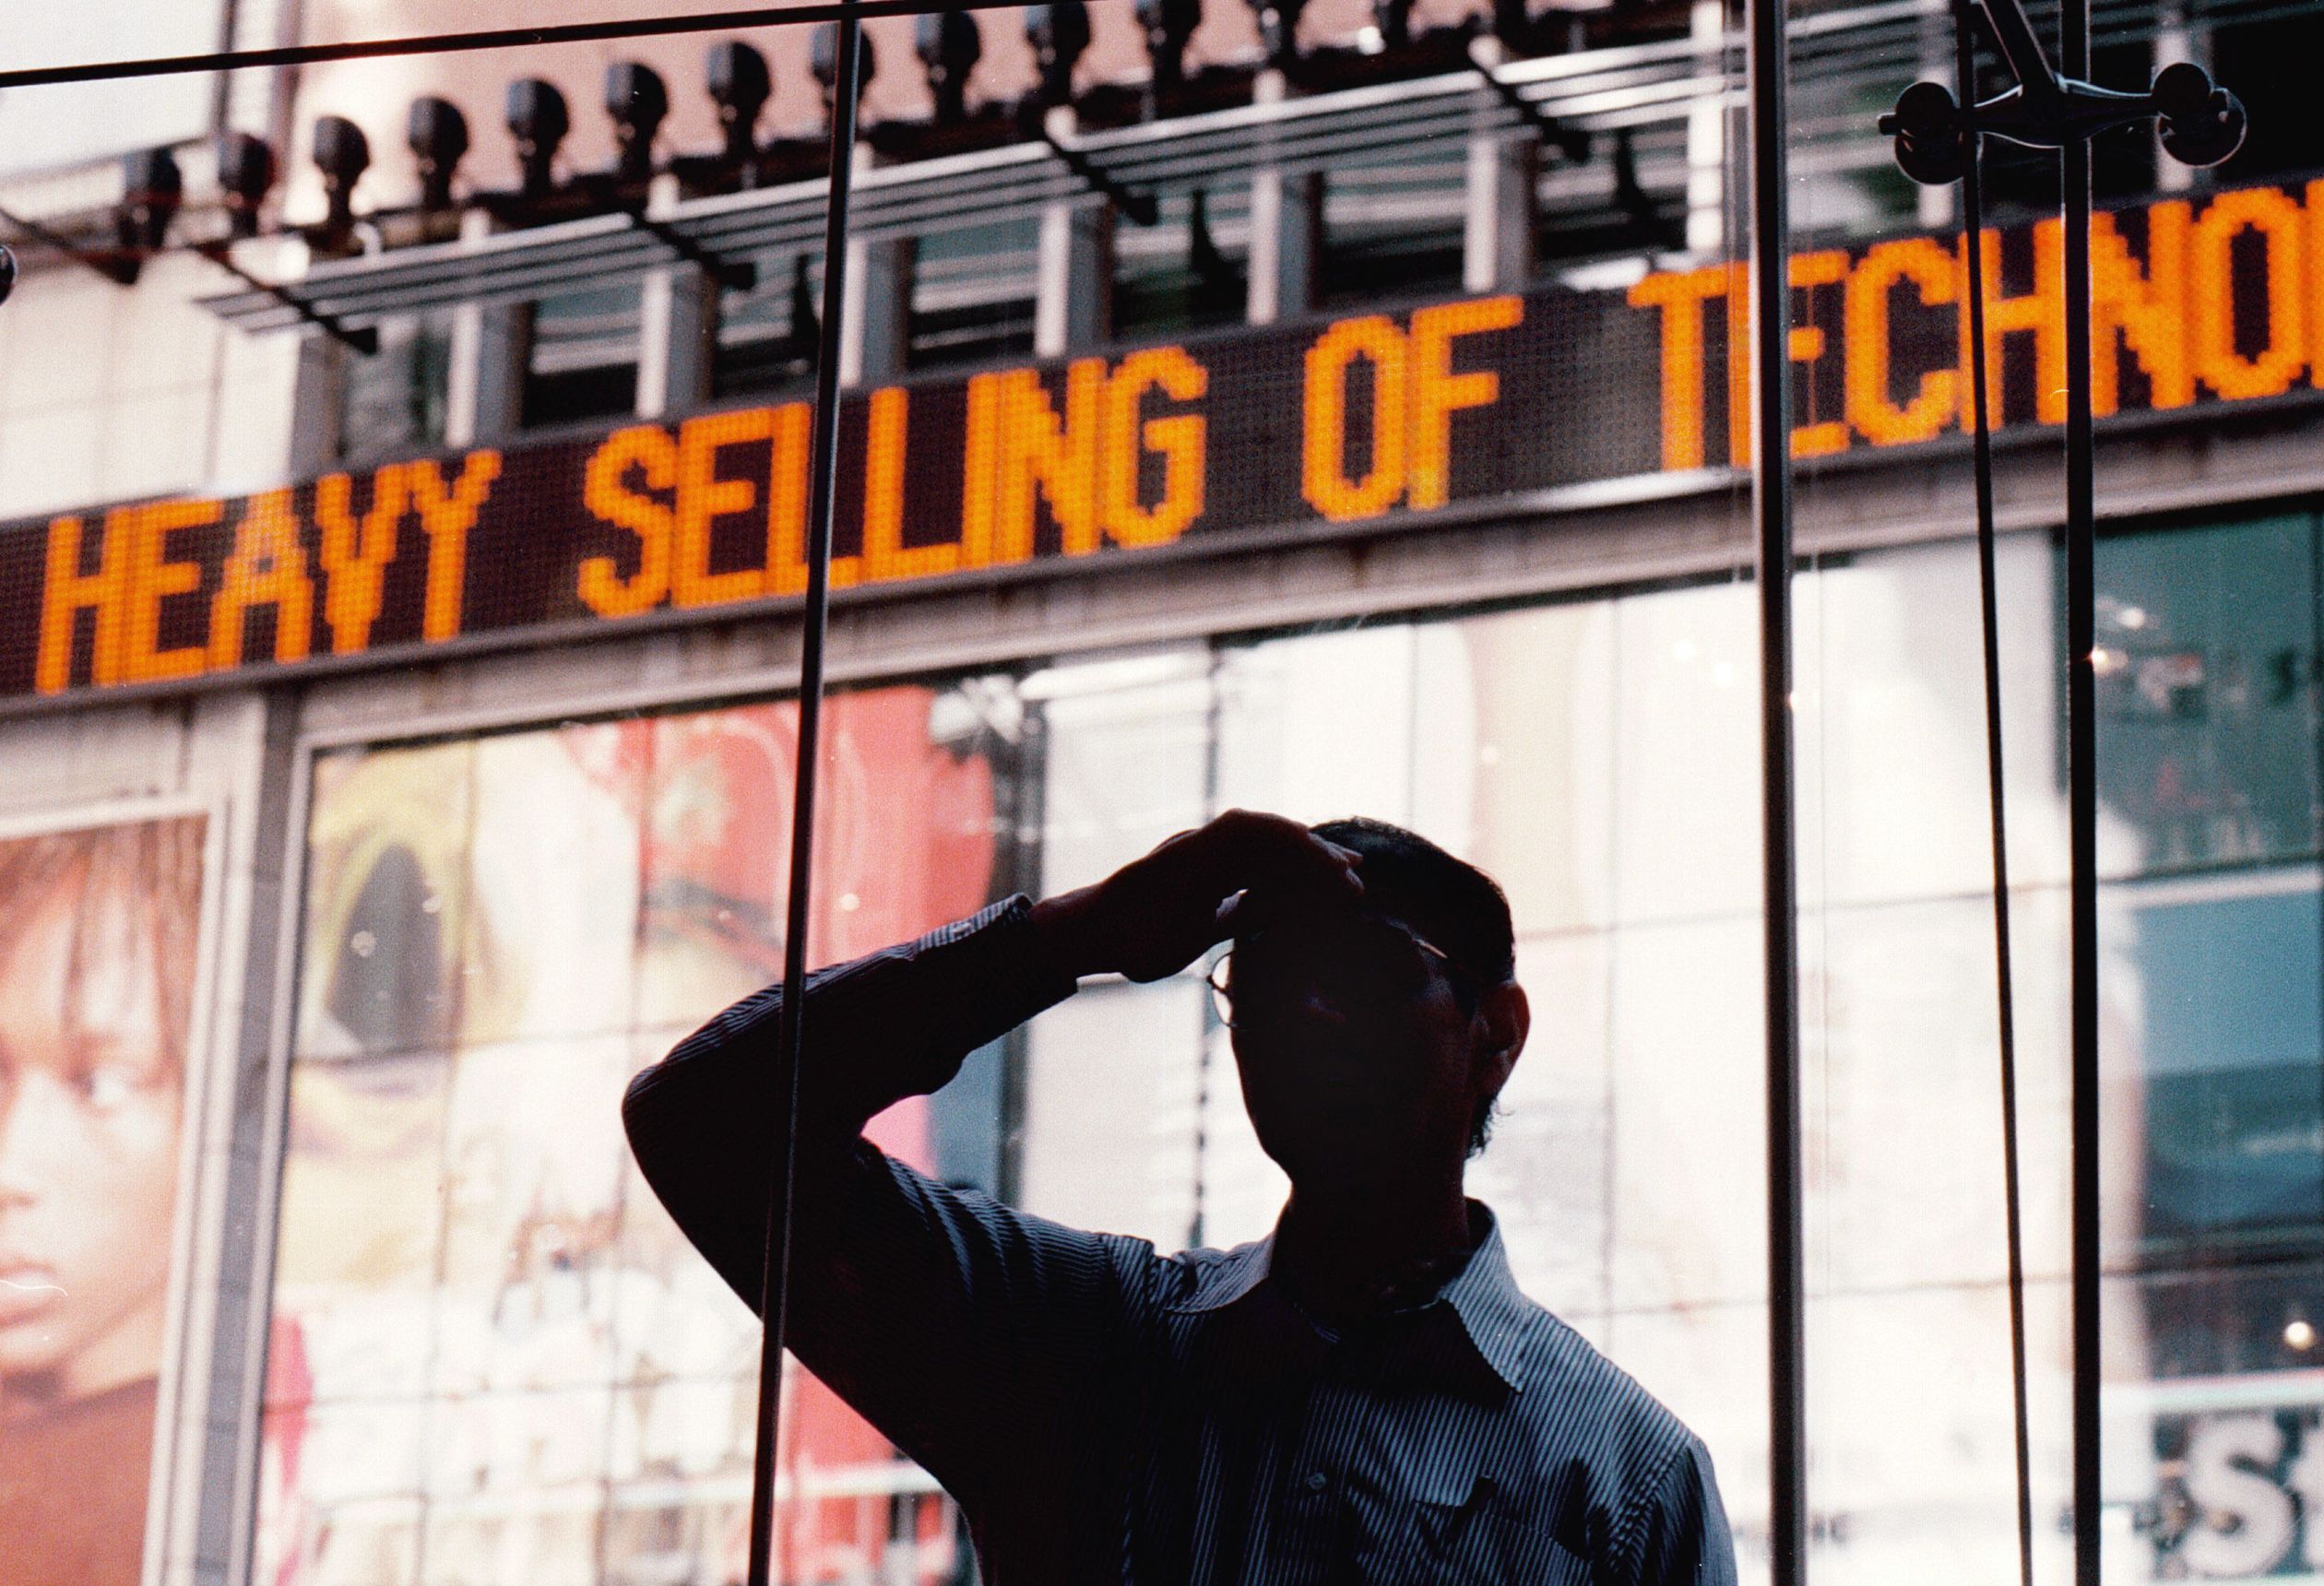
Big technology stocks are in the midst of their biggest rout in more than a decade. Some investors, haunted by the 2000 dot-com bust, are bracing for bigger losses ahead.
The S&P 500’s information-technology sector has dropped 20% in 2022 through Wednesday, its worst start to a year since 2002. Its gap with the broader S&P 500, which is down 14%, is the largest since 2004. The declines have prompted investors to yank a record US$7.6 billion this year from technology-focused mutual and exchange-traded funds through April, according to Morningstar Direct data going back to 1993.
For years, shares of tech companies propelled the stock market higher, pushing major indexes to dozens of records. Excitement for everything from cloud-computing to software and social media drove an epic runup in far-reaching corners of the market. More recently, the Federal Reserve’s accommodative policies at the start of the Covid-19 pandemic fueled a seemingly insatiable appetite for risky bets.
This year, investors are faced with a starkly different environment. Treasury yields have jumped to the highest level since 2018 while bond prices have fallen. Many of the trends that flourished over the past two years—including bullish options trades, special-purpose acquisition companies and cryptocurrencies—have made a sharp U-turn. Only the energy and utilities sectors of the S&P 500 have gained.
Some investors say the decadelong era of tech dominance in markets is coming to an end. Value investors, who buy stocks that are cheap on measures such as earnings or book value, are taking a victory lap after a long-awaited resurgence in shares of companies such as Exxon Mobil Corp., Coca-Cola Co. and Altria Group Inc.
The S&P 500 Value index is outperforming the S&P 500 Growth index—which includes companies such as Tesla Inc., Nvidia Corp. and Meta Platforms Inc.—by 17 percentage points, its widest margin since 2000. Meanwhile, more than US$48 billion has left funds tracking growth stocks, according to data provider EPFR, while investors have poured more than US$13 billion into funds tracking value stocks.
“It is really a change in market regime,” said Chris Covington, head of investments at AJO Vista. “It would be hard for me to believe that you would have the extreme outperformance of growth that you saw in the last five years.”
To many investors, the bets against tech and the monthslong turmoil in the market echo the dot-com bubble of 2000, when the frenzy surrounding companies that later went bust caused losses for investors big and small. Then, the allure of technological innovation combined with low interest rates spurred a rush into Internet stocks. When the bubble burst, the Nasdaq Composite tumbled almost 80% between March 2000 and October 2002.
This year, individual tech stocks have recorded some of their sharpest-ever falls, with hundreds of billions of dollars in market value evaporating—sometimes within hours. In late May, Snap Inc. shares lost 43% in a single session, their largest one-day percentage decline ever and a loss of roughlyUS $16 billion in market value. Once highflying bets such as fintech company Affirm Holdings Inc. and Coinbase Global Inc. have lost more than half of their values in 2022.
The industry’s biggest companies haven’t been spared. Shares of the popular FAANG stocks—Facebook parent Meta Platforms, Amazon.com Inc., Apple Inc., Netflix Inc. and Google parent Alphabet Inc.—have all suffered double-digit percentage declines this year that are steeper than the S&P 500’s.
After the punishing start to the year, many investors are speculating what area of the market will be next to tumble.
“When bubbles break, they don’t just tend to fall to fair value—they have a tendency to go to the other side,” said Ben Inker, co-head of asset allocation at Boston money manager GMO.
Mr. Inker, who has been betting against growth stocks with extended valuations for more than a year, said the extra premium at which growth stocks are trading relative to value stocks is standing above historic levels.
Even after the selloff, technology stocks still make up a near-record 27% of the broad S&P 500, hovering near the highest levels since the dot-com bubble, Bank of America strategists wrote on May 27. The firm cautioned it was too early to buy the dip in many of the stocks.
Of course, some investors point to important differences between the current era and the dot-com bust. Although tech-stock valuations soared in recent years, they haven’t approached the levels seen in March 2000 when forward multiples on the S&P 500 touched 26.2. At their peak in September 2020, the forward price/earnings ratio, based on earnings expectations for the next year, hit 24.08, according to FactSet.
Treasury yields, meanwhile, have risen in recent months, but remain well below historical levels. Today, the 10-year Treasury yield is hovering around 3%. In 2000, it was roughly 5%.
To be sure, it’s early yet in the Fed’s rate-hiking cycle. Investors expect the central bank to keep raising interest rates this year. That means yields will likely keep rising, potentially putting further pressure on tech and other growth stocks. Rising yields make the future cash flows of companies less attractive.
If rates keep rising, “the stock market is going to have to move a good deal lower as well,” Mr. Inker said. “It really does depend on where interest rates are going to wind up.”
Worries about how high and how fast the Fed will raise rates have spurred debate about whether the economy is headed toward a recession, though recent economic data don’t point to one in the near term.
Many investors have been betting against tech stocks or closing out bearish positions. Of the S&P 500’s 11 sectors, tech is on track for the biggest drop in short interest in the second quarter, according to S3 Partners, though it remains the market’s most shorted sector. Traders are still betting heavily against Tesla, Apple, Microsoft Corp. and Amazon, making them among the most shorted stocks, just as they were in each of the previous two years.
Still, some investors and analysts remain confident that tech’s dominance isn’t over just yet.
The ratio of bearish put options to call options on the Technology Select Sector SPDR Fund, or XLK, has been elevated, a contrarian signal that suggests the worst may be over for the sector, according to Jay Kaeppel, an analyst at Sundial Capital Research.
“We discovered that things just don’t go straight up,” said David Eiswert, a portfolio manager at T.Rowe Price. “You can’t just buy a basket of tech stocks. You have to differentiate.” Mr. Eiswert said he thinks some tech stocks, such as Amazon, look attractive after their recent declines and that he may increase his exposure to the group.
Reprinted by permission of The Wall Street Journal, Copyright 2021 Dow Jones & Company. Inc. All Rights Reserved Worldwide. Original date of publication: June 8, 2022.
 Copyright 2020, Dow Jones & Company, Inc. All Rights Reserved Worldwide. LEARN MORE
This stylish family home combines a classic palette and finishes with a flexible floorplan
Just 55 minutes from Sydney, make this your creative getaway located in the majestic Hawkesbury region.
Continued stagflation and cost of living pressures are causing couples to think twice about starting a family, new data has revealed, with long term impacts expected
Australia is in the midst of a ‘baby recession’ with preliminary estimates showing the number of births in 2023 fell by more than four percent to the lowest level since 2006, according to KPMG. The consultancy firm says this reflects the impact of cost-of-living pressures on the feasibility of younger Australians starting a family.
KPMG estimates that 289,100 babies were born in 2023. This compares to 300,684 babies in 2022 and 309,996 in 2021, according to the Australian Bureau of Statistics (ABS). KPMG urban economist Terry Rawnsley said weak economic growth often leads to a reduced number of births. In 2023, ABS data shows gross domestic product (GDP) fell to 1.5 percent. Despite the population growing by 2.5 percent in 2023, GDP on a per capita basis went into negative territory, down one percent over the 12 months.
“Birth rates provide insight into long-term population growth as well as the current confidence of Australian families,” said Mr Rawnsley. “We haven’t seen such a sharp drop in births in Australia since the period of economic stagflation in the 1970s, which coincided with the initial widespread adoption of the contraceptive pill.”
Mr Rawnsley said many Australian couples delayed starting a family while the pandemic played out in 2020. The number of births fell from 305,832 in 2019 to 294,369 in 2020. Then in 2021, strong employment and vast amounts of stimulus money, along with high household savings due to lockdowns, gave couples better financial means to have a baby. This led to a rebound in births.
However, the re-opening of the global economy in 2022 led to soaring inflation. By the start of 2023, the Australian consumer price index (CPI) had risen to its highest level since 1990 at 7.8 percent per annum. By that stage, the Reserve Bank had already commenced an aggressive rate-hiking strategy to fight inflation and had raised the cash rate every month between May and December 2022.
Five more rate hikes during 2023 put further pressure on couples with mortgages and put the brakes on family formation. “This combination of the pandemic and rapid economic changes explains the spike and subsequent sharp decline in birth rates we have observed over the past four years,” Mr Rawnsley said.
The impact of high costs of living on couples’ decision to have a baby is highlighted in births data for the capital cities. KPMG estimates there were 60,860 births in Sydney in 2023, down 8.6 percent from 2019. There were 56,270 births in Melbourne, down 7.3 percent. In Perth, there were 25,020 births, down 6 percent, while in Brisbane there were 30,250 births, down 4.3 percent. Canberra was the only capital city where there was no fall in the number of births in 2023 compared to 2019.
“CPI growth in Canberra has been slightly subdued compared to that in other major cities, and the economic outlook has remained strong,” Mr Rawnsley said. “This means families have not been hurting as much as those in other capital cities, and in turn, we’ve seen a stabilisation of births in the ACT.”
This stylish family home combines a classic palette and finishes with a flexible floorplan
Just 55 minutes from Sydney, make this your creative getaway located in the majestic Hawkesbury region.


