That Style, Again? How Shopping Got So Boring
Manufacturers and retailers leaned on popular goods in the pandemic and often hit pause on innovating

 4 min
4 min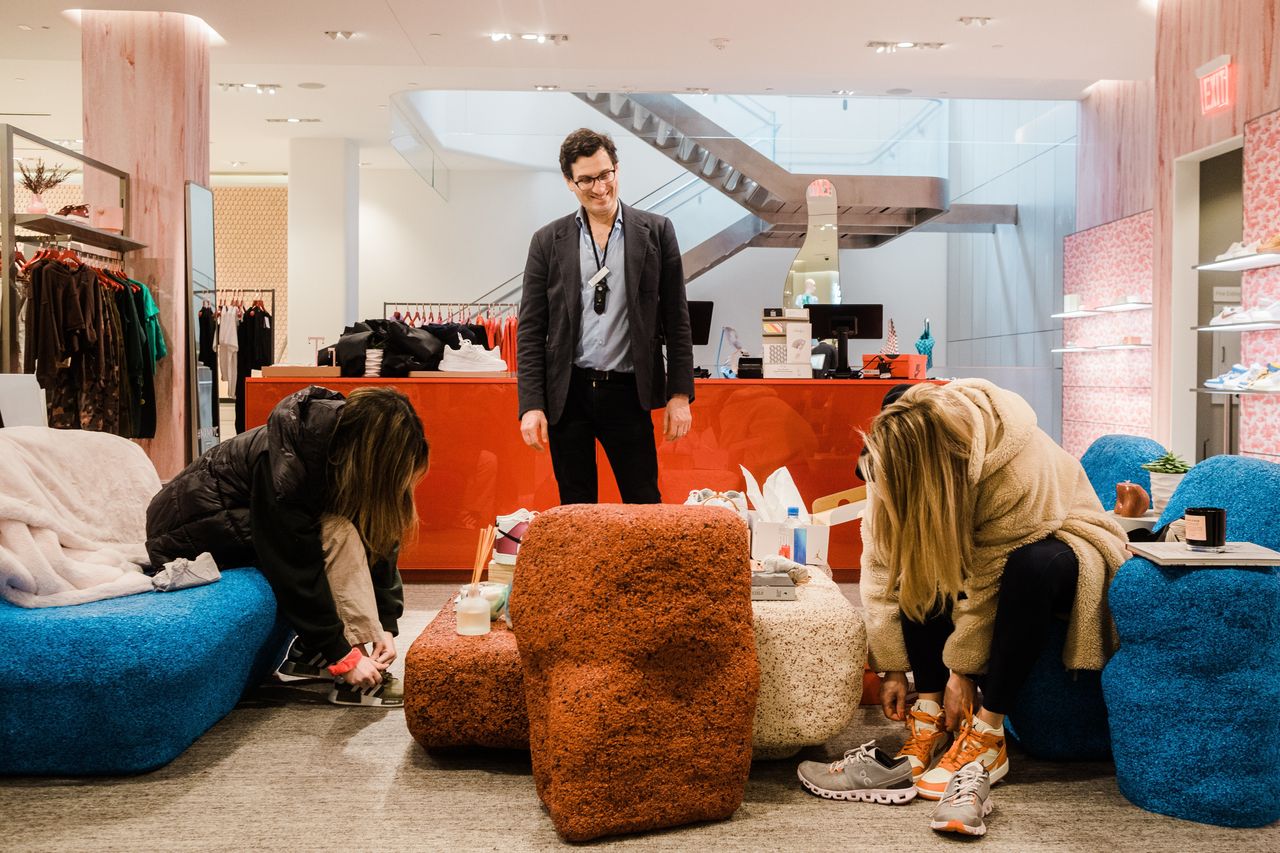
The maker of Tonka trucks and Lite-Brite normally introduces four new toys a year. Last year, Basic Fun Inc. introduced one.
Manufacturers and retailers of everything from computers to dresses hit pause in the past few years when it came to innovation, the result of pandemic-related upheavals in the design, manufacture and distribution of goods, industry executives said. Shifting consumer demand and the expectation of an economic slowdown also played a role, the executives said.
New merchandise gives shoppers a reason to buy. Without it, sales tend to suffer. Retailers including Best Buy Co. and Gap Inc. said a dearth of new products, styles and colours contributed to lacklustre sales during the recent holiday season.
Now, the race is on to ramp up newness, the executives said. But the work that goes into creating new products often takes months, if not years. And some companies are reluctant to invest in the necessary research and development while economic uncertainty looms.
“The last thing you want to do is spend the money to create and market a new product and have it get stuck in the socio-economic crossfire of Covid, supply-chain disruptions and inflation,” said Basic Fun Chief Executive Jay Foreman. “All these things coming together at the same time means that you have to play it safe.”
Mr. Foreman said Basic Fun is delaying plans to relaunch its Littlest Pet Shop collectible figures until spring 2024 from fall of this year. “We anticipate the supply chain getting back to normal by the middle of this year,” he said. “But we’re still concerned about inflation and a slowdown in consumer spending.”
Gap Chairman and interim CEO Bob Martin said in an interview that a pile-up of excess inventory hindered the company’s ability to innovate.
“You stop leveraging creative strengths, you play it safe, and miss the bigger bets to get back on trend,” he said. Now that the company has worked through its excess inventory, he added, it has more room to devote to spring trends like eyelet and crochet tops at Gap, new suiting styles at Banana Republic, and Old Navy dresses with pockets.
There were 13% fewer new general merchandise items in 2022 compared with 2020, according to market-research firm Circana. The biggest declines were in beauty, footwear, technology, small appliances and toy categories.
Marshal Cohen, Circana’s chief industry adviser, said the decline is unprecedented and the result of several converging factors.
The Covid-19 pandemic radically altered consumption patterns, which forced manufacturers and retailers to pivot quickly to keep up with shifting demand. Supply-chain disruptions created first a scarcity of goods, and then a glut. With excess merchandise clogging shelves, retailers were unable to bring in fresh goods. Remote work made collaboration to dream up new ideas more difficult.
“Something as simple as a new flavour, colour or style can create demand,” Mr. Cohen said. “With a decline in newness, we are boring consumers to death.”
When demand for computers, TVs and other electronic gadgets surged, manufacturers focused on producing as much as they could of existing products to address shortages, Jason Bonfig, Best Buy’s chief merchandising officer, said in an interview.
Mr. Bonfig said he is starting to see an improvement in the flow of new products hitting stores, including TVs with larger screens and computers with longer battery life. “Vendors want to get back to growth,” he said. “They know new models are what brings people to our stores.”
Some retailers have acknowledged that the problem rests as much with them as with their suppliers.
“We didn’t have as many choices in women’s tops as we did in the past,” Ed Thomas, CEO of teen-clothing retailer Tilly’s Inc., said in an interview. “Part of that was our problem. We may have been offered styles that we said no to, because we were too gun-shy to take a chance. We had no idea where the economy was going, so we were more conservative in our buying.”
Nordstrom Inc. has set a goal this year of selling through its inventory at a rate 10% faster than last year, to allow it to bring in fresh merchandise more frequently, according to Pete Nordstrom, the department-store chain’s president. “We want our customers to say, ‘Every time I come to Nordstrom there is something new,’” he said.
Retailers said there are more new products hitting stores now that the supply chain is normalising and the excess inventory of past seasons has been cleared out.
But shoppers might not see a big change just yet.
“There is a disconnect between what’s in stores and what’s being shown on the runways and in fashion magazines,” said Lucia Gulbransen, a personal stylist. “You just can’t find the newness and the fashion-forward looks you see on Instagram.”
Some manufacturers said retailers are still too hesitant to pull the trigger on big, unproven bets.
“It’s an all-around risk-averse season,” said David Katz, chief marketing officer of Randa Apparel & Accessories, which makes clothing and accessories for brands ranging from Calvin Klein to Levi Strauss & Co. “There is more pushback than usual on new styles.”
Jackie Ferrari, CEO of clothing manufacturer American Fashion Network LLC, said basics such as T-shirts, tank tops and hoodies now account for about 60% of the assortment at large, mid tier chains, up from the low-50% range in 2019. Rather than adding new silhouettes, retailers are reordering best sellers with new colours and fabrics, she said.
The issue isn’t limited to companies selling consumer goods. Walt Disney Co. CEO Robert Iger recently told investors that the company needed to be careful about which comic-book characters and stories it develops into TV shows and movies from its Marvel Entertainment franchise to ensure “newness.” “Sequels typically work well for us,” Mr. Iger said. “Do you need a third or a fourth, for instance, or is it time to turn to other characters?”
Of course, there are always exceptions. Wide-leg jeans ushered in new clothing styles, including shorter tops and chunkier shoes, and luggage with built-in phone chargers spurred demand for new travel bags. But overall, retailers are still grappling with how to get more newness in front of shoppers, some of the executives said.
Customers are impatient. Robert Smith, a 49-year-old investment manager, said he started searching out smaller, more-unusual clothing brands online after showing up at a networking event wearing the same outfit as another attendee—a black linen shirt and matching shorts that he bought at a big-box chain.
“There isn’t much variety,” said Mr. Smith, who lives in Loves Park, Ill. “If you go to one store, you see the same thing at another store.”
 Copyright 2020, Dow Jones & Company, Inc. All Rights Reserved Worldwide. LEARN MORE


From bushland greens to valley reds, the country’s most awarded designers are proving that the best colour palette was never on a swatch card; it was outside the window all along.

The Australian leather house has opened an immersive four-day pop-up in Manhattan, unveiling its Bloom Collection and redefining what a product launch can look like.


The federal budget has rattled property investors. But the biggest mistake isn’t the tax changes, it’s the conclusion many are drawing from them.
2 min
The recent budget has forced a reckoning for property investors.
Negative gearing now restricted to new residential builds, the CGT discount gone and on paper, the numbers look different.
And many investors are responding by pivoting toward yield, prioritising cash flow over capital growth in a way that property strategists say misses the point entirely.
“The debate has shifted to yield versus growth as if they are opposing forces,” says Abdullah Nouh, founder of Melbourne-based buyers’ agency Mecca Property Group. “But that framing is itself the mistake.”
Nouh, who works with high-net-worth families and investors on long-term acquisition strategy, argues that capital growth remains the primary driver of genuine wealth creation and that the post-budget environment has made quality assets more important, not less.
The numbers make his case plainly. An additional $500 per week in rental income is welcome. A prestige asset appreciating by $1 million over a market cycle is transformative.
These are not equivalent outcomes, and portfolios built around yield at the expense of location and land value tend to generate income while wealth stands largely still.
The more nuanced shift Nouh is seeing among sophisticated investors is a move toward assets where both outcomes can be engineered simultaneously – established homes on substantial land in quality locations, where the existing dwelling can be repositioned, rental returns improved, and the underlying land value compounds independent of what sits on it.
For investors with existing equity, commercial property is also entering the conversation in a more serious way.
Prestige industrial assets, medical centres and long-leased essential retail offer income profiles that residential property in most capital city markets cannot currently match: longer lease terms, tenants covering outgoings, and greater predictability than the residential tenancy cycle.
“The investors who build lasting wealth are rarely the ones who chased yield or growth exclusively,” says Nouh.
“They are the ones who built a strategy they could sustain – one that generated enough income to hold quality assets through multiple cycles while those assets compounded in value.”
The budget has changed the settings. It has not changed the fundamentals.

Odd Culture Group brings a new kind of after-dark energy to the CBD, where daiquiris, disco and design collide beneath the city streets.

Rising rates, construction inflation and shrinking investor confidence are pushing Australia deeper into a dangerous housing spiral that monetary policy alone cannot fix.