The Australian state economy outperforming the rest for the first time in a decade
The top state took first place on three key economic indicators while one east coast state languished near the bottom of the table
 2 min
2 min
For the first time in a decade, Western Australia has the best performing economy in the country, new data has revealed. CommSec’s State of the State report showed the state held the top position this quarter in three of the eight economic indicators — retail spending, relative unemployment and relative population growth.
By contrast, the eastern states languished, with Victoria taking fourth position and NSW in seventh position, just ahead of the Northern Territory economy. The report said persistently high borrowing costs, based on interest rates maintained by the RBA to curb inflation, were having a negative impact on the rate sensitive NSW market.
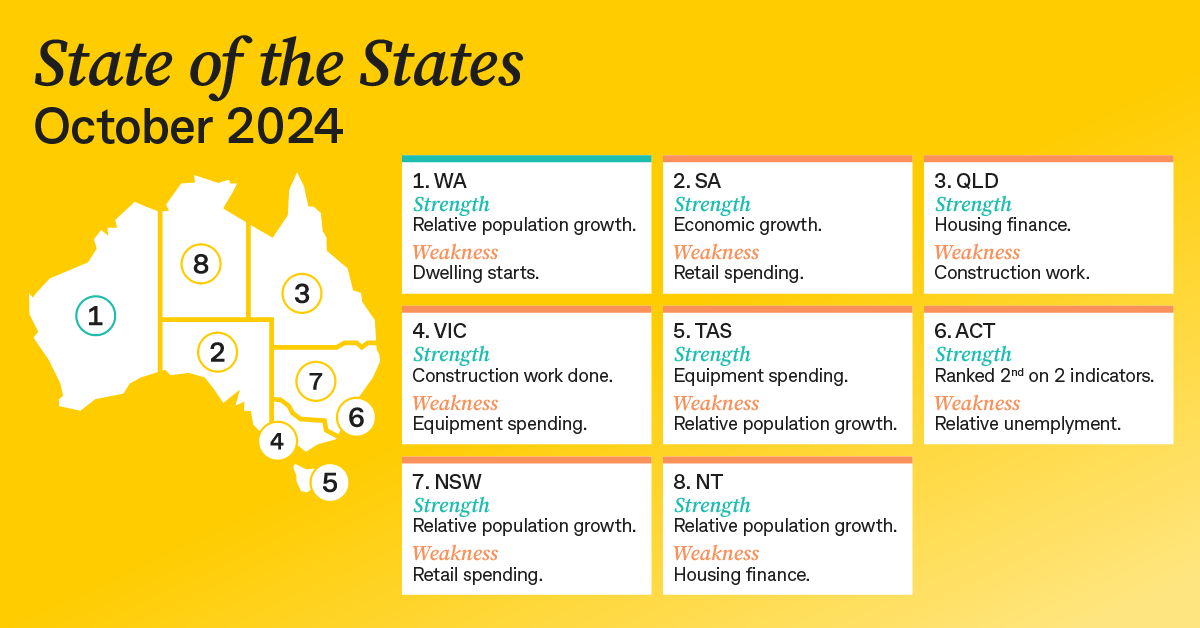
This looks unlikely to change in a hurry with the report also examining annual growth rates across the eight indicators. It found WA has the strongest growth momentum, followed by Queensland, which is fuelled by strong relative unemployment figures and housing finance. The economic outlook for the Northern Territory is also positive given it now sits in second place on three economic indicators.
Western Australia edged out South Australia as the top performing state economy, after two quarters in first position.
Chief CommSec Economist Ryan Felsman said the resilient job market and steady population growth was continuing to underpin all state and territory economies.
“However, an extended period of elevated interest rates to counter persistent inflation is pressuring consumers and slowing economic momentum,” he said. “The path forward will largely depend on the ongoing strength of the labour market, trajectory for monetary policy and China’s economic recovery.”
While WA’s strong performance was based on ‘robust economic fundamentals’, Mr Felsman said the other states and territories were not far behind.
“WA is well positioned for sustained future performance; however, the competition remains intense, particularly among the top three states with Queensland moving quickly up the rankings,” he said.
CommSec is the digital broking arm of the Commonwealth Bank, Australia’s largest mortgage lender. It assesses the performance of each state and territory on a quarterly basis using eight key indicators including economic growth, retail spending, equipment investment, unemployment, construction work done, population growth, housing finance, and dwelling commencements.

Ophora Tallawong has launched its final release of quality apartments priced under $700,000.

From bushland greens to valley reds, the country’s most awarded designers are proving that the best colour palette was never on a swatch card; it was outside the window all along.


The federal budget has rattled property investors. But the biggest mistake isn’t the tax changes, it’s the conclusion many are drawing from them.
2 min
The recent budget has forced a reckoning for property investors.
Negative gearing now restricted to new residential builds, the CGT discount gone and on paper, the numbers look different.
And many investors are responding by pivoting toward yield, prioritising cash flow over capital growth in a way that property strategists say misses the point entirely.
“The debate has shifted to yield versus growth as if they are opposing forces,” says Abdullah Nouh, founder of Melbourne-based buyers’ agency Mecca Property Group. “But that framing is itself the mistake.”
Nouh, who works with high-net-worth families and investors on long-term acquisition strategy, argues that capital growth remains the primary driver of genuine wealth creation and that the post-budget environment has made quality assets more important, not less.
The numbers make his case plainly. An additional $500 per week in rental income is welcome. A prestige asset appreciating by $1 million over a market cycle is transformative.
These are not equivalent outcomes, and portfolios built around yield at the expense of location and land value tend to generate income while wealth stands largely still.
The more nuanced shift Nouh is seeing among sophisticated investors is a move toward assets where both outcomes can be engineered simultaneously – established homes on substantial land in quality locations, where the existing dwelling can be repositioned, rental returns improved, and the underlying land value compounds independent of what sits on it.
For investors with existing equity, commercial property is also entering the conversation in a more serious way.
Prestige industrial assets, medical centres and long-leased essential retail offer income profiles that residential property in most capital city markets cannot currently match: longer lease terms, tenants covering outgoings, and greater predictability than the residential tenancy cycle.
“The investors who build lasting wealth are rarely the ones who chased yield or growth exclusively,” says Nouh.
“They are the ones who built a strategy they could sustain – one that generated enough income to hold quality assets through multiple cycles while those assets compounded in value.”
The budget has changed the settings. It has not changed the fundamentals.

Chinese carmaker GAC will expand its Australian electric vehicle line-up with the city-focused AION UT hatchback.

A thoughtful timber-led renovation in Byron Bay has reimagined an existing house as a warm, resort-style family sanctuary grounded in natural materials.