The Case for Building Wealth With Stocks, Not Homes
Such an escalation of home prices is unlikely to repeat, especially from here after their frantic climb

 2 min
2 min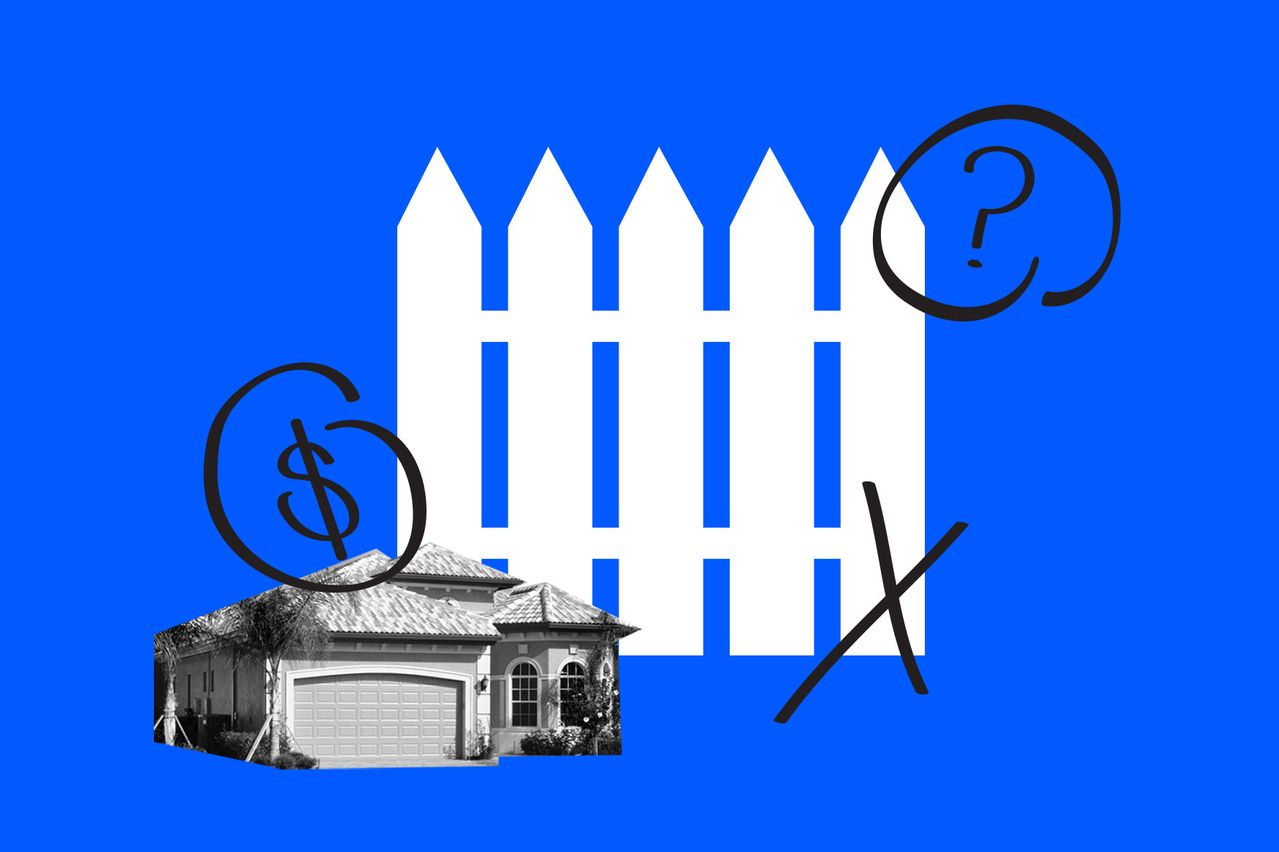
Once upon a time, a young family bought a modest three-bedroom Cape, the worst house in the best location in a prosperous suburb. Many years later, during the housing frenzy of 15 years ago and after the kids had grown and moved away, they received an unsolicited cash bid—for 20 times what they paid. That became their nest egg, which provided a comfortable retirement.
It’s all true, but it might as well be a fairy tale. Such an escalation of home prices is unlikely to repeat, especially from here after their frantic climb. Over the long term, history shows the stock market has returned about twice as much as residential real estate. And it’s done so with far fewer headaches than the attendant expenses of upkeep, which have come as a shock to many recent home buyers.
Looking at the data assembled by NYU Stern School of Business professor Aswath Damodaran, stocks (as measured by the S&P 500) returned 12.47% annually from 1972 to 2021, versus 5.41% for residential housing (based on the Case-Shiller Index, through last October), a span that encompasses inflation’s liftoff after the dollar’s link to gold was severed. Looking at 2012-2021, which takes in the recovery from the housing bust that precipitated the 2007-09 financial crisis, stocks returned an average 16.98%, versus 7.38% for housing.
In a new paper prepared for the Brookings Institution, Robert Shiller, a creator of the housing index, and Anne K. Thompson found 72.4% of respondents in a survey said recent bidding wars had resulted in “panic buying that caused prices to become irrelevant.” That was attributed to the now-familiar story of buyers wanting more room, especially for a home office, in the suburbs. White-collar workers who could work from home were mostly unscathed or benefited from lower spending outlays during the worst of the pandemic.
Historically low mortgage interest rates further leveraged bidders’ buying power. With Freddie Mac’s average 30-year loan down to 3.05% in December, the monthly payment on the median-priced house of $408,100 in the fourth quarter, bought with a 20% down payment, would be US$1,385. With the jump in mortgage rates, to 4.67% as of March 31, that same loan would cost US$1,687 a month. The reduction in affordability is sure to slow home-price appreciation.
Shiller and Thompson found that recent buyers are realistic about near-term home-price trends, expecting some moderation, but may be “given to flights of fancy for the longer run.” Damodaran’s parsing of their data showed buyers at the peak of the previous bubble in 2006 didn’t recover fully from the ensuing bust for 10 years. That wasn’t the first time home buyers were stuck with losses. After the dip from the peak in 1989, prices didn’t recover fully until 1992. And those losing spans didn’t take into account transaction costs, which are huge for residential real estate.
It’s axiomatic that buying high lowers future returns. In human terms, stuff happens, from better job opportunities elsewhere—especially given the ability to work from anywhere for knowledge workers—to unfortunate circumstances such as death and divorce. The ability to pick up stakes with totally portable and liquid financial assets may provide more freedom in the near term, along with greater wealth over the longer span.
Reprinted by permission of Barron’s. Copyright 2021 Dow Jones & Company. Inc. All Rights Reserved Worldwide. Original date of publication: April,
 Copyright 2020, Dow Jones & Company, Inc. All Rights Reserved Worldwide. LEARN MORE


This stylish family home combines a classic palette and finishes with a flexible floorplan

Just 55 minutes from Sydney, make this your creative getaway located in the majestic Hawkesbury region.


Continued stagflation and cost of living pressures are causing couples to think twice about starting a family, new data has revealed, with long term impacts expected
2 min
Australia is in the midst of a ‘baby recession’ with preliminary estimates showing the number of births in 2023 fell by more than four percent to the lowest level since 2006, according to KPMG. The consultancy firm says this reflects the impact of cost-of-living pressures on the feasibility of younger Australians starting a family.
KPMG estimates that 289,100 babies were born in 2023. This compares to 300,684 babies in 2022 and 309,996 in 2021, according to the Australian Bureau of Statistics (ABS). KPMG urban economist Terry Rawnsley said weak economic growth often leads to a reduced number of births. In 2023, ABS data shows gross domestic product (GDP) fell to 1.5 percent. Despite the population growing by 2.5 percent in 2023, GDP on a per capita basis went into negative territory, down one percent over the 12 months.
“Birth rates provide insight into long-term population growth as well as the current confidence of Australian families,” said Mr Rawnsley. “We haven’t seen such a sharp drop in births in Australia since the period of economic stagflation in the 1970s, which coincided with the initial widespread adoption of the contraceptive pill.”
Mr Rawnsley said many Australian couples delayed starting a family while the pandemic played out in 2020. The number of births fell from 305,832 in 2019 to 294,369 in 2020. Then in 2021, strong employment and vast amounts of stimulus money, along with high household savings due to lockdowns, gave couples better financial means to have a baby. This led to a rebound in births.
However, the re-opening of the global economy in 2022 led to soaring inflation. By the start of 2023, the Australian consumer price index (CPI) had risen to its highest level since 1990 at 7.8 percent per annum. By that stage, the Reserve Bank had already commenced an aggressive rate-hiking strategy to fight inflation and had raised the cash rate every month between May and December 2022.
Five more rate hikes during 2023 put further pressure on couples with mortgages and put the brakes on family formation. “This combination of the pandemic and rapid economic changes explains the spike and subsequent sharp decline in birth rates we have observed over the past four years,” Mr Rawnsley said.
The impact of high costs of living on couples’ decision to have a baby is highlighted in births data for the capital cities. KPMG estimates there were 60,860 births in Sydney in 2023, down 8.6 percent from 2019. There were 56,270 births in Melbourne, down 7.3 percent. In Perth, there were 25,020 births, down 6 percent, while in Brisbane there were 30,250 births, down 4.3 percent. Canberra was the only capital city where there was no fall in the number of births in 2023 compared to 2019.
“CPI growth in Canberra has been slightly subdued compared to that in other major cities, and the economic outlook has remained strong,” Mr Rawnsley said. “This means families have not been hurting as much as those in other capital cities, and in turn, we’ve seen a stabilisation of births in the ACT.”
This stylish family home combines a classic palette and finishes with a flexible floorplan
Just 55 minutes from Sydney, make this your creative getaway located in the majestic Hawkesbury region.