The benefits - and costs - of working from home
Kanebridge News
    HOUSE MEDIAN ASKING PRICES AND WEEKLY CHANGE     Sydney $1,603,134 (+0.55%)       elbourne $989,193 (-0.36%)       Brisbane $963,516 (+0.83%)       Adelaide $873,972 (+1.09%)       Perth $833,820 (+0.12%)       Hobart $754,479 (+3.18%)       Darwin $668,319 (-0.54%)       Canberra $993,398 (-1.72%)       National $1,033,710 (+0.29%)                UNIT MEDIAN ASKING PRICES AND WEEKLY CHANGE     Sydney $748,302 (+0.18%)       Melbourne $497,833 (-0.44%)       Brisbane $540,964 (-1.56%)       Adelaide $441,967 (-0.38%)       Perth $442,262 (+1.33%)       Hobart $525,313 (+0.38%)       Darwin $347,105 (-0.72%)       Canberra $496,490 (+0.93%)       National $528,262 (-0.02%)                HOUSES FOR SALE AND WEEKLY CHANGE     Sydney 10,189 (-104)       Melbourne 14,713 (+210)       Brisbane 7,971 (+283)       Adelaide 2,420 (+58)       Perth 6,383 (+298)       Hobart 1,336 (+6)       Darwin 228 (-12)       Canberra 1,029 (+8)       National 44,269 (+747)                UNITS FOR SALE AND WEEKLY CHANGE     Sydney 8,795 (-1)       Melbourne 8,207 (+293)       Brisbane 1,636 (+1)       Adelaide 421 (-4)       Perth 1,664 (+15)       Hobart 204 (-1)       Darwin 404 (-2)       Canberra 988 (+12)       National 22,319 (+313)                HOUSE MEDIAN ASKING RENTS AND WEEKLY CHANGE     Sydney $800 (+$5)       Melbourne $600 ($0)       Brisbane $640 (+$10)       Adelaide $600 ($0)       Perth $660 ($0)       Hobart $550 ($0)       Darwin $700 ($0)       Canberra $690 ($0)       National $663 (+$2)                UNIT MEDIAN ASKING RENTS AND WEEKLY CHANGE     Sydney $750 ($0)       Melbourne $590 (+$10)       Brisbane $630 ($0)       Adelaide $490 (+$10)       Perth $600 ($0)       Hobart $475 (+$23)       Darwin $550 ($0)       Canberra $570 (+$5)       National $593 (+$4)                HOUSES FOR RENT AND WEEKLY CHANGE     Sydney 5,364 (+80)       Melbourne 5,428 (+4)       Brisbane 4,002 (+12)       Adelaide 1,329 (+16)       Perth 2,113 (+91)       Hobart 398 (0)       Darwin 99 (-5)       Canberra 574 (+39)       National 19,307 (+237)                UNITS FOR RENT AND WEEKLY CHANGE     Sydney 7,687 (+257)       Melbourne 4,793 (+88)       Brisbane 2,098 (+33)       Adelaide 354 (-11)       Perth 650 (+5)       Hobart 135 (-1)       Darwin 176 (-9)       Canberra 569 (+14)       National 16,462 (+376)                HOUSE ANNUAL GROSS YIELDS AND TREND       Sydney 2.59% (↑)      Melbourne 3.15% (↑)      Brisbane 3.45% (↑)        Adelaide 3.57% (↓)       Perth 4.12% (↓)       Hobart 3.79% (↓)     Darwin 5.45% (↑)      Canberra 3.61% (↑)      National 3.33% (↑)             UNIT ANNUAL GROSS YIELDS AND TREND         Sydney 5.21% (↓)     Melbourne 6.16% (↑)      Brisbane 6.06% (↑)      Adelaide 5.77% (↑)        Perth 7.05% (↓)     Hobart 4.70% (↑)      Darwin 8.24% (↑)        Canberra 5.97% (↓)     National 5.84% (↑)             HOUSE RENTAL VACANCY RATES AND TREND       Sydney 0.8% (↑)      Melbourne 0.7% (↑)      Brisbane 0.7% (↑)      Adelaide 0.4% (↑)      Perth 0.4% (↑)      Hobart 0.9% (↑)      Darwin 0.8% (↑)      Canberra 1.0% (↑)      National 0.7% (↑)             UNIT RENTAL VACANCY RATES AND TREND       Sydney 0.9% (↑)      Melbourne 1.1% (↑)      Brisbane 1.0% (↑)      Adelaide 0.5% (↑)      Perth 0.5% (↑)        Hobart 1.4% (↓)     Darwin 1.7% (↑)      Canberra 1.4% (↑)      National 1.1% (↑)             AVERAGE DAYS TO SELL HOUSES AND TREND       Sydney 29.7 (↑)      Melbourne 30.9 (↑)      Brisbane 31.2 (↑)      Adelaide 25.1 (↑)      Perth 34.4 (↑)      Hobart 35.8 (↑)      Darwin 35.9 (↑)      Canberra 30.4 (↑)      National 31.7 (↑)             AVERAGE DAYS TO SELL UNITS AND TREND       Sydney 30.0 (↑)      Melbourne 30.5 (↑)      Brisbane 28.8 (↑)        Adelaide 25.2 (↓)       Perth 38.3 (↓)       Hobart 27.8 (↓)     Darwin 45.8 (↑)      Canberra 38.1 (↑)      National 33.1 (↑)            
Share Button

The benefits – and costs – of working from home

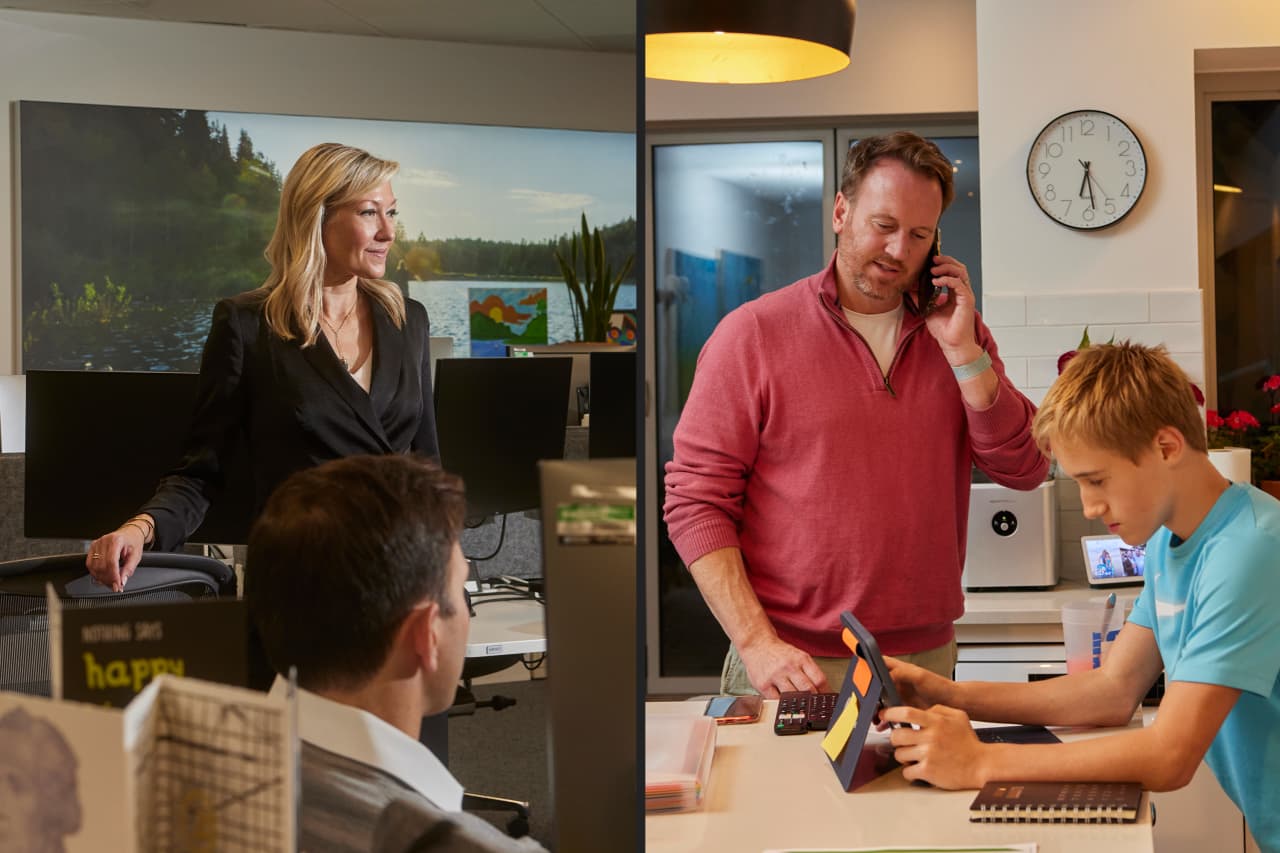
As the hybrid working model embeds itself in Australia, new research reveals the ups and downs of working from home

By KANEBRIDGE NEWS
Thu, Dec 14, 2023 10:03amGrey Clock < 1 min

The number of Australians working from home is falling, as employers encourage staff back to the office. New data from the Australian Bureau of Statistics shows 37 percent of employed people regularly work from home, a 3 percent fall since August 2021. In 2021, NSW and Victoria were subject to a series of lockdowns to contain the spread of COVID-19. Victorians went through six lockdowns during 2020 and 2021 with Sydneysiders restricted to a 5km radius of home from August to October 2021. All but essential workers were directed to work from home. 

As restrictions have lifted, however, many workers have been interested in retaining the option to work from home. The trend has resulted in office vacancy rates of 16.2 percent in Melbourne, 14.4 percent in Sydney, 12.6 percent in Brisbane and 18.5 percent in Perth, according to data service Statista.

In its 2023 Year in review, McCrindle research says cost of living pressures have influenced the desire to work from home, which it estimates to save the average Australian worker $6,359, or 9 percent of after tax savings.

“Three years on after the COVID-19 pandemic, hybrid work formats have become embedded into work culture,” the report noted. 

However, not all aspects of working from home were considered positives, the research found.

“While positioned on flexibility, hybrid workers are feeling the impact of remote work compared to the workplace,” it said. “More than half of Australian workers (59%) suspect that those working in the workplace get better opportunities than those working from home

“Seven in ten (70%) workers believe that working in the workplace leads to a greater sense of recognition and appreciation of their efforts to commute to the workplace.”


MOST POPULAR
11 ACRES ROAD, KELLYVILLE, NSW

This stylish family home combines a classic palette and finishes with a flexible floorplan

35 North Street Windsor

Just 55 minutes from Sydney, make this your creative getaway located in the majestic Hawkesbury region.

Related Stories
Lifestyle
The Uglification of Everything
By Peggy Noonan 26/04/2024
Property
How much income is required to service a mortgage? It depends on where you live
By Bronwyn Allen 25/04/2024
Money
Australian Inflation Stays Strong, Highlighting Challenge Facing RBA
By DAVID WINNING 25/04/2024
How much income is required to service a mortgage? It depends on where you live

New research suggests spending 40 percent of household income on loan repayments is the new normal

By Bronwyn Allen
Thu, Apr 25, 2024 3 min

Requiring more than 30 percent of household income to service a home loan has long been considered the benchmark for ‘housing stress’. Yet research shows it is becoming the new normal. The 2024 ANZ CoreLogic Housing Affordability Report reveals home loans on only 17 percent of homes are ‘serviceable’ if serviceability is limited to 30 percent of the median national household income.

Based on 40 percent of household income, just 37 percent of properties would be serviceable on a mortgage covering 80 percent of the purchase price. ANZ CoreLogic suggest 40 may be the new 30 when it comes to home loan serviceability. “Looking ahead, there is little prospect for the mortgage serviceability indicator to move back into the 30 percent range any time soon,” says the report.

“This is because the cash rate is not expected to be cut until late 2024, and home values have continued to rise, even amid relatively high interest rate settings.” ANZ CoreLogic estimate that home loan rates would have to fall to about 4.7 percent to bring serviceability under 40 percent.

CoreLogic has broken down the actual household income required to service a home loan on a 6.27 percent interest rate for an 80 percent loan based on current median house and unit values in each capital city. As expected, affordability is worst in the most expensive property market, Sydney.

Sydney

Sydney’s median house price is $1,414,229 and the median unit price is $839,344.

Based on 40 percent serviceability, households need a total income of $211,456 to afford a home loan for a house and $125,499 for a unit. The city’s actual median household income is $120,554.

Melbourne

Melbourne’s median house price is $935,049 and the median apartment price is $612,906.

Based on 40 percent serviceability, households need a total income of $139,809 to afford a home loan for a house and $91,642 for a unit. The city’s actual median household income is $110,324.

Brisbane

Brisbane’s median house price is $909,988 and the median unit price is $587,793.

Based on 40 percent serviceability, households need a total income of $136,062 to afford a home loan for a house and $87,887 for a unit. The city’s actual median household income is $107,243.

Adelaide

Adelaide’s median house price is $785,971 and the median apartment price is $504,799.

Based on 40 percent serviceability, households need a total income of $117,519 to afford a home loan for a house and $75,478 for a unit. The city’s actual median household income is $89,806.

Perth

Perth’s median house price is $735,276 and the median unit price is $495,360.

Based on 40 percent serviceability, households need a total income of $109,939 to afford a home loan for a house and $74,066 for a unit. The city’s actual median household income is $108,057.

Hobart

Hobart’s median house price is $692,951 and the median apartment price is $522,258.

Based on 40 percent serviceability, households need a total income of $103,610 to afford a home loan for a house and $78,088 for a unit. The city’s actual median household income is $89,515.

Darwin

Darwin’s median house price is $573,498 and the median unit price is $367,716.

Based on 40 percent serviceability, households need a total income of $85,750 to afford a home loan for a house and $54,981 for a unit. The city’s actual median household income is $126,193.

Canberra

Canberra’s median house price is $964,136 and the median apartment price is $585,057.

Based on 40 percent serviceability, households need a total income of $144,158 to afford a home loan for a house and $87,478 for a unit. The city’s actual median household income is $137,760.


MOST POPULAR
35 North Street Windsor

Just 55 minutes from Sydney, make this your creative getaway located in the majestic Hawkesbury region.

11 ACRES ROAD, KELLYVILLE, NSW

This stylish family home combines a classic palette and finishes with a flexible floorplan

Related Stories
hybrid v electric
Lifestyle
Hybrid v Electric: what you need to know in 2024
By Josh Bozin 25/03/2024
Money
What’s worse than having an affair? Lying about money
By Bronwyn Allen 12/04/2024
Money
Rivian Stock Is Flying After EV Maker Unveils Its R2 and R3 Models
By AI Root 08/03/2024
0
    Your Cart
    Your cart is emptyReturn to Shop