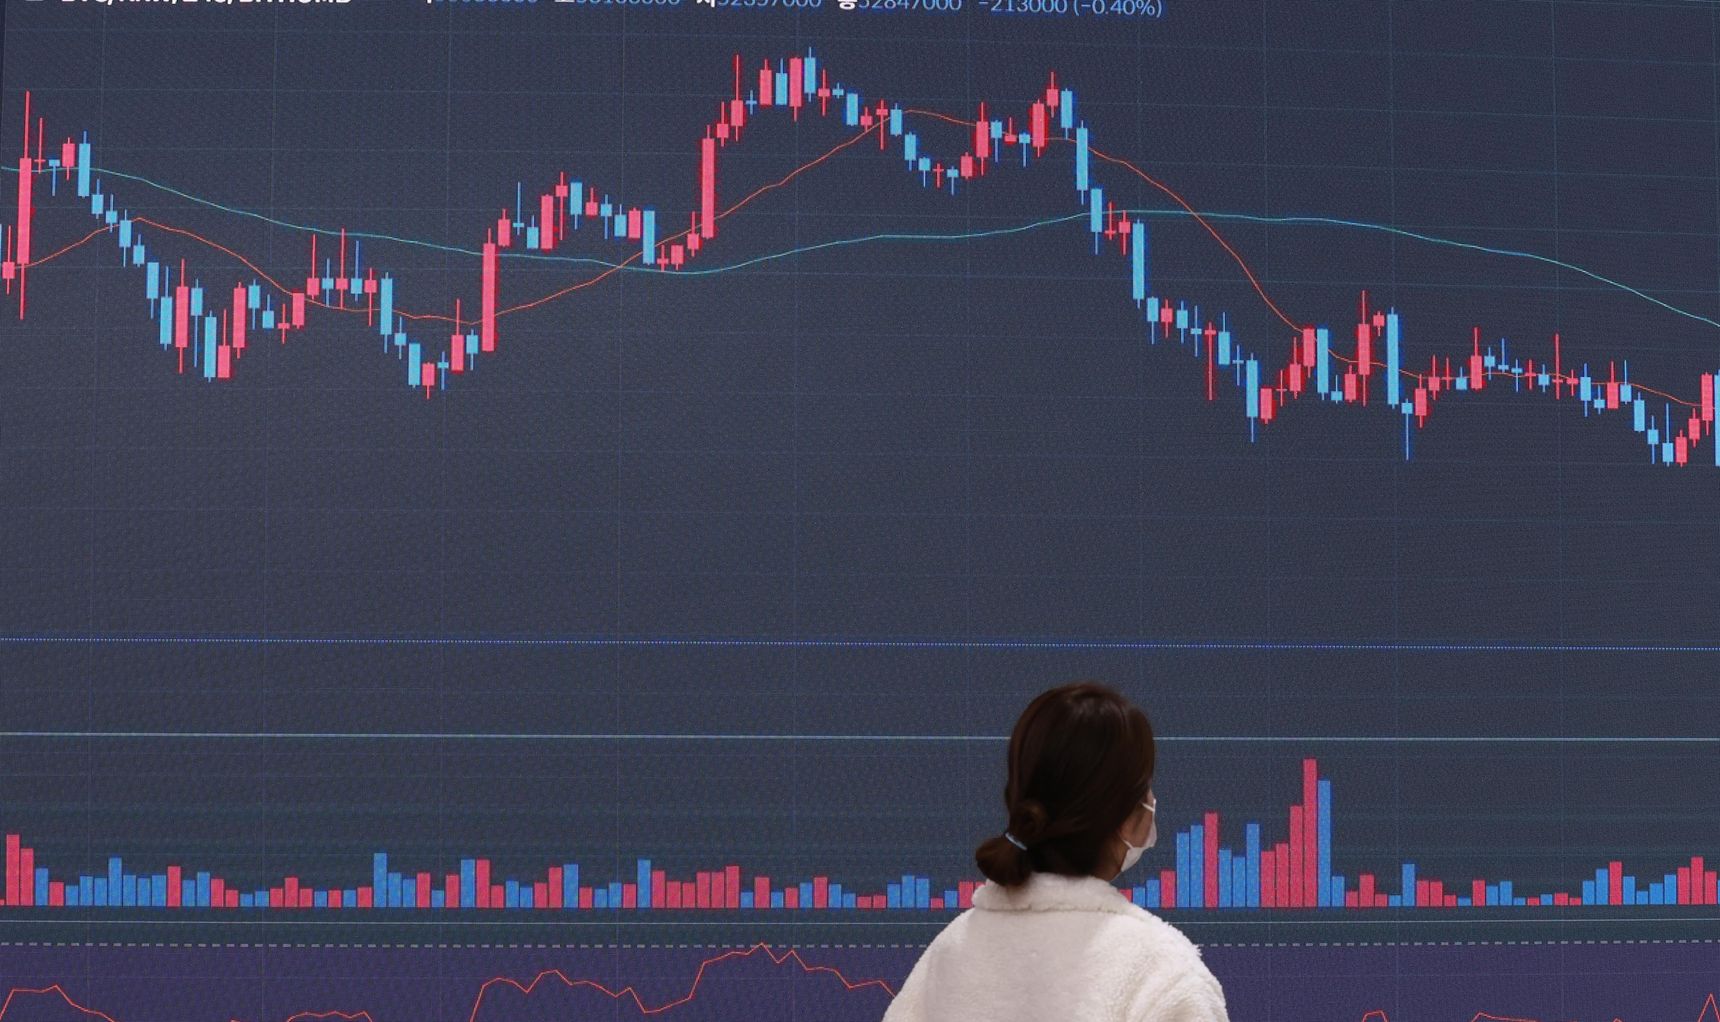
The Fire Burning Beneath Crypto’s Meltdown
The cryptocurrency implosion followed rampant creation of new digital money, something that never ended well in the traditional world.
One of the simplest lessons of stock market history is that innovations often lead to bubbles and busts, from new tulip bulbs through canals and railways to the internet. Less well understood is that financial innovations count for double, as new tools expand the supply of what looks like money, allowing the bubble to grow larger—and the bust to be even more serious.
The cryptocurrency implosion currently underway followed rampant creation of new digital money, something that never ended well in the traditional world either.
The question for crypto enthusiasts is which lesson they should take from history. Are bitcoin and other crypto tokens crashing because of the usual excesses that accompany advances in finance? Or do they have the sort of fundamental flaws that will see them join cowrie shells and Sweden’s 20 kg copper coin as historical relics? I lean toward the latter.
Start with the positive view, such as it is. There was a massive bubble in bitcoin and crypto in general as speculators piled in with the hope of getting rich. It was accentuated by a failure to learn lessons from history, as decentralised finance (defi) reinvented many of the problems of excessive leverage and liquidity mismatches that have bedevilled traditional finance for hundreds of years.
So much, so normal. Pile on too much leverage, use short-term borrowing to finance longer-term lending, and disaster eventually results.
Crypto supporters point to previous “crypto winters” that eventually came good again, and say prices will recover. But this blowout and bust is different, because of defi.
In the booms and busts of the past decade crypto prices were pushed up and fell back down based on the level of interest, rather like Pokémon cards or Beanie Babies.
Defi changed everything, by creating a parallel crypto banking system—without any of the limits or safety nets that have been introduced in the real world in response to past busts. Only now are we starting to find out some of the problems, as brokers and lenders freeze withdrawals, multibillion-dollar “stablecoins” designed to hold a fixed value vanish, and wild leverage leads to widespread forced selling.
At the very minimum this suggests the new crypto winter will be worse than the last few. Defi speeded the bubble’s expansion, and now it is accelerating the deflation.
The irony in all this is that part of the original appeal of crypto was the cap on how many bitcoin can ever exist, something supposed to prevent the sort of unlimited money creation that worries many critics of government-issued, or “fiat,” currencies. Rather than unlimited creation of bitcoin, crypto ended up with unlimited proliferation of new tokens. The new structures of intermediaries and defi tools allowed even bitcoin to be reused or lent on, meaning multiple people thought they owned the same token. Lender Celsius Network is an extreme example: Those who deposited bitcoin and other tokens there were promised high interest rates, but have been unable to get their coins—which Celsius lent out—back.
In the 19th century, the Bank of England discovered that the private spread of bills of exchange could overcome limits on official money-printing set by the backing of gold. Crypto owners are finding something similar, as monetary innovation got round their favourite claim, that the value of their bitcoin was underpinned by its protection from debasement.
The biggest booms and busts in monetary history led to the total destruction of currencies, and that’s already happening to some of the flakier cryptocurrencies.
The hope for crypto is that the speculators who used too much borrowed money are cleared out, the proliferation of tokens is pared back, prices reset lower and the core cryptocurrencies can continue with their grand monetary experiment. Sure, they’re worth less, but survive.
The trouble is that crypto’s problems run deep. Bitcoin started in the hope that it would act as the equivalent of online notes and coins, offering sellers the security of knowing that a transaction couldn’t be reversed, unlike credit and debit cards. It failed to take off as a medium of exchange, as it is clunky and costly to use. Other cryptocurrencies are somewhat more practical for transactions, but all suffer from a core problem: The more they are used, the more expensive transactions become as a way to regulate capacity on the network. Like Uber, Bitcoin has surge pricing built in.
“In a way congestion is a feature, not a bug,” says Hyun Song Shin, economic adviser and head of research at the Bank for International Settlements in Basel. For normal currencies “network effects mean the more the merrier, but crypto achieves exactly the opposite, the more the sorrier.”
The BIS on Tuesday laid out a program for taking the best parts of crypto and using them in digital dollars, pounds or other currencies that could be issued electronically by central banks.
The other trouble with crypto: bitcoin advocates tried to overcome the cryptocurrency’s lack of use as a currency by rebranding it as “digital gold.”
The appeal of gold today is that it acts as a haven in bad times, and typically acts as a partial hedge against inflation. Bitcoin holders have discovered that not only is it not a hedge against inflation, it isn’t a haven either. Its price tends to move in line with risky assets, not safe ones. The gold price is up 4% in the past 12 months as inflation has soared, against a fall of 12% in the S&P 500 and a 43% loss for bitcoin. Digital, sure. Gold, not so much.
None of this means bitcoin or its cousins are definitely doomed. If people keep buying into the story of digital gold despite the evidence, it might thrive. If there’s a new burst of speculative hysteria, its volatility makes it attractive to gamblers. Or its supporters, desperate to find some value in the long strings of numbers they paid so much for, might come up with a new spin to tempt buyers back.
But in the long run, crypto’s best hope of survival is to come up with some useful function in the real world. That will require another round of innovation, and there’s no reason to think it will be the existing cryptocurrencies, let alone bitcoin, that will be the winners.
Reprinted by permission of The Wall Street Journal, Copyright 2021 Dow Jones & Company. Inc. All Rights Reserved Worldwide. Original date of publication: June 22, 2022.
 Copyright 2020, Dow Jones & Company, Inc. All Rights Reserved Worldwide. LEARN MORE
This stylish family home combines a classic palette and finishes with a flexible floorplan
Just 55 minutes from Sydney, make this your creative getaway located in the majestic Hawkesbury region.
Continued stagflation and cost of living pressures are causing couples to think twice about starting a family, new data has revealed, with long term impacts expected
Australia is in the midst of a ‘baby recession’ with preliminary estimates showing the number of births in 2023 fell by more than four percent to the lowest level since 2006, according to KPMG. The consultancy firm says this reflects the impact of cost-of-living pressures on the feasibility of younger Australians starting a family.
KPMG estimates that 289,100 babies were born in 2023. This compares to 300,684 babies in 2022 and 309,996 in 2021, according to the Australian Bureau of Statistics (ABS). KPMG urban economist Terry Rawnsley said weak economic growth often leads to a reduced number of births. In 2023, ABS data shows gross domestic product (GDP) fell to 1.5 percent. Despite the population growing by 2.5 percent in 2023, GDP on a per capita basis went into negative territory, down one percent over the 12 months.
“Birth rates provide insight into long-term population growth as well as the current confidence of Australian families,” said Mr Rawnsley. “We haven’t seen such a sharp drop in births in Australia since the period of economic stagflation in the 1970s, which coincided with the initial widespread adoption of the contraceptive pill.”
Mr Rawnsley said many Australian couples delayed starting a family while the pandemic played out in 2020. The number of births fell from 305,832 in 2019 to 294,369 in 2020. Then in 2021, strong employment and vast amounts of stimulus money, along with high household savings due to lockdowns, gave couples better financial means to have a baby. This led to a rebound in births.
However, the re-opening of the global economy in 2022 led to soaring inflation. By the start of 2023, the Australian consumer price index (CPI) had risen to its highest level since 1990 at 7.8 percent per annum. By that stage, the Reserve Bank had already commenced an aggressive rate-hiking strategy to fight inflation and had raised the cash rate every month between May and December 2022.
Five more rate hikes during 2023 put further pressure on couples with mortgages and put the brakes on family formation. “This combination of the pandemic and rapid economic changes explains the spike and subsequent sharp decline in birth rates we have observed over the past four years,” Mr Rawnsley said.
The impact of high costs of living on couples’ decision to have a baby is highlighted in births data for the capital cities. KPMG estimates there were 60,860 births in Sydney in 2023, down 8.6 percent from 2019. There were 56,270 births in Melbourne, down 7.3 percent. In Perth, there were 25,020 births, down 6 percent, while in Brisbane there were 30,250 births, down 4.3 percent. Canberra was the only capital city where there was no fall in the number of births in 2023 compared to 2019.
“CPI growth in Canberra has been slightly subdued compared to that in other major cities, and the economic outlook has remained strong,” Mr Rawnsley said. “This means families have not been hurting as much as those in other capital cities, and in turn, we’ve seen a stabilisation of births in the ACT.”
This stylish family home combines a classic palette and finishes with a flexible floorplan
Just 55 minutes from Sydney, make this your creative getaway located in the majestic Hawkesbury region.


