The U.S. and IMF Disagree About China. That’s a Problem.
The IMF doesn’t share U.S. view that China’s massive trade surpluses are hurting the world, and that tension is likely to grow

 4 min
4 min
Eighty years ago world leaders meeting in Bretton Woods, N.H., created the International Monetary Fund to prevent the sorts of economic imbalances that had brought on the Great Depression.
Today, imbalances once again threaten global harmony. China’s massive trade surplus is fuelling a backlash. The U.S. attributes those surpluses to China holding down consumption while subsidising manufacturing and exports, inflicting collateral damage on its trading partners. And it would like the IMF to say so.
The IMF, though, has steered a more neutral path. It has prodded Beijing to change its economic model while playing down any harm from that model for the world.
Decades ago, U.S. leaders thought bringing China into the postwar economic institutions such as the IMF and World Trade Organization would make Beijing more market-oriented and the world more stable. They now think the opposite. China has doubled down on an authoritarian, state-driven economic model that many in the West see as incompatible with their own.
The IMF, the world’s most influential international economic institution, may find itself torn between irreconcilable visions of the global economy, especially if former President Donald Trump is re-elected next month.
Trump has prioritised reducing the trade deficit, especially with China, through tariffs, an approach the IMF has criticised. Many of his advisers are deeply suspicious of both Beijing and international institutions. Project 2025, an agenda for a second Trump term that includes many Trump advisers as authors, has suggested the U.S. should leave the IMF, though there is no sign Trump agrees.
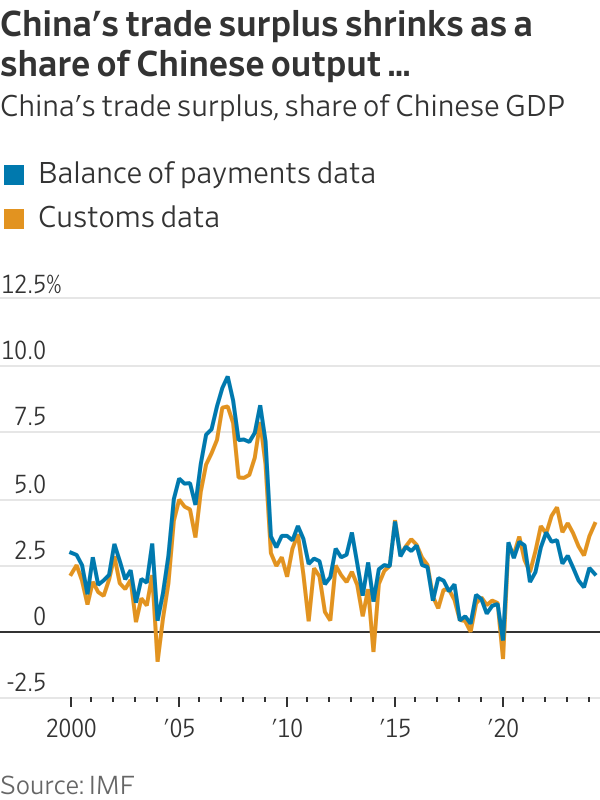
The U.S. has been upset about the growth in China’s trade surplus since it joined the World Trade Organization in 2001, wiping out U.S. factory jobs in what became known as the China shock .
China’s surpluses have since shrunk as a share of its gross domestic product. But because China’s economy is now so large, that surplus has grown as share of world GDP, to 0.7%. Other countries are alarmed at a growing flood of cheap manufacturing imports, dubbed “China Shock 2.0 .”
Jake Sullivan , President Biden’s national security adviser, said at the Brookings Institution Wednesday that China “is producing far more than domestic demand, dumping excess onto global markets at artificially low prices, driving manufacturers around the world out of business, and creating a chokehold on supply chains.”
Treasury Undersecretary Jay Shambaugh told me at a panel organised by the Atlantic Council two weeks ago that China is “already 30% of global manufacturing. You can’t grow at a massive rate when you start from 30% of the world without displacing not just us, but lots of countries.”
Pointing out such tensions is part of the IMF’s job, Shambaugh said at the event. While the IMF has said China’s industrial policies may be hurting its trading partners, “I would like to see them pay more attention…to the aggregate external imbalance.”
The IMF’s architects believed a breakdown in economic cooperation contributed to the Depression. Countries such as the U.S. that ran large trade surpluses felt no pressure to help those with deficits, like Britain. Depressed countries sought to limit imports and boost exports by devaluing their currencies or imposing tariffs, in effect seeking to export their unemployment.
To end such “beggar-thy-neighbour” policies, British economist John Maynard Keynes proposed that trade be conducted through a global bank and currency that would prevent big deficits and surpluses. Instead, at Bretton Woods, delegates agreed to peg their currencies to the dollar with the IMF overseeing periodic revaluations.
By the 1970s, inflation and growing trade deficits caused fixed exchange rates to collapse. Cross-border capital flows soared, enabling poor countries to borrow from western banks and investors. When they defaulted, the IMF had a new mission: helping them restructure their debts, usually on the condition of strict budget austerity. IMF, a popular joke ran, stood for “It’s Mostly Fiscal.”
Even today, while the IMF does still monitor trade deficits and surpluses, it rarely attributes those to cross-border influences, focusing instead on fiscal and other domestic factors.
In a blog post last month, IMF staff investigated the U.S. deficit and Chinese surplus and found little connection.
The U.S. deficit reflected strong government and household spending, while China’s surplus resulted from slumping property markets and domestic confidence. They “are mostly homegrown,” they wrote. In an implicit rebuke to the U.S., they wrote, “Worries that China’s external surpluses result from industrial policies reflect an incomplete view.”
This benign view of Chinese surpluses has drawn criticism. Brad Setser , a former U.S. Treasury official now at the Council on Foreign Relations, said the IMF has relied on data that understates the surplus.
Setser also raps the IMF’s advice to Beijing to let interest rates and the exchange rate fall while tightening fiscal policy—that is, raising taxes or cutting spending. That, he said, will weaken imports, boost exports and thus widen the trade surplus.
“Their analysis is all about how bad the fiscal situation is, with no real analysis of the balance of payments position,” Setser said.
Pierre-Olivier Gourinchas , the IMF’s chief economist, disagreed. He noted the IMF has consistently urged China to boost household consumption such as by strengthening the social safety net and shifting more of the tax burden from the high-consuming poor to the high-saving rich. He also noted that the IMF has argued for fiscal stimulus now and consolidation later.
Does the IMF’s opinion make a difference? Most countries—the big ones especially—will never need to borrow from the IMF and can thus ignore its advice. The IMF has long urged the U.S. to rein in its budget deficit, noting this contributes to its trade deficit, and the U.S. has just as long ignored it.
And yet when the IMF speaks, it does so with an authority and credibility that no private analyst or individual country commands.
China’s approach to boosting exports is “killing jobs elsewhere, and that’s something the IMF should call out,” said Martin Mühleisen , a former senior IMF official now at The Atlantic Council. “China doesn’t want bad publicity from the IMF, in part because the criticism would resonate in many countries.”
 Copyright 2020, Dow Jones & Company, Inc. All Rights Reserved Worldwide. LEARN MORE





From making unpopular decisions to learning when to listen, leaders from five businesses reveal what nobody prepared them for — and how running a company has challenged their expectations.

Technology and semiconductor shares fell sharply as investors questioned the debt financing the AI infrastructure boom and confronted higher rates and Chinese competition.

Technology and semiconductor shares fell sharply as investors questioned the debt financing the AI infrastructure boom and confronted higher rates and Chinese competition.
4 minA sharp technology sell-off has exposed a new anxiety on global markets: whether the enormous borrowing behind the artificial-intelligence infrastructure boom can generate sufficient returns as interest rates rise and Chinese competition intensifies.
The artificial-intelligence investment boom has powered technology shares, semiconductor manufacturers and data-centre operators to extraordinary heights. Last week, investors were given a reminder that much of this expansion is being built with borrowed money.
The technology-heavy Nasdaq Composite fell 4.5 per cent over the week ended October 16, its weakest performance since late June. Semiconductor shares suffered an even deeper correction, with the Philadelphia Semiconductor Index losing about 11.4 per cent.
The selling spread quickly through global markets. Micron Technology fell 14.6 per cent over the week, while South Korea’s Samsung Electronics and SK Hynix dropped approximately 18 per cent and 24 per cent respectively.
This was more than a routine bout of profit-taking. Investors were reassessing three interconnected risks: higher interest rates, the rapidly expanding debt burden attached to AI infrastructure and the prospect of stronger competition from Chinese memory-chip manufacturers.
The debt behind the AI build-out
Artificial intelligence requires a physical infrastructure network of enormous scale. Data centres must be built, advanced processors purchased, power supplies secured and cooling systems installed before customers begin generating meaningful revenue from them.
Technology companies are increasingly supplementing their own cash with corporate bonds, syndicated loans, equipment leases, private credit and project-level financing.
JPMorgan describes the emerging funding model as a combination of conventional corporate borrowing and project finance tied to individual data-centre assets. In Australia, the Reserve Bank estimates that syndicated loans accounted for approximately three-quarters of data-centre financing during 2025 and 2026 to date.
The numbers are becoming large enough to affect broader credit markets. The Federal Reserve Bank of Dallas has cited Wall Street estimates suggesting AI-related investment-grade bond issuance could approach US$300 billion in 2026 alone.
That borrowing is not automatically problematic. Debt can be an efficient way to finance long-lived infrastructure when future revenue is sufficiently predictable. The concern is that AI technology, customer demand and computing economics are changing much faster than the repayment schedules attached to the assets.
A data centre financed today may carry debt for years. Investors must therefore make assumptions about future utilisation rates, electricity prices, chip performance, customer concentration and the amount businesses will ultimately pay for AI computing.
When interest rates rise, those assumptions become less forgiving.
Inflation changes the calculation
September’s US inflation data intensified the pressure. Consumer prices increased 3.7 per cent over the year, ahead of market expectations and up from 3.4 per cent in August.
The hotter reading reduced confidence that interest rates would fall quickly and pushed bond yields higher. That matters particularly for companies whose valuations depend on profits expected well into the future, as well as highly leveraged infrastructure operators that may need to refinance.
CoreWeave has emerged as a closely watched test case. The specialist cloud-computing company has accumulated substantial debt and lease obligations to build AI capacity, while relying on a concentrated group of large technology customers.
Its shares fell sharply during the sell-off, while the cost of insuring its debt against default climbed. CoreWeave has argued that its contracted backlog more than covers its obligations and that financial markets do not always understand its business model. Nevertheless, its securities have become a proxy for investor confidence in debt-funded AI infrastructure.
Oracle, another major investor in AI computing capacity, fell 8.8 per cent in Friday trading, while CoreWeave dropped 15.5 per cent.
The question is shifting from how much AI infrastructure can be built to how profitably it can be operated.
China adds another source of pressure
Interest rates were not the only catalyst. Reports of advances by Chinese memory-chip producer ChangXin Memory Technologies raised concerns that lower-cost Chinese products could increase competition across the global semiconductor industry.
Memory chips are essential to AI systems, but the industry is historically cyclical. Periods of tight supply and high pricing can encourage rapid investment, eventually producing oversupply and falling margins.
The prospect of a well-funded Chinese competitor expanding its technological capabilities unsettled investors in Samsung, SK Hynix and Micron. It also demonstrated that AI-related demand does not insulate chipmakers from conventional competitive pressures.
That combination—slower rate cuts, more expensive financing and potentially cheaper supply—challenged the assumption that every company exposed to AI would enjoy continually expanding margins.
A reset rather than the end of the boom
The sell-off does not establish that the AI boom is ending. Demand for computing power remains strong, the largest technology companies continue to generate formidable cash flows and many infrastructure projects are backed by long-term customer contracts.
What has changed is the market’s willingness to overlook the price and financing structure of that growth.
The most resilient companies are likely to be those able to fund investment from operating cash flow, secure long-duration customers and demonstrate that new capacity will earn returns comfortably above its financing costs.
More speculative operators may face greater scrutiny, particularly where debt is expensive, customers are concentrated or expected revenue depends on demand that has not yet materialised.
For Australian investors, the lesson extends beyond US technology shares. Local data-centre operators, infrastructure funds, electricity suppliers and property groups are increasingly exposed to the same investment cycle.
Artificial intelligence may remain one of the defining growth themes of the decade. But last week’s correction showed that enthusiasm for the technology does not eliminate financial discipline.
The next stage of the AI boom will be judged not only by computing power, model performance or demand for chips, but by something more traditional: whether the assets being financed can generate enough cash to repay the money borrowed to build them.
Fact box
Nasdaq Composite: Down 4.5 per cent for the week ended October 16, 2026
Philadelphia Semiconductor Index: Down approximately 11.4 per cent
Micron Technology: Down approximately 14.6 per cent
Samsung Electronics: Down approximately 18 per cent
SK Hynix: Down approximately 24 per cent
US September inflation: 3.7 per cent annually
Estimated 2026 AI-related investment-grade issuance: Approximately US$300 billion

Now complete, Ophora at Tallawong offers luxury finishes, 10-year defect insurance and standout value from $475,000.

Here’s how they are looking at artificial intelligence, interest rates and economic pressures.