


The U.S. Consumer Is Starting to Freak Out
The flush savings accounts and cheap credit that helped keep Americans spending at high rates since 2020 are disappearing
 6 min

The engine of the U.S. economy—consumer spending—is starting to sputter.
Retail purchases have fallen in three of the past four months. Spending on services, including rent, haircuts and the bulk of bills, was flat in December, after adjusting for inflation, the worst monthly reading in nearly a year. Sales of existing homes in the U.S. fell last year to their lowest level since 2014 as mortgage rates rose. The auto industry posted its worst sales year in more than a decade.
It’s a stark turnaround from the second half of 2020, when Americans lifted the economy out of a pandemic downturn, helping the U.S. avoid what many economists worried would be a prolonged slump. Consumers snapped up exercise bikes, televisions and laptop computers for schoolchildren during lockdowns. When restrictions were lifted, they rushed back to their favourite restaurants and travel destinations.
And they kept spending, helped by government stimulus, flush savings accounts and cheap credit, even as inflation picked up. Faced with four-decade-high inflation last year, Americans outspent it. Through most of 2022, consumer spending growth exceeded price increases by about 2 percentage points.
Now the forces that helped keep spending high are unwinding, while inflation remains elevated. The share of monthly income Americans set aside for savings was 3.4% in December, down from 7.5% a year earlier and from a record high in April 2020. Credit-card interest rates have been rising, and Federal Reserve officials have signalled that they plan an additional quarter-percentage point increase to the central bank’s benchmark rate this week. That would bring the rate to between 4.5% and 4.75%, from near zero at the start of last year.
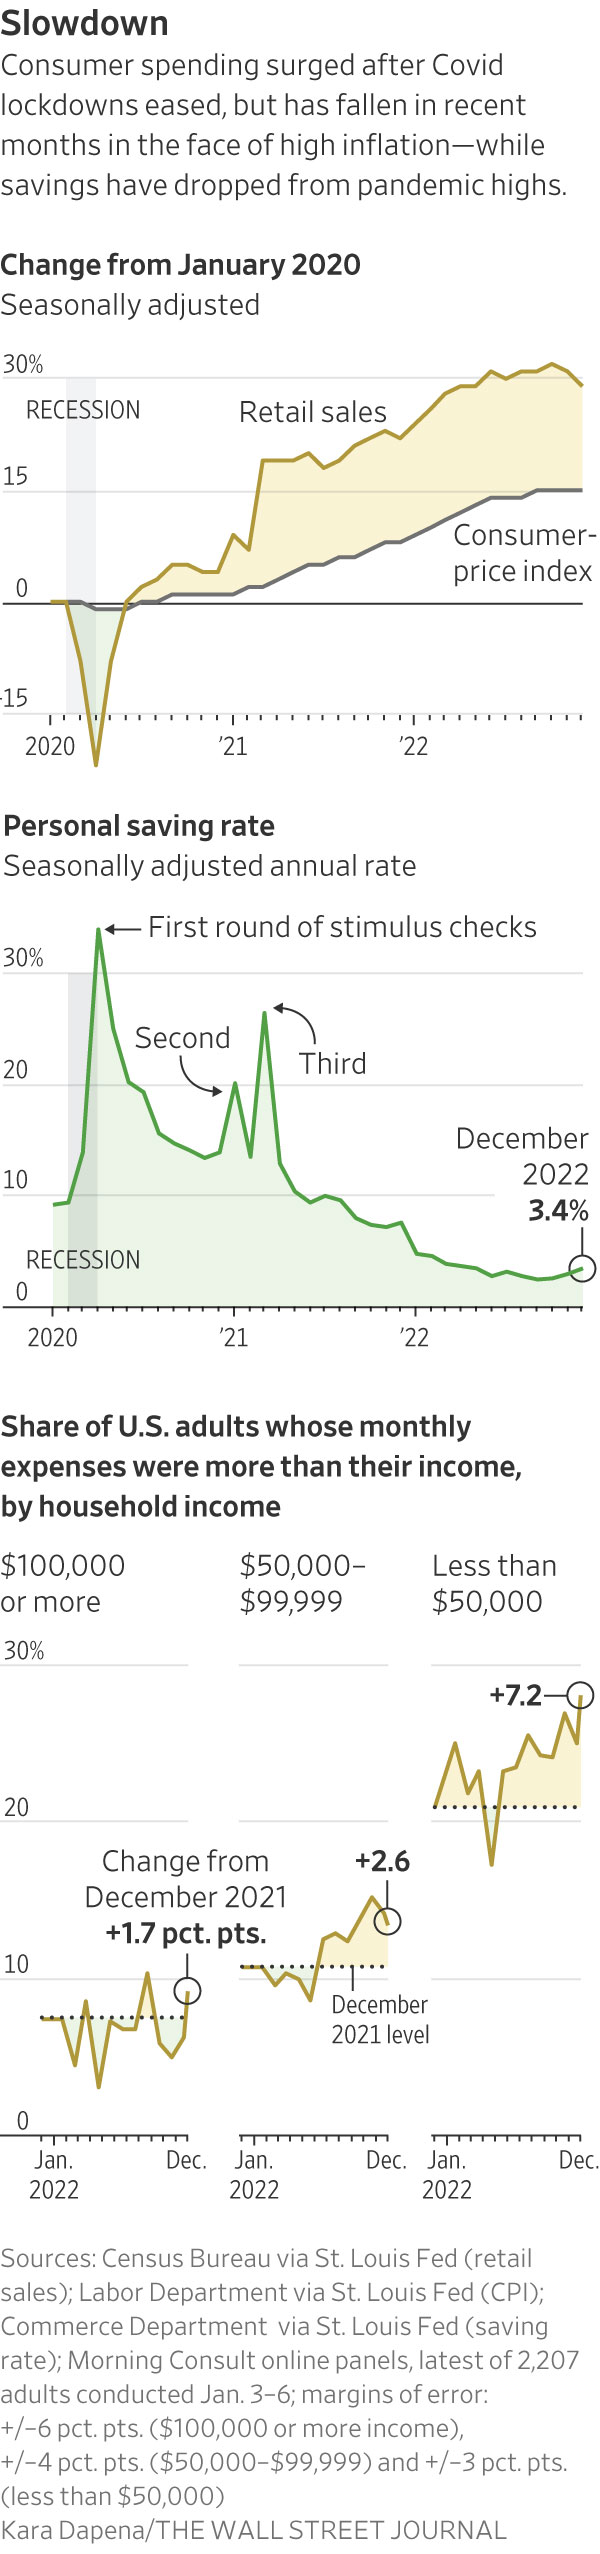
Annual inflation, as measured by the consumer-price index, remained above 5% in December for the 19th straight month, the longest such streak since the early 1980s.
Consumer spending accounts for roughly 70% of the economy. A downshifting consumer is a key reason that business and academic economists polled by The Wall Street Journal, on average, put the probability of a recession in the next 12 months at 61%. However, many economists say, the U.S. might avoid a recession entirely if spending patterns stabilise.
One factor making forecasting more difficult: While unemployment is trending at a half-century low, big companies including Amazon.com Inc., Goldman Sachs Group Inc., and Microsoft Corp. have begun to cut jobs.
“The last bastion of strength is the labor market, but I don’t think it can withstand all these other forces,” said Nationwide Chief Economist Kathy Bostjancic.
Recent layoff trends worry Benjamin DeLong, a 32-year-old customer-account manager at an industrial manufacturer in southern Minnesota. His savings rose to $3,700 during the pandemic, thanks in part to government stimulus. He is now down to about 3 cents.
Mr. DeLong said he had to dip into his savings to cover the rising costs of his groceries, utilities and car insurance. He has found some relief in his grocery bills since he and his partner decided last year to purchase some pigs, jointly with other families, to be raised on a relative’s farm. Their portion of meat yielded nearly 150 pounds, saving them about $500 on groceries, Mr. DeLong estimated.
The possibility of layoffs, he said, is “part of the crunch that I’m having to consider now. What’s going to happen if I no longer have an income?”
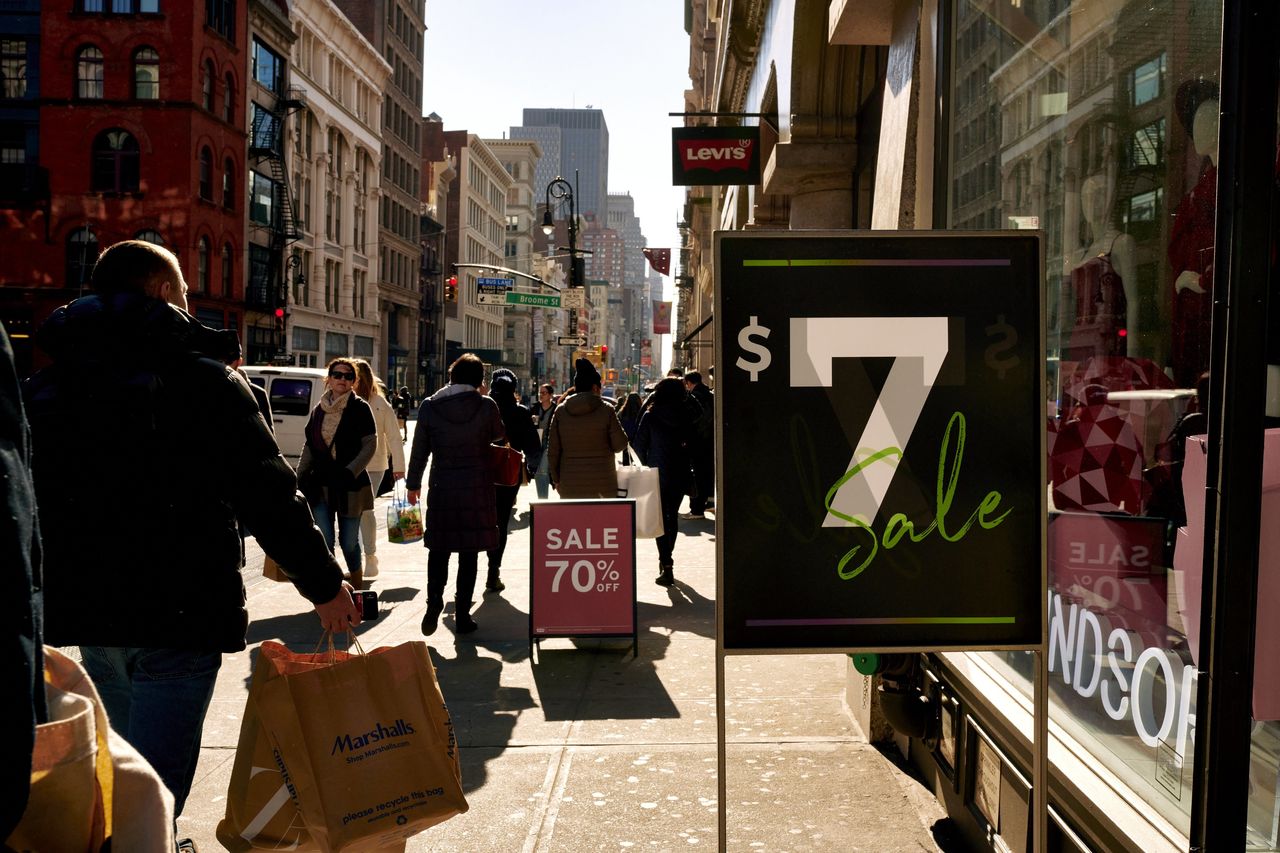
So far, jobs have remained plentiful and wages continued to rise in the face of Federal Reserve tightening. Unemployment was a low 3.5% in December. Hourly wages were up a robust 4.6% year-over-year. There were about 10.5 million unfilled jobs available in November, according to the Labor Department, a sign that demand for labor remained strong.
“Households had a ton of comfort they don’t normally have about their job prospects,” said Marianne Wanamaker, an economist at the University of Tennessee. “They knew they could get a job tomorrow if they wanted to, and that remains mostly true.”
Still, there are signs of labor-market weakness. Employers are shedding temporary workers at a fast rate, and people who lose their jobs are taking longer to find new ones. Meanwhile, the number of hours worked a week has declined for two straight months, according to the Labor Department, resulting in a slowdown in workers’ take-home pay.
Mikhail Andersson, owner of First Class Tattoo in New York City, has seen signs of weakening demand. After it was cleared to reopen from lockdowns in the summer of 2020, his business was slammed by customers flush with unemployment insurance payments and stimulus checks.
In mid-November of last year, Mr. Andersson started getting calls from clients who had booked daylong tattoo sessions, saying they could only afford shorter ones or pulling out altogether. Mr. Andersson, who specializes in tattoo projects that often take five or six all-day sessions to complete, had 15 cancellations for full-day slots in December.

“In my 15 years doing this, I’ve never seen that—people calling up and saying they don’t have the money to spend right now or can only afford an hour because their current situation is pretty bad,” he said.
For now, First Class Tattoo isn’t likely to slash prices because the baseline level of demand remains strong. Some 250 clients are still on the wait list.
Also weighing on many consumers: The rapid increase in rates in the past year, tied to Fed tightening, has pushed the cost of all types of debt higher.
Mortgage rates reached a 20-year high last fall. Some 57% of consumers were concerned about making housing payments in the fourth quarter, according to a survey by Freddie Mac, up from 48% in the third quarter.
The increases are gradually starting to slow down consumer spending, though it might take a while before the effect is fully realised.
“We’re probably going to have higher interest rates around for quite a while. You would think eventually that would dampen consumption, although that we haven’t had the full effect yet,” said Harvard University economist Kenneth Rogoff.
Credit-card balances were up 15% on the year in the third quarter, according to the Federal Reserve Bank of New York, the largest increase in more than two decades.
Additionally, tens of millions of Americans are set to start or resume making payments on student loans later this year, after the Supreme Court rules on President Biden’s student-debt cancellation plan. Payments have been frozen since March 2020, and are scheduled to begin again 60 days after litigation is resolved or the program is implemented.
Many taxpayers will get smaller refunds when they file their returns in the coming months because Congress didn’t extend the breaks put in place at the height of the pandemic.
Most Americans who lose their jobs can expect unemployment payments for six months or less, at a fraction of their former paychecks, the same as before pandemic programs kicked in. Pandemic programs allowed Americans to receive unemployment payments for as long as 18 months, and in some cases paid workers more than their paychecks.
The previously generous jobless benefits and direct federal payments to households caused the share of income Americans save every month to hit new highs in 2020. Since then, the saving rate has fallen to roughly 3% of monthly income, from more than 30% at the start of lockdowns. In 2019, the year before the pandemic, the rate was 8.8%.
The large stock-market declines over the past year also alarmed consumers, including Scottsdale, Ariz.-based Sara Laor, who is 57 years old. Ms. Laor said the declines depleted the holdings in her 401(k) and IRA accounts by nearly 40%.
Over the past year, her family has had to dip into their savings to pay for essential car and plumbing repairs. They are putting off other expenses, like buying a new car, and have given up ordering in meals.
She’s trying to spend more cautiously, shunning recipes involving pricey eggs and buying more canned food.
“Everything I do just feels like I’m a lot poorer: Can I do this or can I do that?” she said.
U.S. factories, shippers and importers are pulling back, a sign they anticipate less demand from Americans in the months ahead.
Inbound volumes at the ports of Los Angeles and Long Beach in California were down 20.1% in December from a year earlier, and have been behind 2019 levels since August. A little over a year ago, backlogs at ports were drawing President Biden’s attention.
Nicholas Hobbs, chief operating officer of J.B. Hunt Transport Services Inc., which manages truck and rail shipments, said the company has seen demand fall off for big and bulky products, including appliances, furniture and exercise equipment—although off-price retailers with discounted inventory are shipping more.

Jazzlyn Millberry, 33, has been looking for big ways to make cuts. One day last fall, her banking app informed her that the cost of one month’s groceries and household goods for her family of four had risen to $900, from about $600 or $700.
“I find myself now going to three or four different grocery stores just to get the best deals on things to save on costs,” said Ms. Millberry, a health-insurance claims analyst in Pickerington, Ohio.
On one recent outing, she stopped at Kroger for eggs and meat, Aldi for produce, Sam’s Club for her children’s snacks, and Target for toilet paper.
Even as she has cut back on groceries, restaurants, hairstyling and facials, her credit-card balances have grown in the past several months. She said she started making only the minimum required payment on her credit cards.
—Gwynn Guilford and Paul Page contributed to this article.

From making unpopular decisions to learning when to listen, leaders from five businesses reveal what nobody prepared them for — and how running a company has challenged their expectations.

Technology and semiconductor shares fell sharply as investors questioned the debt financing the AI infrastructure boom and confronted higher rates and Chinese competition.
Technology and semiconductor shares fell sharply as investors questioned the debt financing the AI infrastructure boom and confronted higher rates and Chinese competition.
4 minA sharp technology sell-off has exposed a new anxiety on global markets: whether the enormous borrowing behind the artificial-intelligence infrastructure boom can generate sufficient returns as interest rates rise and Chinese competition intensifies.
The artificial-intelligence investment boom has powered technology shares, semiconductor manufacturers and data-centre operators to extraordinary heights. Last week, investors were given a reminder that much of this expansion is being built with borrowed money.
The technology-heavy Nasdaq Composite fell 4.5 per cent over the week ended October 16, its weakest performance since late June. Semiconductor shares suffered an even deeper correction, with the Philadelphia Semiconductor Index losing about 11.4 per cent.
The selling spread quickly through global markets. Micron Technology fell 14.6 per cent over the week, while South Korea’s Samsung Electronics and SK Hynix dropped approximately 18 per cent and 24 per cent respectively.
This was more than a routine bout of profit-taking. Investors were reassessing three interconnected risks: higher interest rates, the rapidly expanding debt burden attached to AI infrastructure and the prospect of stronger competition from Chinese memory-chip manufacturers.
The debt behind the AI build-out
Artificial intelligence requires a physical infrastructure network of enormous scale. Data centres must be built, advanced processors purchased, power supplies secured and cooling systems installed before customers begin generating meaningful revenue from them.
Technology companies are increasingly supplementing their own cash with corporate bonds, syndicated loans, equipment leases, private credit and project-level financing.
JPMorgan describes the emerging funding model as a combination of conventional corporate borrowing and project finance tied to individual data-centre assets. In Australia, the Reserve Bank estimates that syndicated loans accounted for approximately three-quarters of data-centre financing during 2025 and 2026 to date.
The numbers are becoming large enough to affect broader credit markets. The Federal Reserve Bank of Dallas has cited Wall Street estimates suggesting AI-related investment-grade bond issuance could approach US$300 billion in 2026 alone.
That borrowing is not automatically problematic. Debt can be an efficient way to finance long-lived infrastructure when future revenue is sufficiently predictable. The concern is that AI technology, customer demand and computing economics are changing much faster than the repayment schedules attached to the assets.
A data centre financed today may carry debt for years. Investors must therefore make assumptions about future utilisation rates, electricity prices, chip performance, customer concentration and the amount businesses will ultimately pay for AI computing.
When interest rates rise, those assumptions become less forgiving.
Inflation changes the calculation
September’s US inflation data intensified the pressure. Consumer prices increased 3.7 per cent over the year, ahead of market expectations and up from 3.4 per cent in August.
The hotter reading reduced confidence that interest rates would fall quickly and pushed bond yields higher. That matters particularly for companies whose valuations depend on profits expected well into the future, as well as highly leveraged infrastructure operators that may need to refinance.
CoreWeave has emerged as a closely watched test case. The specialist cloud-computing company has accumulated substantial debt and lease obligations to build AI capacity, while relying on a concentrated group of large technology customers.
Its shares fell sharply during the sell-off, while the cost of insuring its debt against default climbed. CoreWeave has argued that its contracted backlog more than covers its obligations and that financial markets do not always understand its business model. Nevertheless, its securities have become a proxy for investor confidence in debt-funded AI infrastructure.
Oracle, another major investor in AI computing capacity, fell 8.8 per cent in Friday trading, while CoreWeave dropped 15.5 per cent.
The question is shifting from how much AI infrastructure can be built to how profitably it can be operated.
China adds another source of pressure
Interest rates were not the only catalyst. Reports of advances by Chinese memory-chip producer ChangXin Memory Technologies raised concerns that lower-cost Chinese products could increase competition across the global semiconductor industry.
Memory chips are essential to AI systems, but the industry is historically cyclical. Periods of tight supply and high pricing can encourage rapid investment, eventually producing oversupply and falling margins.
The prospect of a well-funded Chinese competitor expanding its technological capabilities unsettled investors in Samsung, SK Hynix and Micron. It also demonstrated that AI-related demand does not insulate chipmakers from conventional competitive pressures.
That combination—slower rate cuts, more expensive financing and potentially cheaper supply—challenged the assumption that every company exposed to AI would enjoy continually expanding margins.
A reset rather than the end of the boom
The sell-off does not establish that the AI boom is ending. Demand for computing power remains strong, the largest technology companies continue to generate formidable cash flows and many infrastructure projects are backed by long-term customer contracts.
What has changed is the market’s willingness to overlook the price and financing structure of that growth.
The most resilient companies are likely to be those able to fund investment from operating cash flow, secure long-duration customers and demonstrate that new capacity will earn returns comfortably above its financing costs.
More speculative operators may face greater scrutiny, particularly where debt is expensive, customers are concentrated or expected revenue depends on demand that has not yet materialised.
For Australian investors, the lesson extends beyond US technology shares. Local data-centre operators, infrastructure funds, electricity suppliers and property groups are increasingly exposed to the same investment cycle.
Artificial intelligence may remain one of the defining growth themes of the decade. But last week’s correction showed that enthusiasm for the technology does not eliminate financial discipline.
The next stage of the AI boom will be judged not only by computing power, model performance or demand for chips, but by something more traditional: whether the assets being financed can generate enough cash to repay the money borrowed to build them.
Fact box
Nasdaq Composite: Down 4.5 per cent for the week ended October 16, 2026
Philadelphia Semiconductor Index: Down approximately 11.4 per cent
Micron Technology: Down approximately 14.6 per cent
Samsung Electronics: Down approximately 18 per cent
SK Hynix: Down approximately 24 per cent
US September inflation: 3.7 per cent annually
Estimated 2026 AI-related investment-grade issuance: Approximately US$300 billion

By improving sluggish performance or replacing a broken screen, you can make your old iPhone feel new agai

Records keep falling in 2025 as harbourfront, beachfront and blue-chip estates crowd the top of the market.