The unexpected reasons Australians are retiring earlier than planned
A new report reveals 710,000 workers plan to retire over the next five years
 2 min
2 min
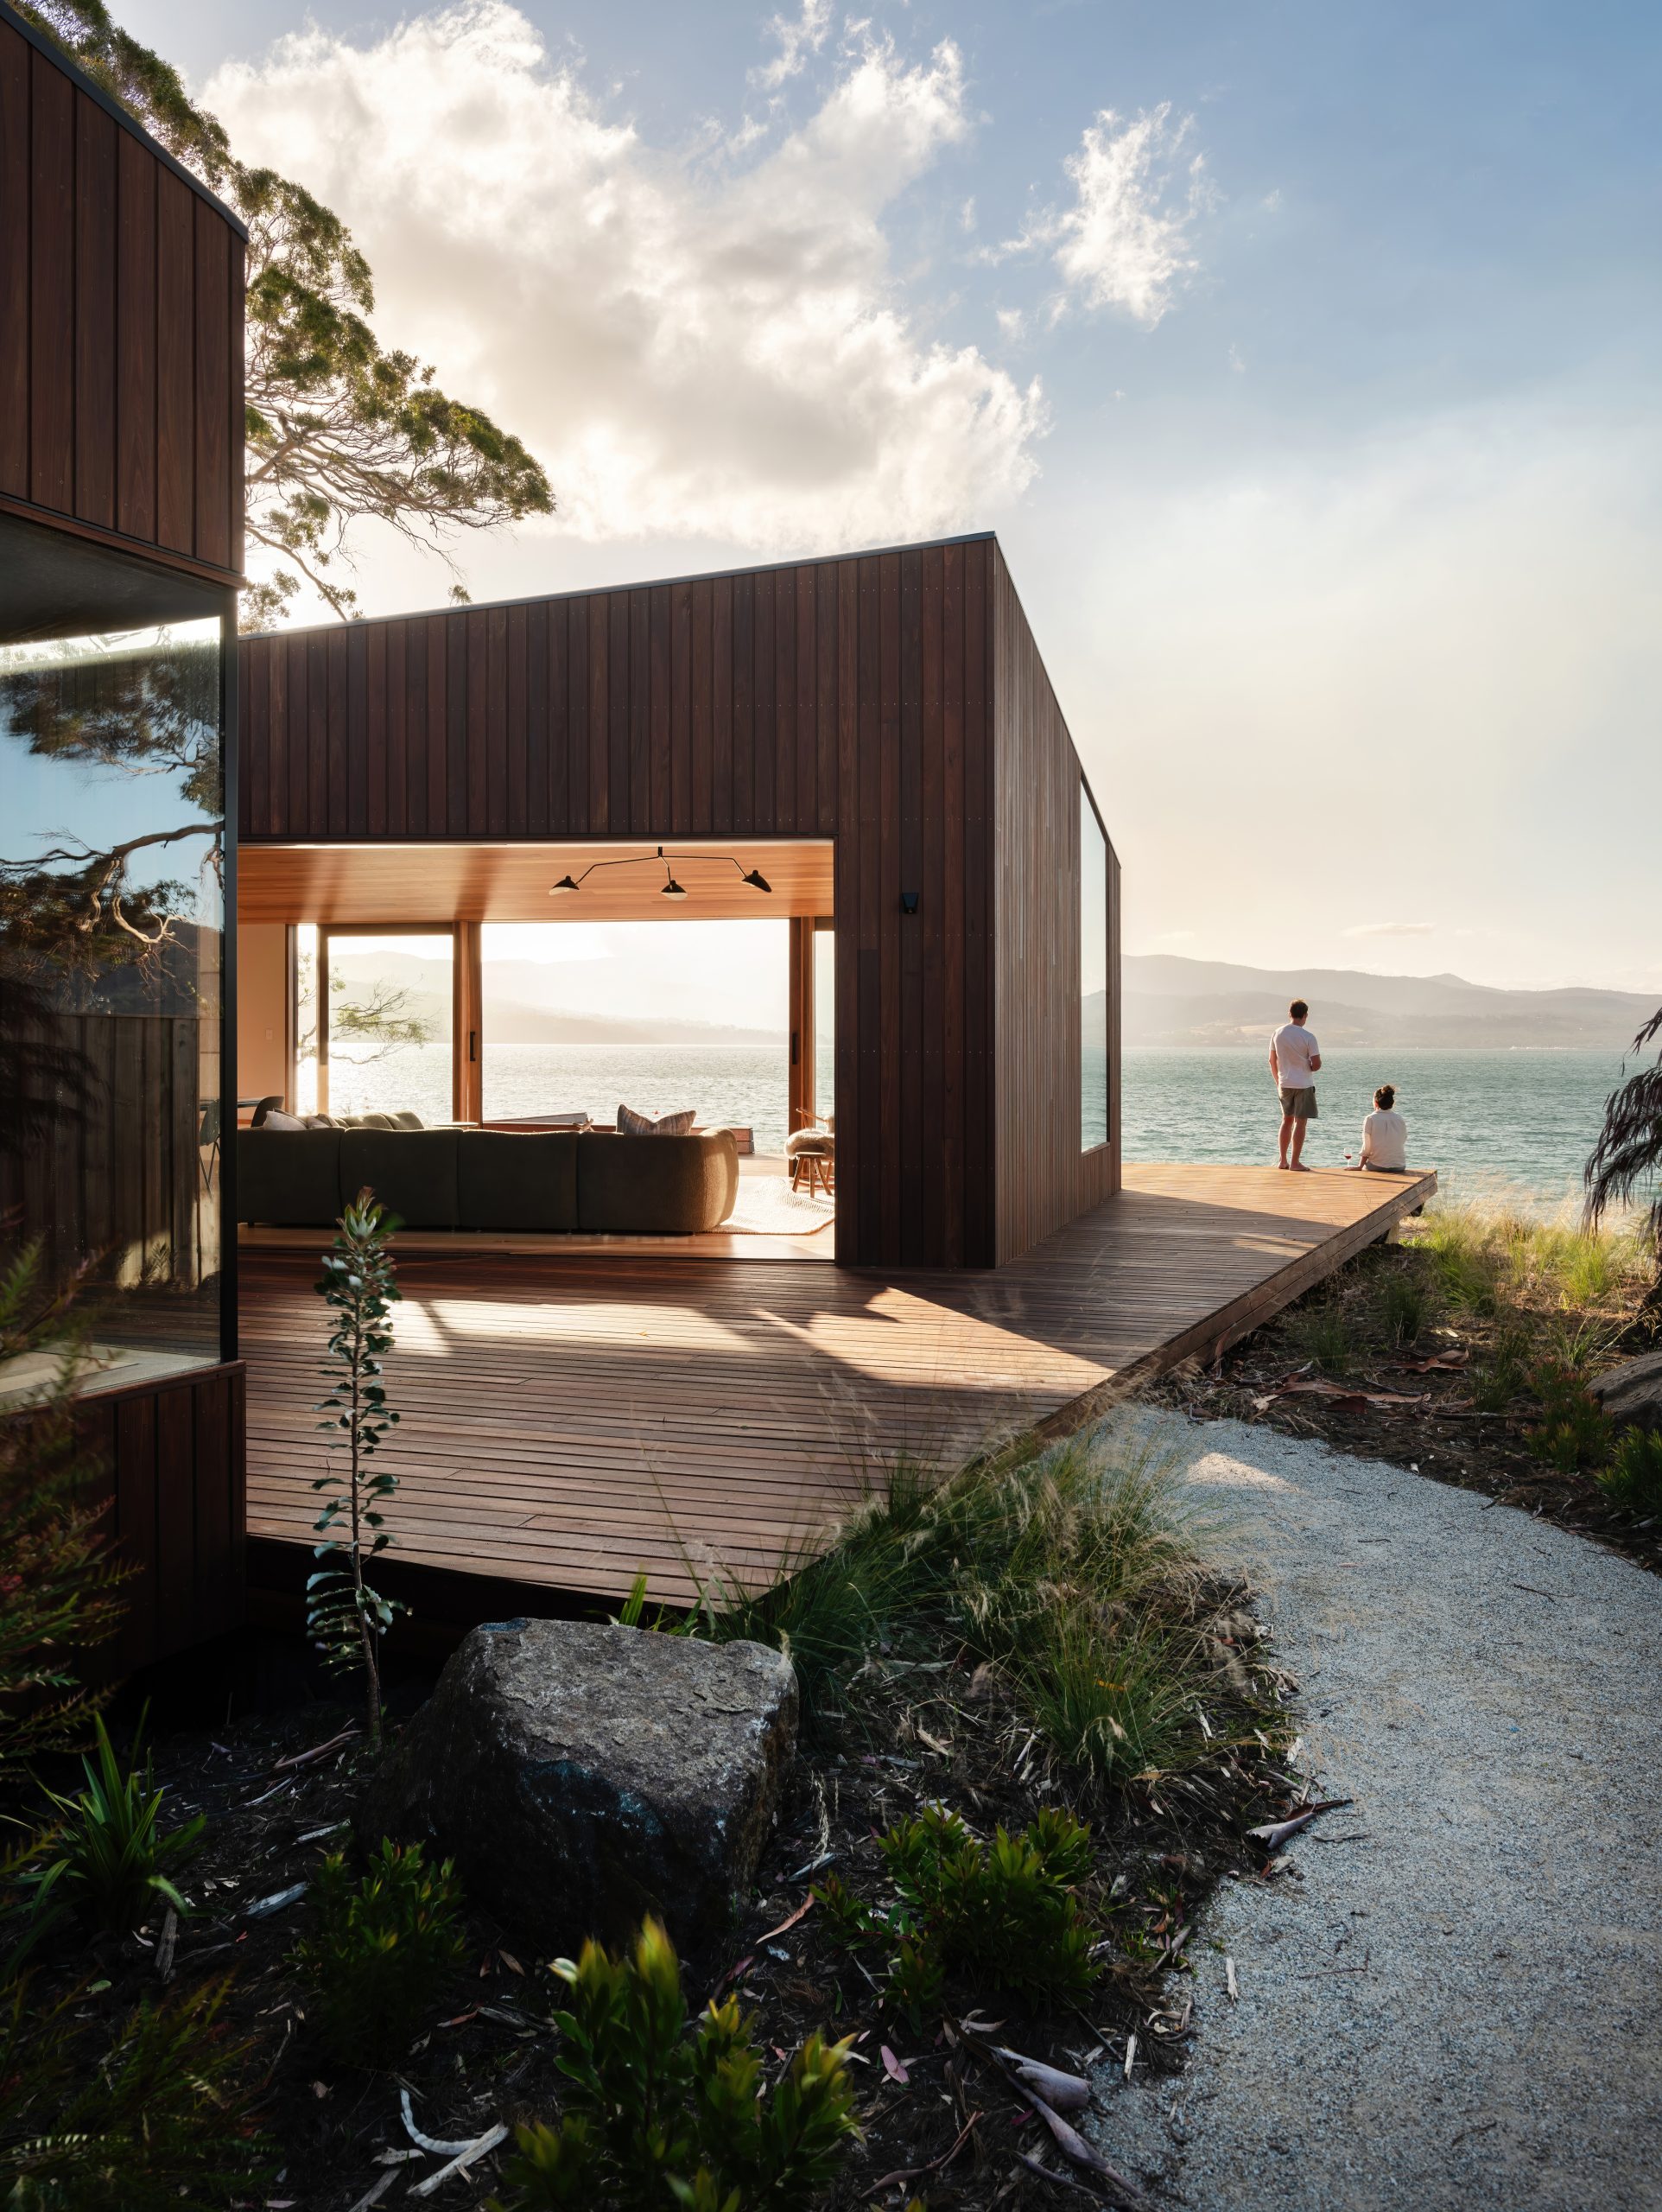
Australia has a community of 4.2 million retirees, with another 710,000 intending to retire over the next five years and 226,000 of them planning to do so over the next two years, according to the Australian Bureau of Statistics (ABS). One of the biggest generations in Australia’s history – the baby boomers – is in the midst of its retirement years today. The baby boom began after WWII, with boomers being born between 1945 and 1964, making the youngest of this group 60 years old today.
The average age at which today’s workers intend to retire is 65.4 years. However, the long-term historical average is more than eight years earlier, with the average age at which existing retirees left the workforce being 56.9 years. People working in agriculture, forestry and fishing have the latest intended retirement age of 68.3 years. This is followed by workers in property at 67.1 years and manufacturing at 66.1 years. Workers in the mining sector have the earliest intended retirement age of 63.7 years, followed by workers in IT at 64 years and financial services at 64.3 years.
One factor that may be prompting people to retire earlier than planned is unforeseen circumstances, such as job loss, personal sickness or injury, or the need to provide care for someone else. Among existing retirees, an ABS survey found 13 percent retired because of sickness, injury or disability. Another 5 percent retired because they were retrenched, dismissed, or unable to find employment. Three percent retired to care for an ill, disabled or elderly person.
For 31 percent of retirees, gaining access to financial support was the main reason they retired. The age pension is the biggest source of income for most retirees today, followed by superannuation. The age at which baby boomers can receive the pension has increased over time from 65 to 67 years. However, they can access their superannuation earlier, once they reach preservation age.
Preservation ages vary depending on birth dates. Australians born before 1 July 1960 have a preservation age of 55 years. The preservation age increases by one year for every financial year from FY61 to FY64. For those born after 30 June 1964, the preservation age is 60 years. This means the youngest boomers will all gain access to their superannuation this year, which may prompt them to retire. Otherwise, they have seven more years to wait for eligibility for the age pension at 67.
Bjorn Jarvis, ABS head of labour statistics said: “In 2022-23, a Government pension or allowance was still the main source of personal income at retirement for 43 percent of retirees. This was followed by Superannuation, an annuity or private pension at 27 percent.”The full age pension is currently $43,752.80 per annum for couples and $29,023.80 for singles. The average superannuation balance for Australians aged 60 to 64 years is just over $360,000, according to the latest tax office data.
The impact of one of our largest generations retiring is reflected in surging superannuation payouts. New figures from the Australian Prudential Regulation Authority show an 18.1% increase in payouts over the 12 months to 31 March. The payouts, taken as lump sums or pension streams, totalled $112.9 billion.
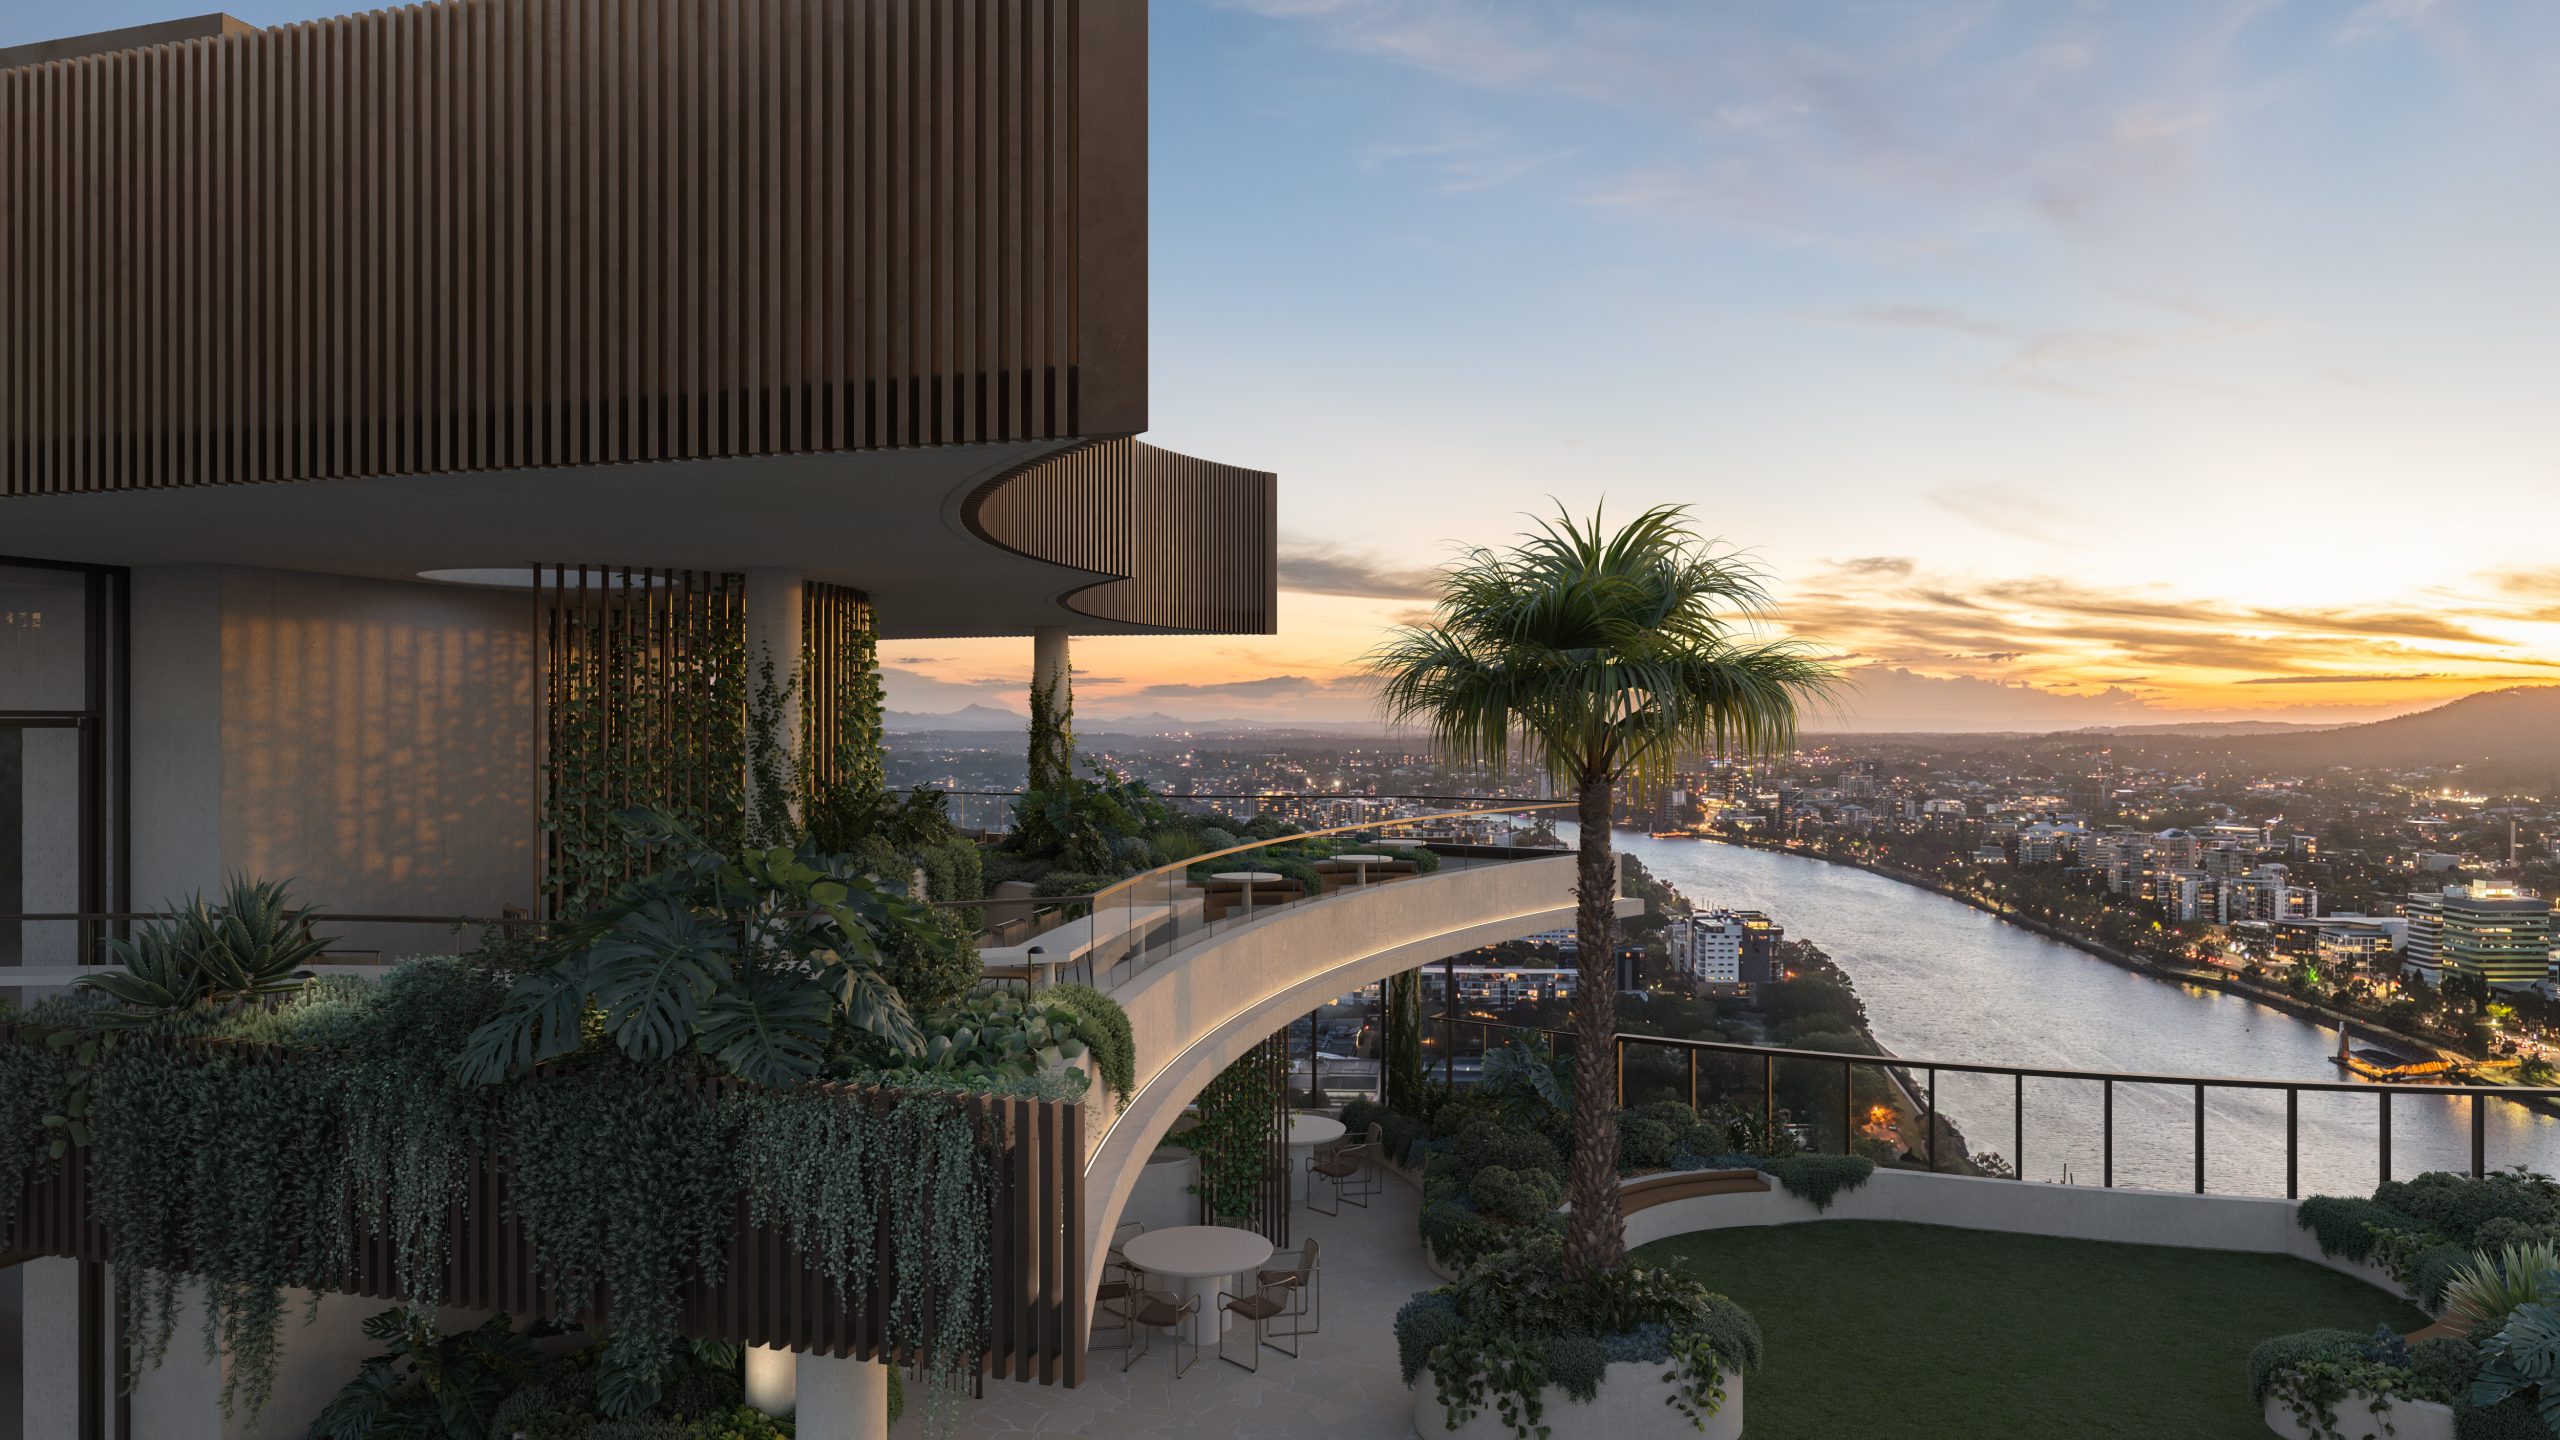
Set on one of the city’s last absolute riverfront sites, The Riversdale by Mosaic combines irreplaceable waterfront ownership with one of Brisbane’s most significant residential opportunities.
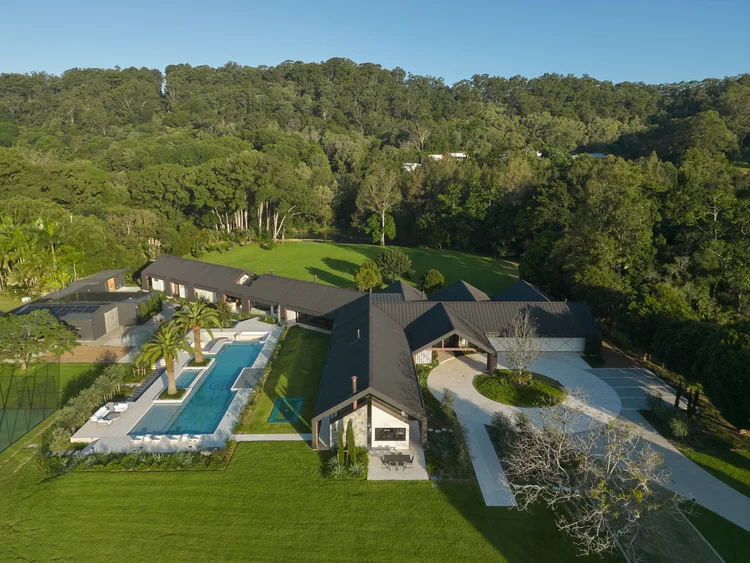
Margot Robbie may have travelled from a Queensland farm to the highest reaches of Hollywood, but a reported $28 million property deal suggests the Gold Coast has never lost its hold on her. The Australian actor and producer is believed to be the mystery buyer of Redwood, a seven-acre Currumbin Valley estate transformed into the …
Continue reading “Margot Robbie Reportedly Behind $28 Million Currumbin Valley Homecoming”

The federal budget has rattled property investors. But the biggest mistake isn’t the tax changes, it’s the conclusion many are drawing from them.
2 min
The recent budget has forced a reckoning for property investors.
Negative gearing now restricted to new residential builds, the CGT discount gone and on paper, the numbers look different.
And many investors are responding by pivoting toward yield, prioritising cash flow over capital growth in a way that property strategists say misses the point entirely.
“The debate has shifted to yield versus growth as if they are opposing forces,” says Abdullah Nouh, founder of Melbourne-based buyers’ agency Mecca Property Group. “But that framing is itself the mistake.”
Nouh, who works with high-net-worth families and investors on long-term acquisition strategy, argues that capital growth remains the primary driver of genuine wealth creation and that the post-budget environment has made quality assets more important, not less.
The numbers make his case plainly. An additional $500 per week in rental income is welcome. A prestige asset appreciating by $1 million over a market cycle is transformative.
These are not equivalent outcomes, and portfolios built around yield at the expense of location and land value tend to generate income while wealth stands largely still.
The more nuanced shift Nouh is seeing among sophisticated investors is a move toward assets where both outcomes can be engineered simultaneously – established homes on substantial land in quality locations, where the existing dwelling can be repositioned, rental returns improved, and the underlying land value compounds independent of what sits on it.
For investors with existing equity, commercial property is also entering the conversation in a more serious way.
Prestige industrial assets, medical centres and long-leased essential retail offer income profiles that residential property in most capital city markets cannot currently match: longer lease terms, tenants covering outgoings, and greater predictability than the residential tenancy cycle.
“The investors who build lasting wealth are rarely the ones who chased yield or growth exclusively,” says Nouh.
“They are the ones who built a strategy they could sustain – one that generated enough income to hold quality assets through multiple cycles while those assets compounded in value.”
The budget has changed the settings. It has not changed the fundamentals.

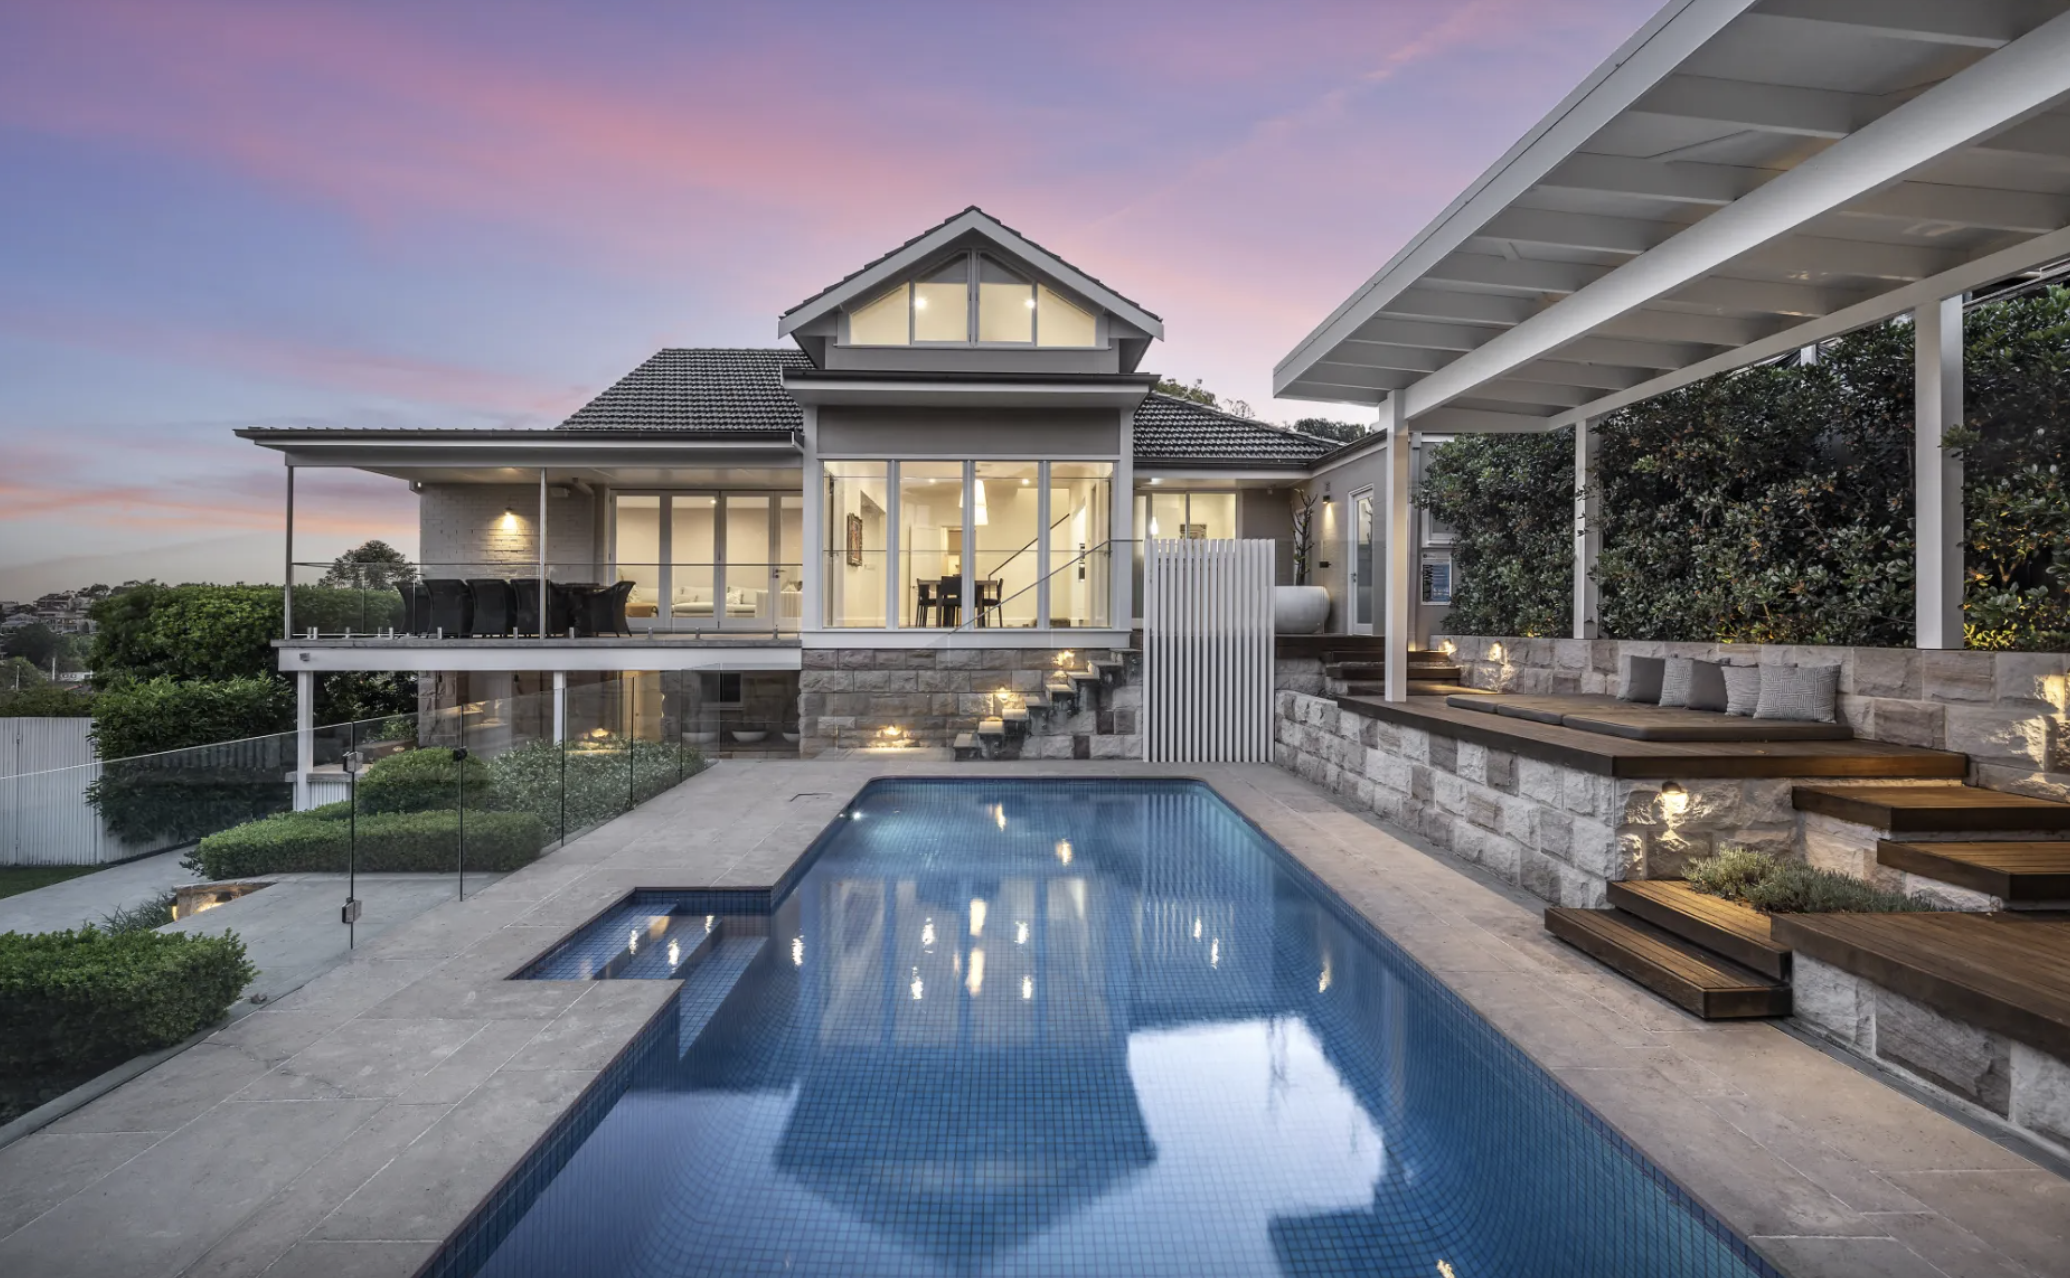
An opulent Ryde home, packed with cinema, pool, sauna and more, is hitting the auction block with a $1 reserve.

The sports-car maker delivered 279,449 cars last year, down from 310,718 in 2024.