The World Tied $3.5 Trillion-Plus of Debt to Inflation. The Costs Are Now Adding Up.
With roughly $770 billion of borrowings linked to retail prices, Britain is feeling the pinch

 5 min
5 min
Governments and companies around the world spent decades loading up on trillions of dollars of debt whose interest costs rise and fall alongside inflation. But what served as cheap funding when prices were stagnant has rapidly become more expensive.
The inflation-linked headache echoes the broader challenges arising at the end of more than a decade of global easy money, in which debtors borrowed vast amounts at very low, and sometimes negative, interest rates. Investors are on alert for financial vulnerabilities after a crisis in U.S. regional banks this year, and with strains emerging in commercial property.
Borrowing costs of all sorts have risen sharply for governments, businesses and consumers, as central banks have raised key interest rates to combat price pressures. Rates have surged on inflation-linked borrowings, but these aren’t the only source of pain.
As standard bonds with fixed rates mature, they need to be replaced with more expensive new debt. Meanwhile, interest rates on loans are often floating, meaning they quickly reflect changes in policy rates.
Yields on benchmark 10-year fixed-rate bonds, a proxy for government borrowing costs, have climbed to about 4.3% for the U.K. and 3.9% for the U.S. Both were below 1% during the pandemic.
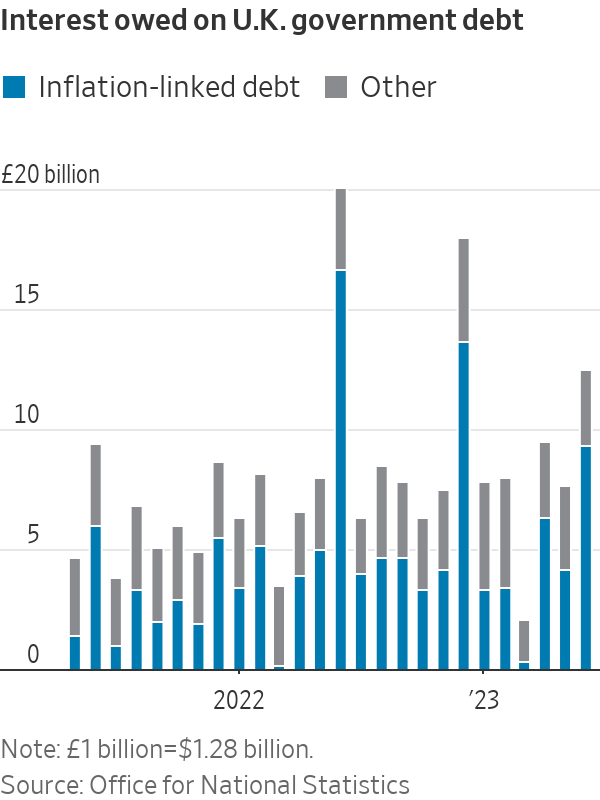
Governments will pay roughly $2.2 trillion in overall debt interest this year, Fitch Ratings estimates. The U.S. Treasury’s interest cost grew 25% to $652 billion in the nine months through June. Germany’s debt-servicing bill is expected to soar to 30 billion euros this year, or some $33.2 billion, from €4 billion in 2021.
Governments had $3.5 trillion in outstanding inflation-linked debt at the end of 2022, according to the Bank for International Settlements, equivalent to about 11% of their total borrowings.
The poster child for the inflation-linked problem is Britain, which has experienced the fastest rise in debt costs in the Group of Seven advanced democracies. The U.K. first embraced such debt under Prime Minister Margaret Thatcher and in 1981 became one of the first developed economies to issue inflation-linked debt: securities that are known as linkers there and Treasury Inflation-Protected Securities, or TIPS, in the U.S. Both the amount due to investors once the bonds mature and the regular interest payments they receive move with inflation.
About a quarter of U.K. debt is now tied to inflation, trailing only a handful of emerging markets with a history of runaway prices such as Uruguay, Brazil and Chile.
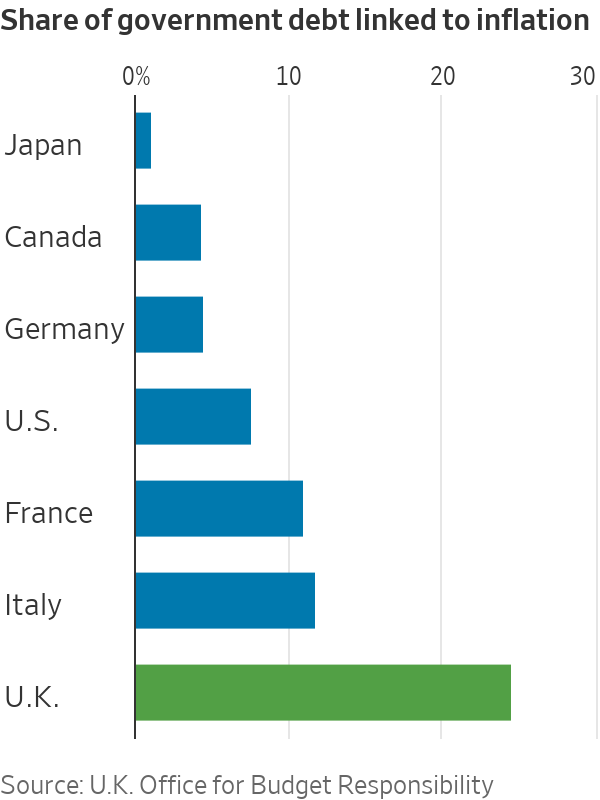
“We stick out like a sore thumb,” said Sanjay Raja, chief U.K. economist at Deutsche Bank.
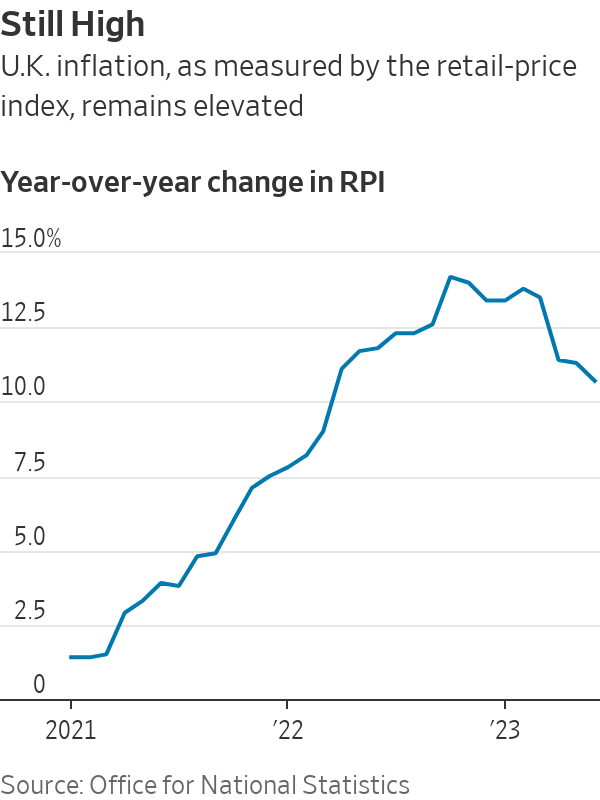
The U.K.’s debt woes are complicated by its longstanding reliance on a measure of price increases that has fallen out of favour: the retail price index, or RPI. Some 600 billion pounds, equivalent to roughly $770 billion, of bonds are linked to this gauge, which has consistently risen faster than more widely used consumer-price indexes. London has pledged to phase out RPI by 2030.
Inflation as measured by the RPI topped 14% in October and was still 11% in June compared with a year earlier. Economists expect U.K. inflation to keep falling this year, albeit more slowly than in other major economies.
In theory, higher interest payouts should be balanced by rising revenue. While higher inflation means bigger payouts to bondholders, it should also bring in more taxes.
That logic holds especially true in markets like the U.K., where inflation gauges are deeply embedded in the economy. Tax thresholds, pension and welfare payments, rail fares and cellphone bills are often linked to price indexes.
But the energy shock that fuelled recent inflation upended that math, since higher energy bills drove up RPI even as earnings and consumer spending lagged behind. The U.K. is experiencing the “wrong sort of inflation,” the U.K.’s Office for Budget Responsibility said this month. The sensitivity of U.K. debt to inflation was unprecedented, the watchdog said.
The U.K.’s debt sustainability is a focus for investors after a market meltdown last fall, triggered by then-Prime Minister Liz Truss’s tax-cutting plans.
Her successor Rishi Sunak and his Chancellor Jeremy Hunt have sought to restore market confidence with pledges to contain inflation and bring down debt. As the U.K.’s interest costs climb, and with debt now surpassing 100% of gross domestic product, those promises are getting harder to keep while maintaining investor confidence.
The debt burden also undermines Sunak’s hopes to woo voters and revive the economy with tax cuts and spending measures ahead of a general election expected to take place next year.
“We could quickly be in a situation where we’re facing some renewed sense of crisis, particularly with an economic backdrop of stagflation with really weak growth and overshooting inflation,” said Mark Dowding, chief investment officer at RBC BlueBay Asset Management in London. “Further policy missteps could easily be punished by the market.”
Higher bond yields and stickier inflation will add an extra £30 billion to the U.K.’s annual government debt bill, estimates Bank of America economist Robert Wood.
“The government has three options: You can plan for weaker spending, you could raise taxes or you could borrow more,” he said. “Certainly one could say that this rise in debt-interest costs is incompatible with cutting taxes.”
The U.K. is selling fewer linkers, which are likely to make up 11% of bond issuance this fiscal year, down from above 20% throughout the 2010s.
One veteran U.K. central banker said linkers had largely done their job as envisioned in the 1980s.
“We were coming out of a decade in which inflation had been extremely high. People were very skeptical about the ability of any government, particularly the Conservative government, to bring inflation down to a low and stable rate,” said Charles Goodhart, who was an adviser at the Bank of England between 1969 and 1985.
Fears that linkers would lead to fresh wage-price spirals as unions demanded inflation-linked increases, didn’t play out, he said. Thatcher, who called inflation “the destroyer of all,” saw linkers as “sleeping policemen,” ensuring the government wasn’t tempted to let inflation run to help inflate debt away.
“It makes the current fiscal position more difficult. But that’s what Mrs. Thatcher actually wanted,” said Goodhart. “She wanted governments to resist inflation more strongly.”
Companies are also feeling the pressure from inflation-linked borrowing. The U.K.’s largest water company, Thames Water, nearly collapsed in recent weeks as investors questioned its ability to repay £14 billion in debt, about half of which is linked to inflation. Thames Water’s debt is RPI-linked, but customer prices now track CPI, which lags behind the RPI by about 3 percentage points more slowly.
 Copyright 2020, Dow Jones & Company, Inc. All Rights Reserved Worldwide. LEARN MORE


As housing drives wealth and policy debate, the real risk is an economy hooked on growth without productivity to sustain it.

Limited to 630 units, Lamborghini’s latest Urus Capsule pushes personalisation further than ever, blending hybrid performance with over 70 bespoke design combinations.


As housing drives wealth and policy debate, the real risk is an economy hooked on growth without productivity to sustain it.
3 minFor decades, Australia has leaned into its reputation as the lucky country. But luck, as it turns out, is not an economic strategy.
What once looked like resilience now appears increasingly fragile. Beneath the surface of rising property values and steady headline growth, the Australian economy is showing signs of strain that can no longer be ignored.
Recent data paints a sobering picture. Australia has recorded one of the largest declines in real household disposable income per capita among advanced economies.
Wages have failed to keep pace with inflation, meaning many Australians are working harder for less. On a per capita basis, income growth has stalled and, at times, reversed.
And yet, on paper, things still look relatively solid. GDP is growing. Unemployment remains low. But that growth is increasingly being driven by population expansion rather than productivity.
More people are contributing to output, but not necessarily improving living standards.
That distinction matters.
For years, Australia’s economic success rested on a powerful combination: a once-in-a-generation mining boom, a credit-fuelled housing market, strong migration and a property sector that rarely faltered. Between 1991 and 2020, the country avoided recession entirely, building enormous wealth in the process.
But much of that wealth is tied to property. Around two-thirds of household wealth sits in real estate, inflated by leverage and sustained by demand. It has worked, until now.
The problem is the supply side of the economy has not kept up.
Housing supply is falling behind population growth. Rental vacancies are near record lows.
Construction firms are collapsing at an elevated rate. At the same time, massive infrastructure pipelines are competing with residential projects for labour and materials, pushing costs higher and delaying delivery.
The result is a system under pressure from all angles.
Despite near full employment, productivity growth has stagnated for years. In simple terms, Australians are putting in more hours without generating more output per hour. The economy is running faster, butgoing nowhere.
Meanwhile, government spending continues to expand. Public debt is approaching $1 trillion, with spending now accounting for a record share of GDP.
The gap between spending and revenue has been filled by borrowing for decades, adding further pressure to an already stretched system.
This is where the uncomfortable question emerges.
Has Australia become too reliant on a model driven by rising property values, expanding credit and population growth?
As asset prices rise, households feel wealthier and borrow more. Banks lend more. Governments collect more revenue. Migration fuels demand. The cycle reinforces itself.
But when productivity stalls and debt outpaces real income, the system begins to depend on constant expansion just to stay stable.
It is not a collapse scenario. But it is not particularly stable either.
Nowhere is this more evident than in housing.
The National Housing Accord targets 1.2 million new homes over five years, yet current completion rates are well below that pace. With approvals falling and construction costs rising, the gap between supply and demand is widening, not narrowing.
Housing is also one of the largest contributors to inflation, with costs rising sharply across rents, construction and utilities. Yet the private sector, from small investors to major developers, is struggling to make projects stack up in the current environment.
This brings the policy debate into sharper focus.
Tax settings such as negative gearing and capital gains concessions have undoubtedly boosted demand over the past two decades. But they have also supported supply. Removing them may ease prices briefly, but risks deepening the supply shortage over time.
That is the paradox.
Policies designed to make housing more affordable can, in practice, make the shortage worse if they discourage development. The optics may appeal, but the economics are far less forgiving.
It is also worth remembering that most property investors are not institutional players. The majority own just one investment property. They are, in many cases, ordinary Australians using real estate as their primary wealth-building tool.
Undermining that system without replacing it with a viable alternative risks unintended consequences, from reduced supply to higher rents and increased inflation.
So where does that leave Australia?
At a crossroads.
The country can continue to rely on population growth and rising asset prices to drive economic activity. Or it can shift towards a model built on productivity, innovation and sustainable growth.
The latter is harder. It requires structural reform, long-term thinking and political discipline.
But it is also the only path that leads to genuine, lasting prosperity.
The question is no longer whether Australia has been lucky.
It is whether it can evolve before that luck runs out.
Paul Miron is the Co-Founder & Fund Manager of Msquared Capital.

MAISON de SABRÉ’s new Spring Harvest Collection turns everyday produce into collectible leather charms and introduces fresh silhouettes in its cult Bucket bag family.

From snow-dusted valleys to festival-filled autumns, Bhutan reveals itself as a rare destination where culture, nature and spirituality unfold year-round.