The year of investing wisely
Savvy investors in the Asia Pacific are putting their money into real estate, but it’s not where you think
 < 1 min
Experienced investors are adopting a ‘wait and see’ approach for the start of the year, a new report on investment intentions in the Asia Pacific region reveals.
The 2023 Asia Pacific Investor Intentions Survey released by global real estate and investment firm CBRE this week examined responses from more than 500 investors across the region.
It found that while the fundraising market remained ‘healthy’, many were taking a back seat as lower yields and the impacts of interest rate hikes played out.
Although industrial and logistic real estate assets proved to be the most popular options, there was growing interest in the residential sector for built-to-rent and multifamily properties. Multifamily properties are where there are several separate dwellings on the same site, such as duplexes, townhouses or apartments.
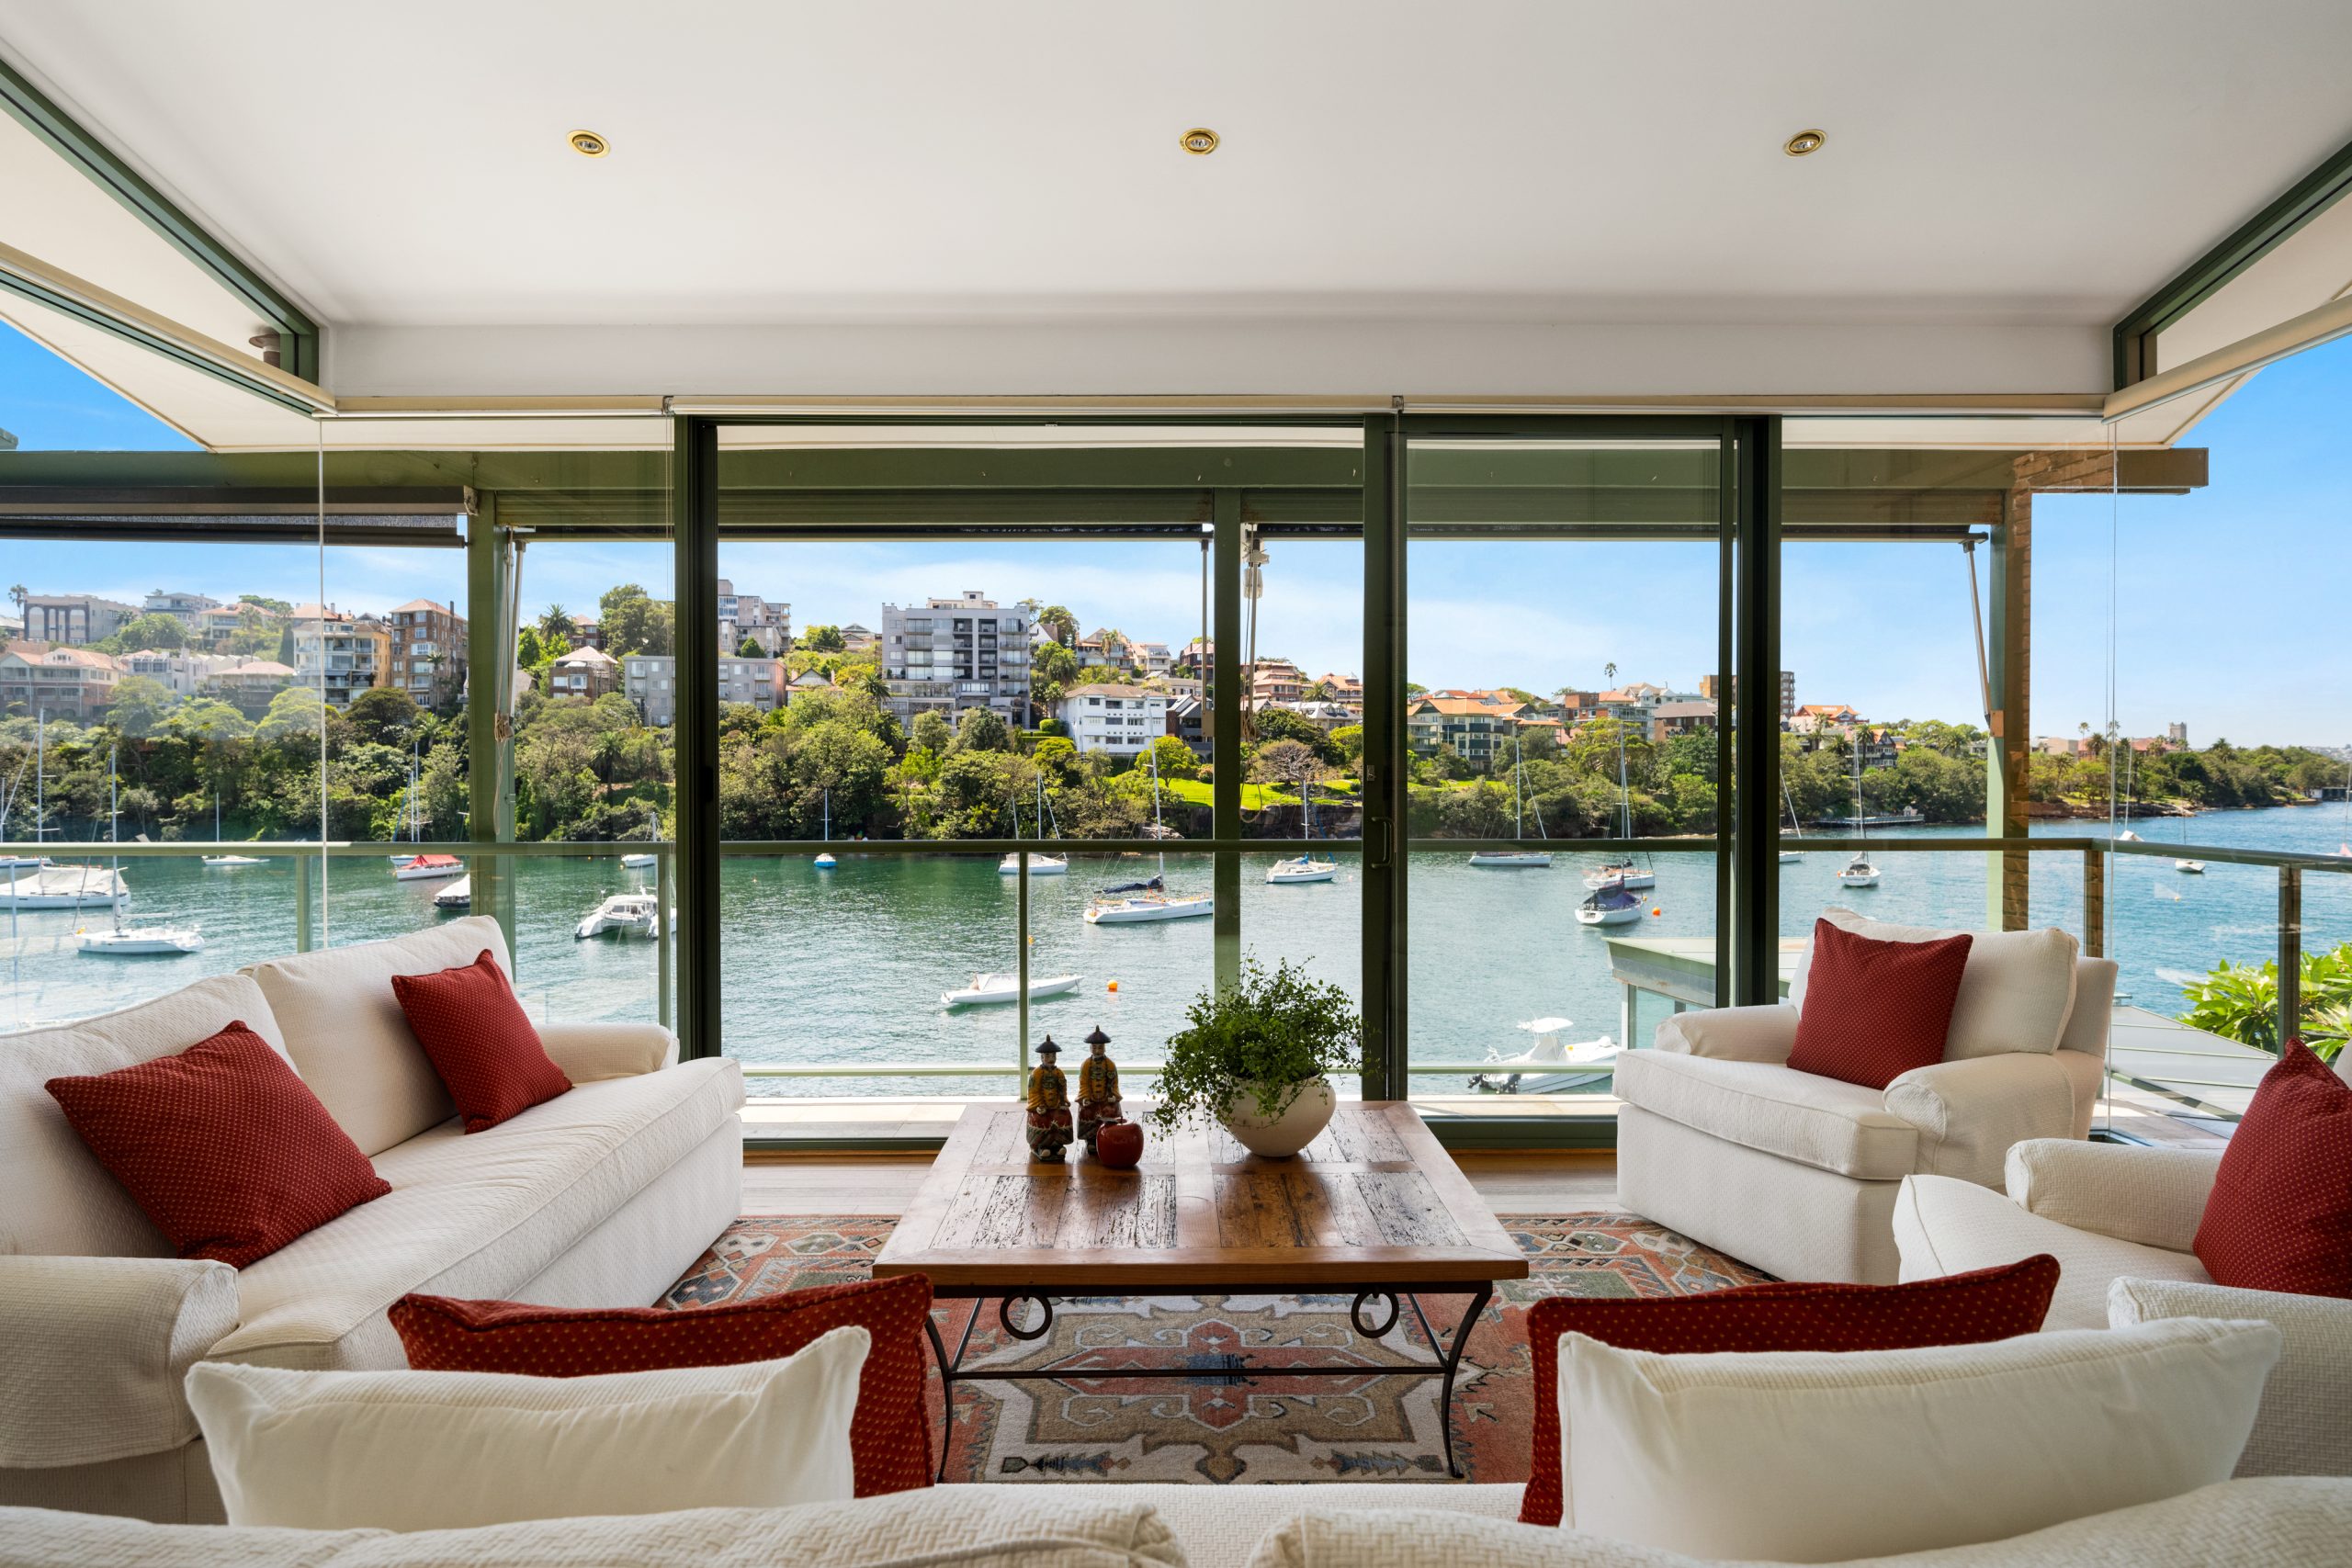
Weekend auction activity in Sydney last weekend bore out this trend, with fierce bidding for a block of four two-bedroom Art Deco units in Clovelly. Selling agent Theo Karangis of NG Farah said there was strong interest from families looking to buy the whole block on behalf of their children. It eventually went under the hammer for $5.05m.
The CBRE survey also revealed that properties in the healthcare sector are proving desirable in the Asia Pacific, overtaking data centres, although available stock remains low.
The outlook for 2023 remains positive, the report found, with investors keeping a close an eye distressed opportunities and price dislocations.
As housing drives wealth and policy debate, the real risk is an economy hooked on growth without productivity to sustain it.

Limited to 630 units, Lamborghini’s latest Urus Capsule pushes personalisation further than ever, blending hybrid performance with over 70 bespoke design combinations.


As housing drives wealth and policy debate, the real risk is an economy hooked on growth without productivity to sustain it.
3 minFor decades, Australia has leaned into its reputation as the lucky country. But luck, as it turns out, is not an economic strategy.
What once looked like resilience now appears increasingly fragile. Beneath the surface of rising property values and steady headline growth, the Australian economy is showing signs of strain that can no longer be ignored.
Recent data paints a sobering picture. Australia has recorded one of the largest declines in real household disposable income per capita among advanced economies.
Wages have failed to keep pace with inflation, meaning many Australians are working harder for less. On a per capita basis, income growth has stalled and, at times, reversed.
And yet, on paper, things still look relatively solid. GDP is growing. Unemployment remains low. But that growth is increasingly being driven by population expansion rather than productivity.
More people are contributing to output, but not necessarily improving living standards.
That distinction matters.
For years, Australia’s economic success rested on a powerful combination: a once-in-a-generation mining boom, a credit-fuelled housing market, strong migration and a property sector that rarely faltered. Between 1991 and 2020, the country avoided recession entirely, building enormous wealth in the process.
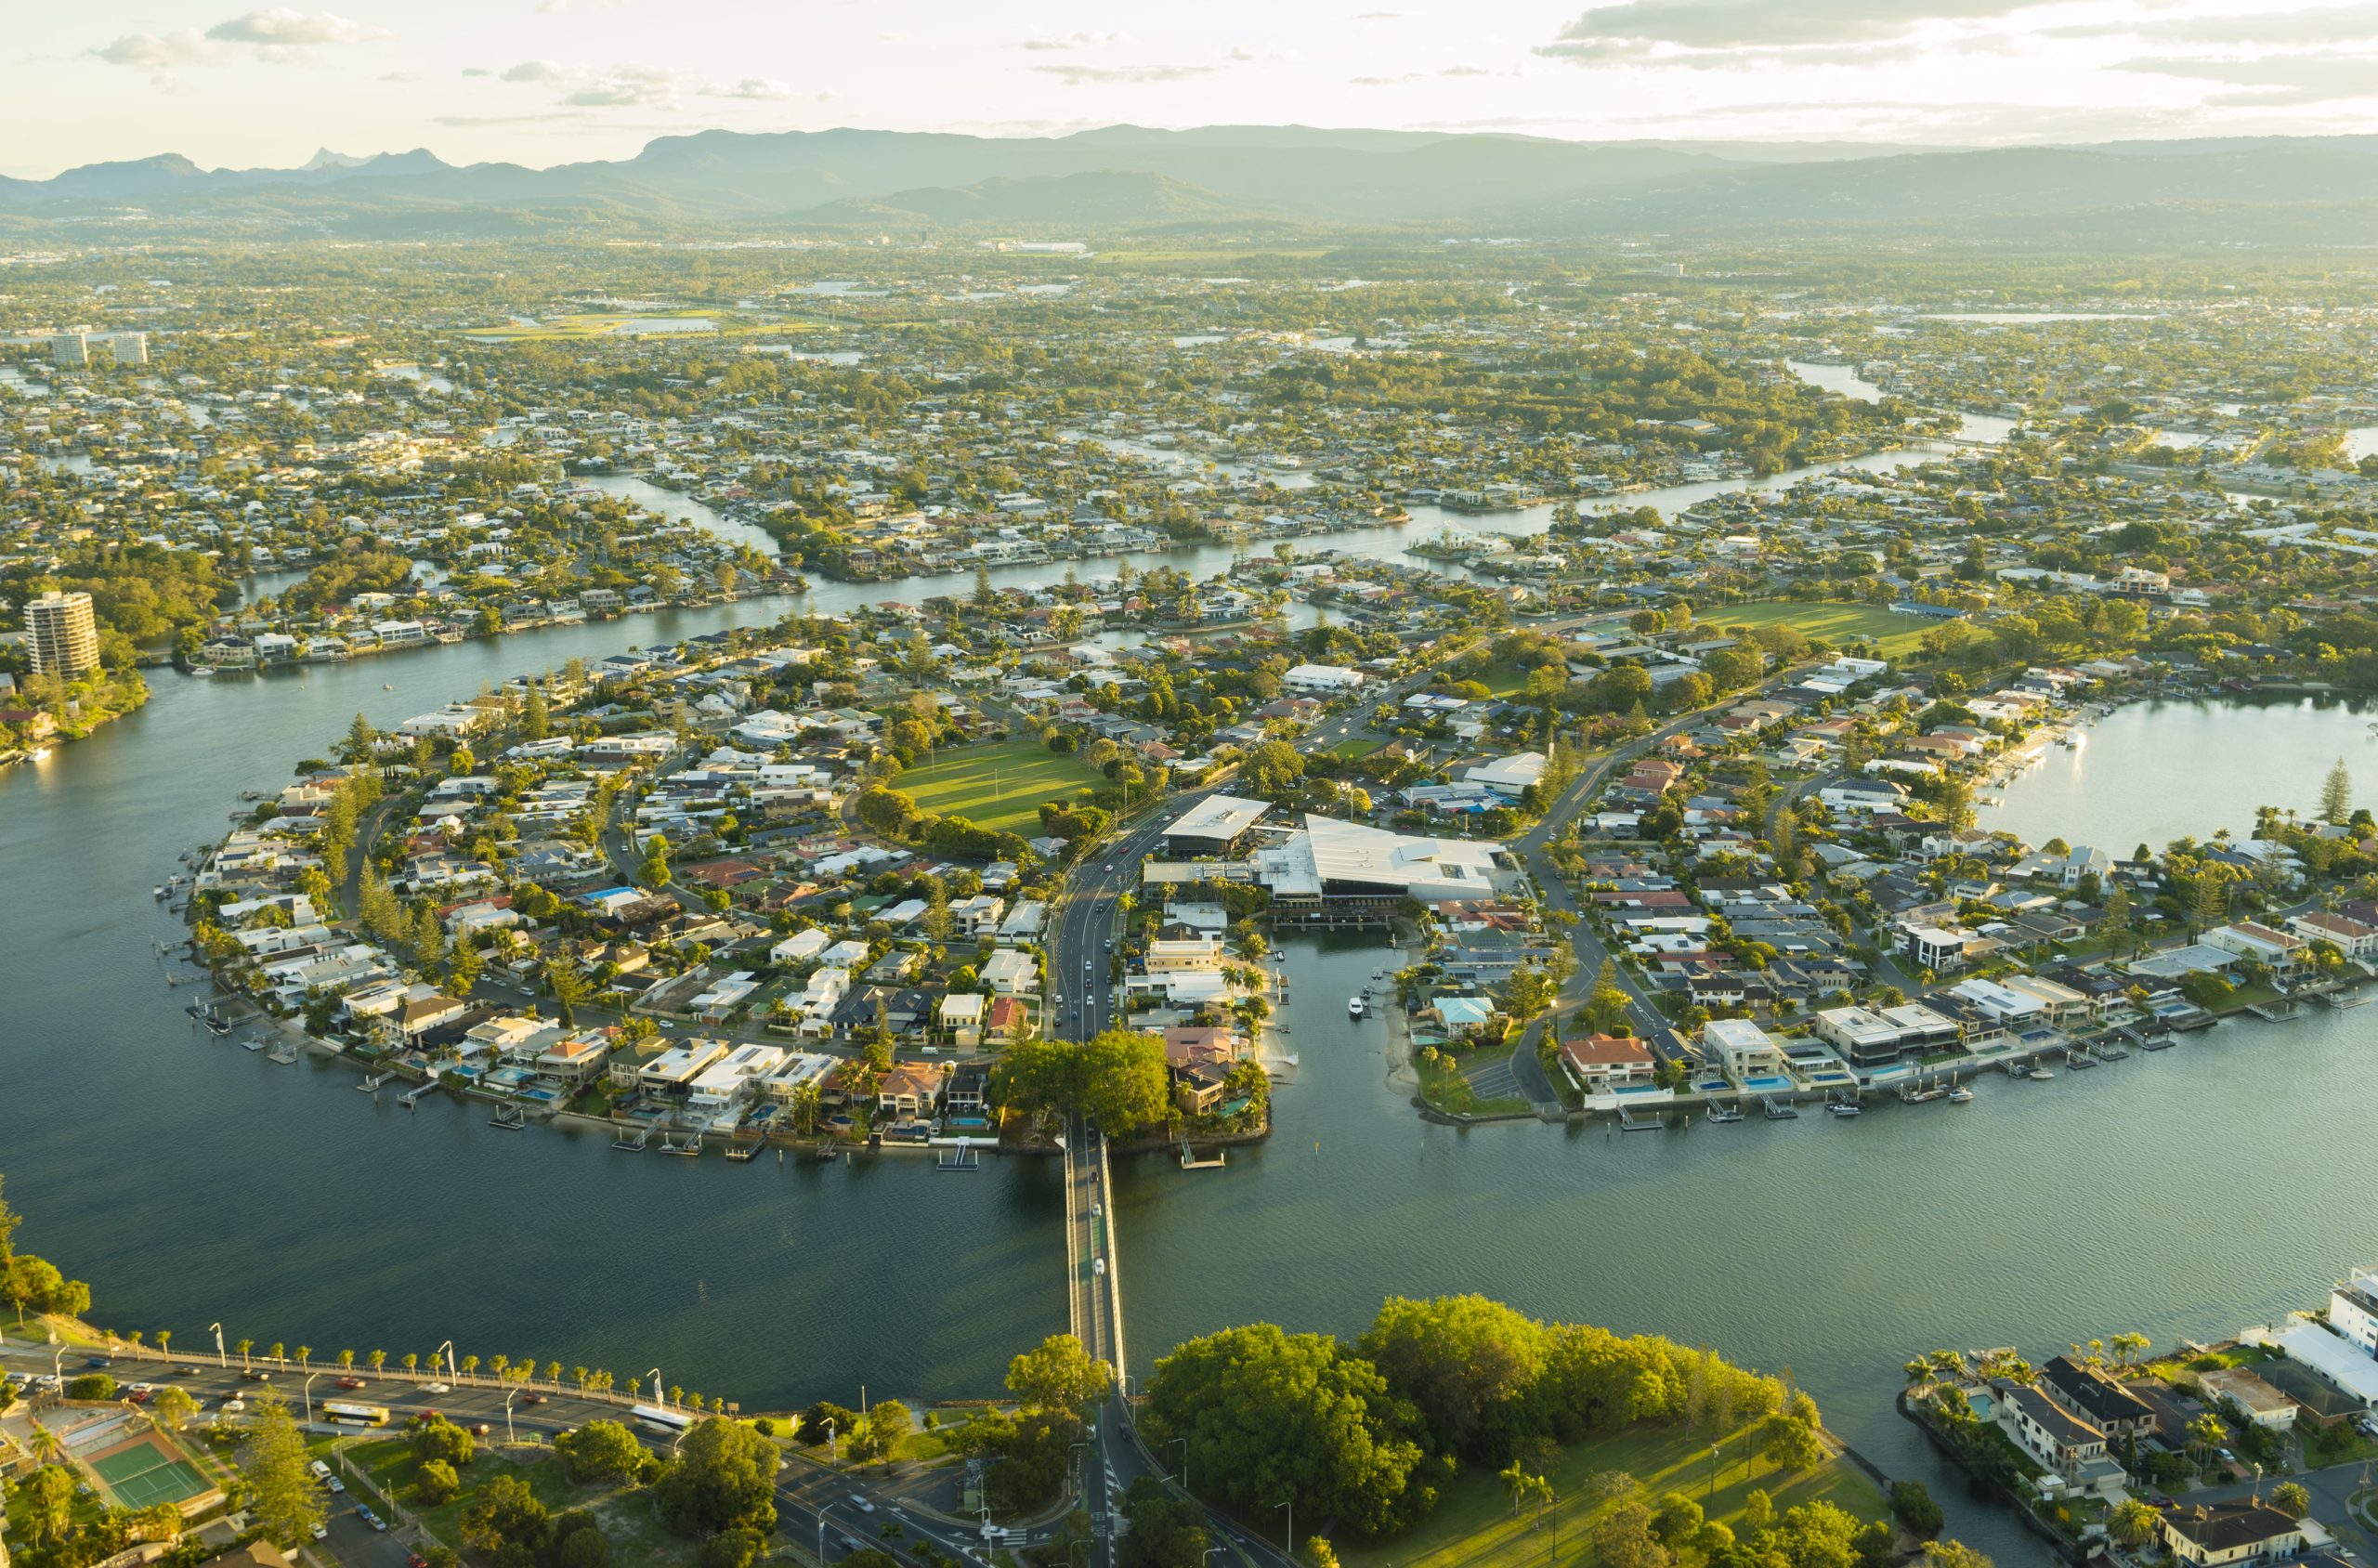
But much of that wealth is tied to property. Around two-thirds of household wealth sits in real estate, inflated by leverage and sustained by demand. It has worked, until now.
The problem is the supply side of the economy has not kept up.
Housing supply is falling behind population growth. Rental vacancies are near record lows.
Construction firms are collapsing at an elevated rate. At the same time, massive infrastructure pipelines are competing with residential projects for labour and materials, pushing costs higher and delaying delivery.
The result is a system under pressure from all angles.
Despite near full employment, productivity growth has stagnated for years. In simple terms, Australians are putting in more hours without generating more output per hour. The economy is running faster, butgoing nowhere.
Meanwhile, government spending continues to expand. Public debt is approaching $1 trillion, with spending now accounting for a record share of GDP.
The gap between spending and revenue has been filled by borrowing for decades, adding further pressure to an already stretched system.
This is where the uncomfortable question emerges.
Has Australia become too reliant on a model driven by rising property values, expanding credit and population growth?
As asset prices rise, households feel wealthier and borrow more. Banks lend more. Governments collect more revenue. Migration fuels demand. The cycle reinforces itself.
But when productivity stalls and debt outpaces real income, the system begins to depend on constant expansion just to stay stable.
It is not a collapse scenario. But it is not particularly stable either.
Nowhere is this more evident than in housing.
The National Housing Accord targets 1.2 million new homes over five years, yet current completion rates are well below that pace. With approvals falling and construction costs rising, the gap between supply and demand is widening, not narrowing.
Housing is also one of the largest contributors to inflation, with costs rising sharply across rents, construction and utilities. Yet the private sector, from small investors to major developers, is struggling to make projects stack up in the current environment.
This brings the policy debate into sharper focus.
Tax settings such as negative gearing and capital gains concessions have undoubtedly boosted demand over the past two decades. But they have also supported supply. Removing them may ease prices briefly, but risks deepening the supply shortage over time.
That is the paradox.
Policies designed to make housing more affordable can, in practice, make the shortage worse if they discourage development. The optics may appeal, but the economics are far less forgiving.
It is also worth remembering that most property investors are not institutional players. The majority own just one investment property. They are, in many cases, ordinary Australians using real estate as their primary wealth-building tool.
Undermining that system without replacing it with a viable alternative risks unintended consequences, from reduced supply to higher rents and increased inflation.
So where does that leave Australia?
At a crossroads.
The country can continue to rely on population growth and rising asset prices to drive economic activity. Or it can shift towards a model built on productivity, innovation and sustainable growth.
The latter is harder. It requires structural reform, long-term thinking and political discipline.
But it is also the only path that leads to genuine, lasting prosperity.
The question is no longer whether Australia has been lucky.
It is whether it can evolve before that luck runs out.
Paul Miron is the Co-Founder & Fund Manager of Msquared Capital.

From Italy’s $93,000-a-night villas to a $20,000 Bowral château, a new global ranking showcases the priciest Airbnbs available in 2026.

Paine Schwartz joins BERO as a new investor as the year-old company seeks to triple sales.