


U.S. Inflation Slowed for Sixth Straight Month in December
Consumer-price index rose 6.5% last month from a year earlier

 4 min

U.S. inflation eased in December for the sixth straight month following a mid-2022 peak as the Federal Reserve aggressively raised interest rates and the economy showed signs of cooling.
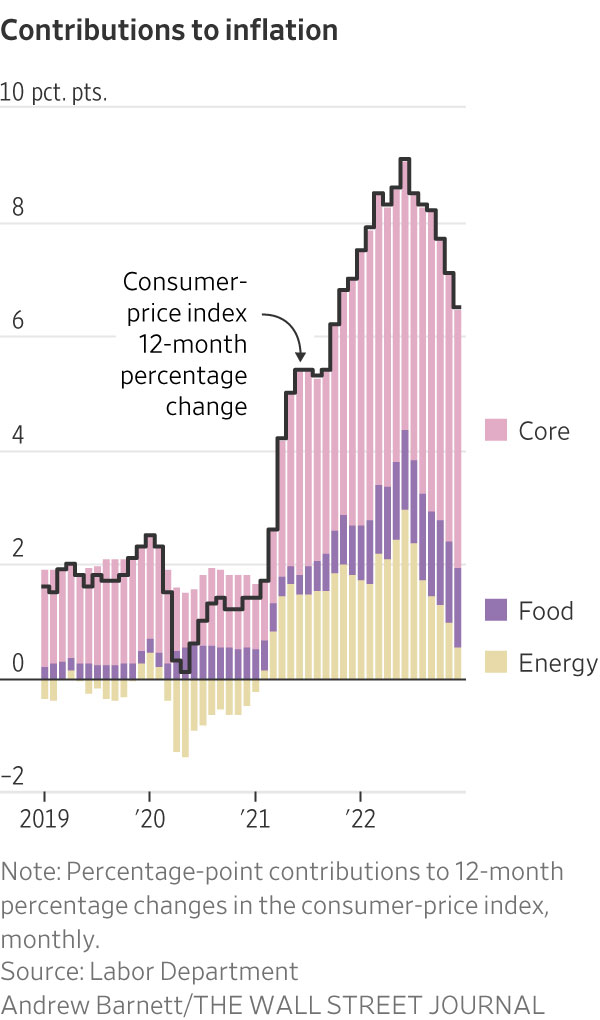
The consumer-price index, a measurement of what consumers pay for goods and services, rose 6.5% last month from a year earlier, down from 7.1% in November and well below a 9.1% peak in June.
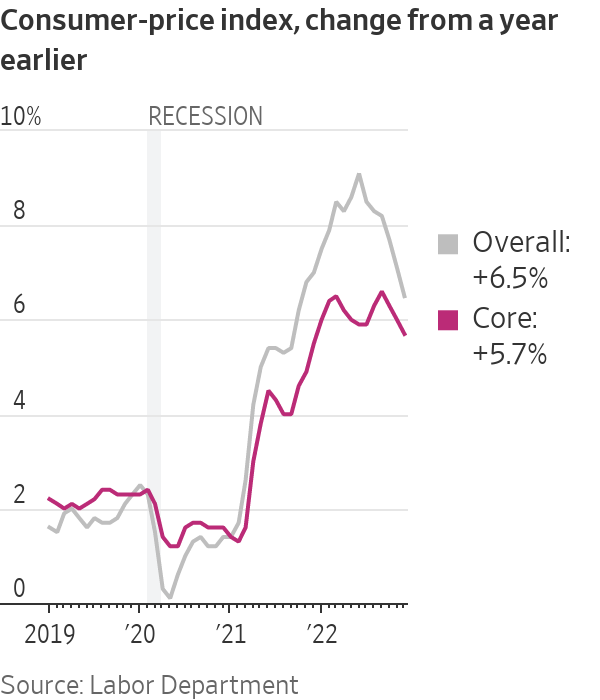
Core CPI, which excludes volatile energy and food prices, climbed 5.7% in December from a year earlier, easing from a 6% gain in November. Many economists see increases in core CPI as a better signal of future inflation than the overall CPI. Core prices increased at a 3.1% annualised rate in the three months ended in December, the slowest pace in more than a year and down from 7.9% in June.
The figures added to signs that inflation is turning a corner following last year’s surge. They also likely keep the Fed on track to reduce the size of interest-rate increases to a quarter-percentage-point at their meeting that concludes on Feb. 1, down from a half-percentage point increase in December.
U.S. stocks climbed Thursday and investors bought U.S. Treasurys, lifting bond prices and weighing on yields. The S&P 500 added 0.3%, while the Dow Jones Industrial Average gained 0.6%, or 217 points. The technology-heavy Nasdaq Composite also rose 0.6%.
Easing inflation follows several signs that U.S. economic activity cooled in late 2022. U.S. imports and exports fell in November from October, while retail sales, manufacturing output and home sales all declined. Job and wage growth slowed in December, though the labor market remained tight with historically low claims for unemployment insurance at the start of the year.
“The December CPI report was welcome good news after a very bad patch for inflation,” said Bill Adams, chief economist at Comerica Bank. He said consumers are getting relief from lower gasoline prices and moderating food prices, as well as declining prices for other goods.
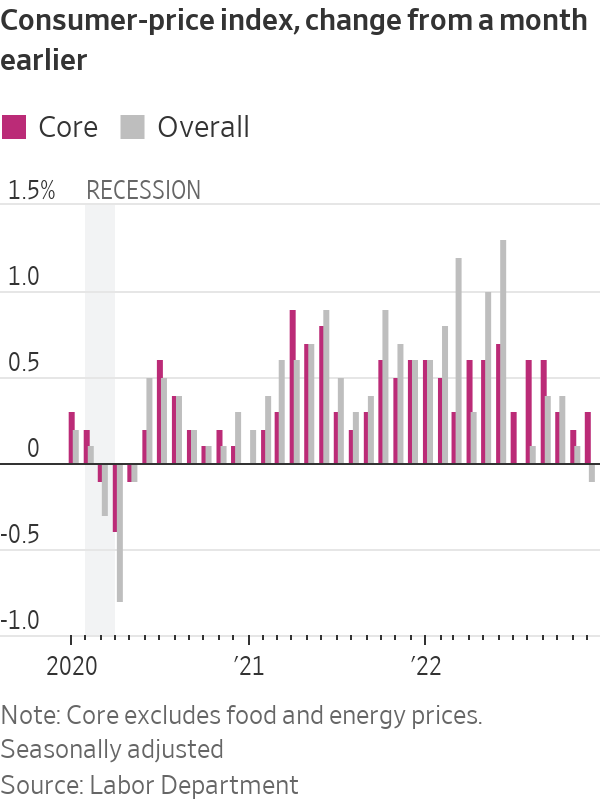
On a monthly basis, the CPI fell 0.1% in December, due to sharply falling energy prices. That compared with a gain of 0.1% in November and 0.4% in October. Food-price increases also slowed last month. Core CPI rose 0.3% in December, up from November’s 0.2% rise but down from 0.6% increases in August and September.
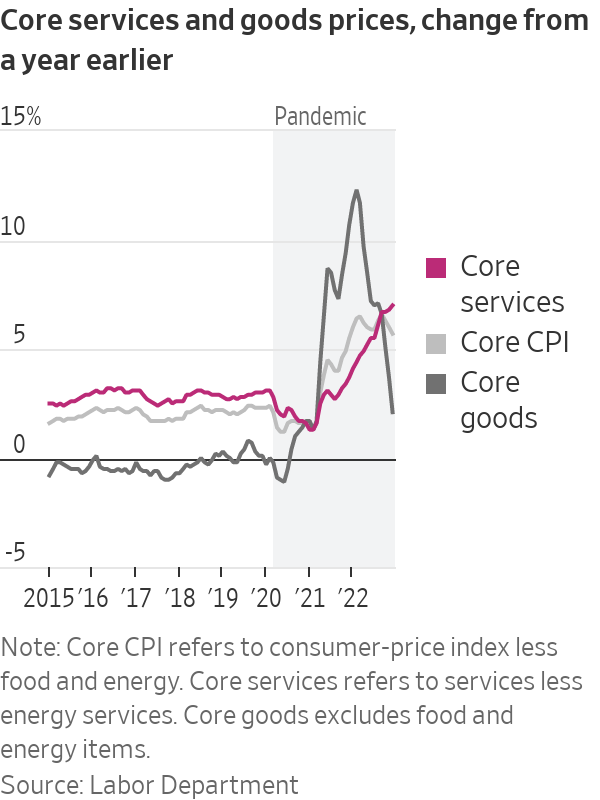
Goods prices, a key driver of inflation over the past year and a half, fell for the third straight month in December as prices fell for products such as autos, computers and sporting goods.
Improving supply chains and reduced demand have relieved price pressures on goods, but services prices continued to climb in part because of wage gains in a tight labour market.
Some economists worry that still-high wage growth could keep consumers flush with cash and companies eager to raise prices to compensate, holding inflation above the Fed’s 2% target.
“Taming services inflation will be the Fed’s biggest challenge this year,” said Ryan Sweet, chief U.S. economist at Oxford Economics.
Shelter prices rose 7.5% in December from a year earlier, the Labor Department said, and a broader measure of services prices that excludes utilities rose 7% during the same period. Both increases were the biggest since 1982.
Daycare and preschool prices rose 5.4% in December from a year earlier, the biggest increase since 2006, while those for home-health care increased 6.1% in the same period. Hospital services prices, meanwhile, jumped 1.5% in December from the prior month, the sharpest monthly increase since 2015.
Inflation remained high across the globe in November, though it abated during the month, the Organization for Economic Cooperation and Development said Tuesday. Consumer prices across the Group of 20 largest economies—which contribute four-fifths of economic output worldwide—rose 9% from a year earlier in November, down from October’s 9.5% increase, the first drop in the G-20 inflation rate since August 2021.
Prices rose sharply in 2021 as the U.S. economy rebounded from the Covid-19 pandemic, powered by pent-up consumer spending that got a boost from low interest rates and government stimulus. Snarled supply chains fueled higher prices for many goods. Russia’s invasion of Ukraine in early 2022 also tightened supplies of energy and other commodities, further stoking inflation worldwide.
Inflation pressures on goods dissipated last summer as supply chains improved and energy prices fell. Shipping costs from China to the West Coast are near pre pandemic levels. Gasoline prices have declined, with the national average price of regular unleaded gasoline at $3.27 a gallon on Thursday, down about 50 cents a gallon from mid-November, according to OPIS, an energy-data and analytics provider. Gasoline prices peaked in mid-June at a record $5.02 a gallon.
“Logistics prices have also slowed materially, shipping costs are back to where they were pre-Covid,” said Jake Oubina, senior economist at Piper Sandler. “The alleviation on the cost side is creating the wherewithal to discount more aggressively as we head into 2023.”
The clearest impact of Fed tightening so far is in the housing market. Existing-home sales fell in November for a 10th straight month as high mortgage rates boosted buyers’ costs.
Ian Snowden, a 33-year-old tech salesman, said the shift to remote work after the pandemic hit allowed him to move to Asheville, N.C., where he has easy access to hiking, fishing and other outdoor activities.
The move proved expensive, though. After losing out to cash buyers in bids for existing homes, Mr. Snowden signed a contract in September 2021 to buy a newly constructed property. By the time his home was completed the following June, mortgage rates had doubled. On top of that, the construction company told him that he was on the hook for an extra $25,000 to offset unexpectedly high costs for concrete, labor and other items—or he could back out of the contract.
At that point, Mr. Snowden said, he was already selling his old house and had made plans to move, so he wasn’t going to back out. “So much was already in motion,” he said. Between the higher mortgage rates and the additional costs, the monthly mortgage payment increased $200, he said.
—Austen Hufford contributed to this article.
 Copyright 2020, Dow Jones & Company, Inc. All Rights Reserved Worldwide. LEARN MORE



From making unpopular decisions to learning when to listen, leaders from five businesses reveal what nobody prepared them for — and how running a company has challenged their expectations.

Technology and semiconductor shares fell sharply as investors questioned the debt financing the AI infrastructure boom and confronted higher rates and Chinese competition.
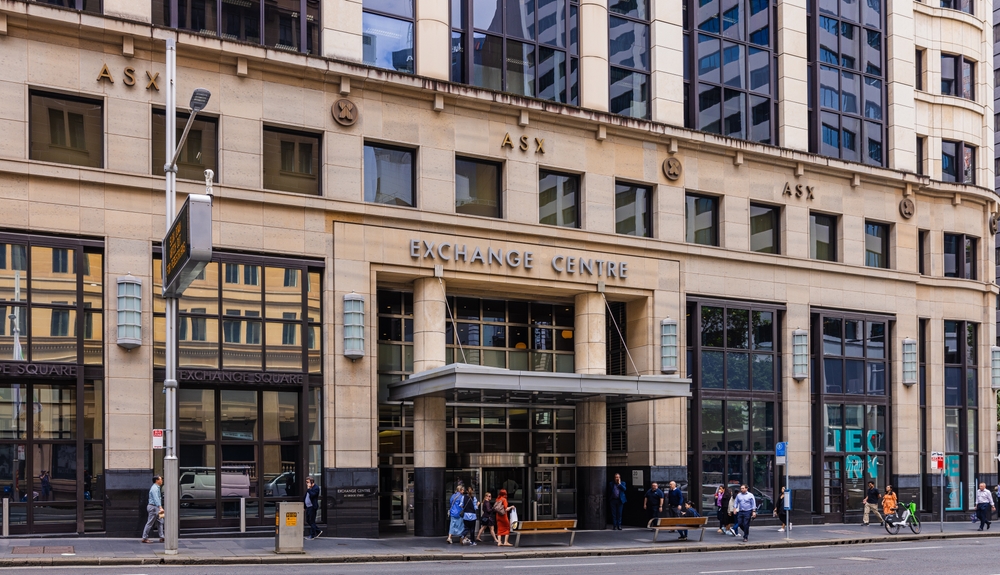
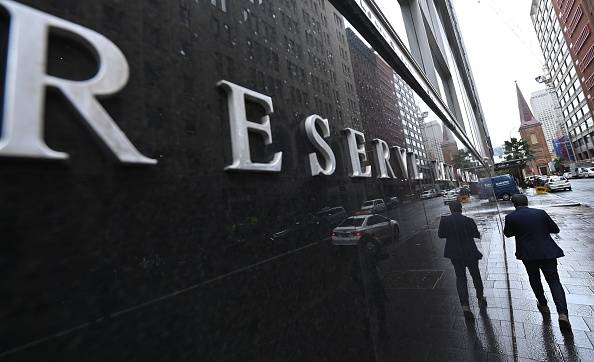
Technology and semiconductor shares fell sharply as investors questioned the debt financing the AI infrastructure boom and confronted higher rates and Chinese competition.
4 minA sharp technology sell-off has exposed a new anxiety on global markets: whether the enormous borrowing behind the artificial-intelligence infrastructure boom can generate sufficient returns as interest rates rise and Chinese competition intensifies.
The artificial-intelligence investment boom has powered technology shares, semiconductor manufacturers and data-centre operators to extraordinary heights. Last week, investors were given a reminder that much of this expansion is being built with borrowed money.
The technology-heavy Nasdaq Composite fell 4.5 per cent over the week ended October 16, its weakest performance since late June. Semiconductor shares suffered an even deeper correction, with the Philadelphia Semiconductor Index losing about 11.4 per cent.
The selling spread quickly through global markets. Micron Technology fell 14.6 per cent over the week, while South Korea’s Samsung Electronics and SK Hynix dropped approximately 18 per cent and 24 per cent respectively.
This was more than a routine bout of profit-taking. Investors were reassessing three interconnected risks: higher interest rates, the rapidly expanding debt burden attached to AI infrastructure and the prospect of stronger competition from Chinese memory-chip manufacturers.
The debt behind the AI build-out
Artificial intelligence requires a physical infrastructure network of enormous scale. Data centres must be built, advanced processors purchased, power supplies secured and cooling systems installed before customers begin generating meaningful revenue from them.
Technology companies are increasingly supplementing their own cash with corporate bonds, syndicated loans, equipment leases, private credit and project-level financing.
JPMorgan describes the emerging funding model as a combination of conventional corporate borrowing and project finance tied to individual data-centre assets. In Australia, the Reserve Bank estimates that syndicated loans accounted for approximately three-quarters of data-centre financing during 2025 and 2026 to date.
The numbers are becoming large enough to affect broader credit markets. The Federal Reserve Bank of Dallas has cited Wall Street estimates suggesting AI-related investment-grade bond issuance could approach US$300 billion in 2026 alone.
That borrowing is not automatically problematic. Debt can be an efficient way to finance long-lived infrastructure when future revenue is sufficiently predictable. The concern is that AI technology, customer demand and computing economics are changing much faster than the repayment schedules attached to the assets.
A data centre financed today may carry debt for years. Investors must therefore make assumptions about future utilisation rates, electricity prices, chip performance, customer concentration and the amount businesses will ultimately pay for AI computing.
When interest rates rise, those assumptions become less forgiving.
Inflation changes the calculation
September’s US inflation data intensified the pressure. Consumer prices increased 3.7 per cent over the year, ahead of market expectations and up from 3.4 per cent in August.
The hotter reading reduced confidence that interest rates would fall quickly and pushed bond yields higher. That matters particularly for companies whose valuations depend on profits expected well into the future, as well as highly leveraged infrastructure operators that may need to refinance.
CoreWeave has emerged as a closely watched test case. The specialist cloud-computing company has accumulated substantial debt and lease obligations to build AI capacity, while relying on a concentrated group of large technology customers.
Its shares fell sharply during the sell-off, while the cost of insuring its debt against default climbed. CoreWeave has argued that its contracted backlog more than covers its obligations and that financial markets do not always understand its business model. Nevertheless, its securities have become a proxy for investor confidence in debt-funded AI infrastructure.
Oracle, another major investor in AI computing capacity, fell 8.8 per cent in Friday trading, while CoreWeave dropped 15.5 per cent.
The question is shifting from how much AI infrastructure can be built to how profitably it can be operated.
China adds another source of pressure
Interest rates were not the only catalyst. Reports of advances by Chinese memory-chip producer ChangXin Memory Technologies raised concerns that lower-cost Chinese products could increase competition across the global semiconductor industry.
Memory chips are essential to AI systems, but the industry is historically cyclical. Periods of tight supply and high pricing can encourage rapid investment, eventually producing oversupply and falling margins.
The prospect of a well-funded Chinese competitor expanding its technological capabilities unsettled investors in Samsung, SK Hynix and Micron. It also demonstrated that AI-related demand does not insulate chipmakers from conventional competitive pressures.
That combination—slower rate cuts, more expensive financing and potentially cheaper supply—challenged the assumption that every company exposed to AI would enjoy continually expanding margins.
A reset rather than the end of the boom
The sell-off does not establish that the AI boom is ending. Demand for computing power remains strong, the largest technology companies continue to generate formidable cash flows and many infrastructure projects are backed by long-term customer contracts.
What has changed is the market’s willingness to overlook the price and financing structure of that growth.
The most resilient companies are likely to be those able to fund investment from operating cash flow, secure long-duration customers and demonstrate that new capacity will earn returns comfortably above its financing costs.
More speculative operators may face greater scrutiny, particularly where debt is expensive, customers are concentrated or expected revenue depends on demand that has not yet materialised.
For Australian investors, the lesson extends beyond US technology shares. Local data-centre operators, infrastructure funds, electricity suppliers and property groups are increasingly exposed to the same investment cycle.
Artificial intelligence may remain one of the defining growth themes of the decade. But last week’s correction showed that enthusiasm for the technology does not eliminate financial discipline.
The next stage of the AI boom will be judged not only by computing power, model performance or demand for chips, but by something more traditional: whether the assets being financed can generate enough cash to repay the money borrowed to build them.
Fact box
Nasdaq Composite: Down 4.5 per cent for the week ended October 16, 2026
Philadelphia Semiconductor Index: Down approximately 11.4 per cent
Micron Technology: Down approximately 14.6 per cent
Samsung Electronics: Down approximately 18 per cent
SK Hynix: Down approximately 24 per cent
US September inflation: 3.7 per cent annually
Estimated 2026 AI-related investment-grade issuance: Approximately US$300 billion

Following the successful launch of its Palais Collection, MAISON de SABRÉ has unveiled a new modular handbag system offering more than 720 styling combinations.

Australian shares fell on Thursday as Wall Street weakness, rising oil and persistent rate concerns weighed on most of the market. The S&P/ASX 200 declined 0.72 per cent to 8,702. The All Ordinaries lost 0.66 per cent to finish at 8,897. Mining stocks were hit particularly hard, while real estate also dragged on the index. …
Continue reading “ASX falls 0.7 per cent as miners and property stocks retreat”