


Value Investing Is Back. But for How Long?
A bounce in bond yields is good news for dividend payers.

 3 min
3 min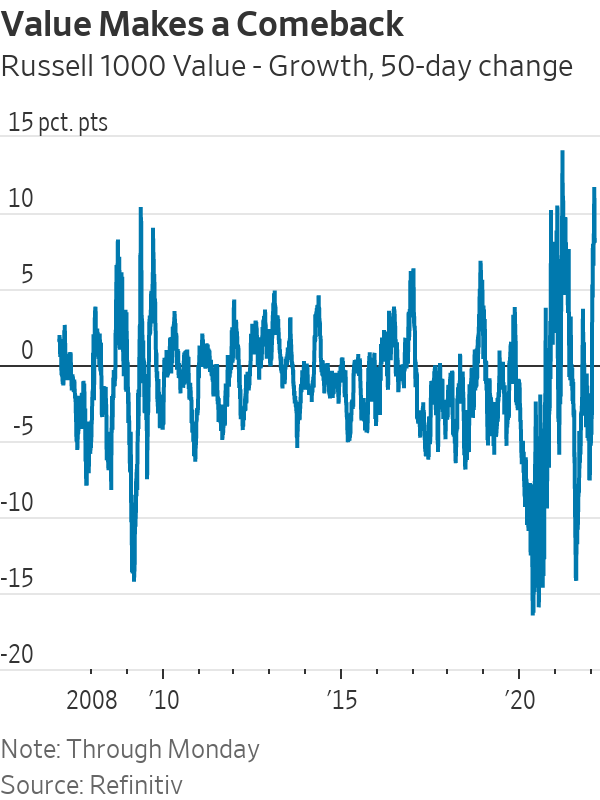
Value investing—buying stocks that are cheap on measures such as earnings or book value—is having a renaissance. Up to last Thursday, large value stocks beat more expensive “growth” stocks by the most of any 50-day period since the technology bubble burst in 2000-01, with the exception of the post-vaccine rebound early last year.
The big question for investors: Does this mark the rebirth of what was a dying strategy? Or was this just another spasm, already fading as technology stocks rebound?
The answer depends in large part on the role of rising Treasury yields. Bond yields have leapt since early December, as expectations grew that the Federal Reserve would raise rates aggressively this year to tackle inflation. That coincided with a tumble in growth stocks, dragging the Nasdaq index to within a whisker of a bear market, down almost 20% from its November peak.
One interpretation is that the leap in yields was the pin that pricked the bubble in growth stocks, shocking investors out of their lazy assumption that Big Tech just always went up. For hard-core value investors (and after years of underperformance, they have to be hard-core), this marks the moment when the purchase of cheap stocks can return to its rightful place as a leading strategy.
Cliff Asness, founder of quantitative fund manager AQR, thinks it is plausible that the bond-yield rise was the shock that changed investor views on growth stocks. “It’s a catalyst not because of solid economic reasons but because catalysts for when irrationality will blow up are behavioural magic, not economics,” he argues.
I think this explanation works for the truly speculative growth stocks. A cluster of wildly expensive crypto, clean energy, meme stocks and SPACs have been deflating since early last year, when bond yields also soared. They plunged again as yields jumped this year, with the Ark Innovation exchange-traded fund—which holds many highly speculative stocks—falling 34% this year to Friday’s low. (By Monday’s close it was up 17% from that low.)
The link between bond yields and speculative growth stocks is clearly extremely loose, because their price is dominated by sentiment—Mr. Asness’s “behavioural magic”—not by spreadsheets of discounted cash flow.
Larger stocks can, of course, be dominated by sentiment too, as shown by the involvement of huge telecom, media and technology stocks in the dot-com bubble of 2000. But most of the time there is a tighter focus on the outlook for earnings and the discount rate.
It is that discount rate that provides the alternative interpretation for why growth stocks sold off as bond yields rose: mathematics. The valuation even of highly profitable companies such as Microsoft is high because they are expected to keep growing earnings at a high rate for a long time, and those far-in-the-future earnings are worth more today when the discount rate, based on bond yields, is lower. As that discount rate rises, those future earnings should be worth less to an investor.
In the bond market, this idea is known as the duration of a bond, the average time it takes for the cash from it to add up to the price you pay for it. The longer it is, the more sensitive the price is to changes in the yield. One example: The price of the 30-year Treasury bond fell more than 10% from its Dec. 3 high to its mid-January low, as its yield rose just 0.5 percentage point, because the low yield meant it had an exceptionally long duration of 23 years.
Something similar happened to stocks this year. The longer their duration, the more they fell, using the dividend yield as a simple proxy for the duration.
Because growth stocks have the highest duration (the lowest dividends), and value stocks the lowest (the highest dividends), value had a wonderful time. As bond yields have pulled back a bit, or at least their upward climb has been interrupted, growth stocks rebounded.
The trouble with this explanation is that the link between bond yields and bigger gains for value stocks isn’t super strong, and changes over time. Even in the past year, long-dated bond yields and a pure measure of value stocks only moved together about 30% of the time, and that relationship has been weaker recently.
Partly that is because other things matter too; most important, the market’s assessment of the economy’s strength has a big effect on value stocks.
But markets move with the heart as well as the head. Mr. Asness is right that sentiment matters, and it may be turning back in favour of value, helped by the math. I think bond yields are a bigger factor. If I’m right, the danger is that the Fed, geopolitics or supply problems might lead yields to pull back, and value’s recent strength evaporates.
Reprinted by permission of The Wall Street Journal, Copyright 2021 Dow Jones & Company. Inc. All Rights Reserved Worldwide. Original date of publication: February 1, 2022.
 Copyright 2020, Dow Jones & Company, Inc. All Rights Reserved Worldwide. LEARN MORE


This stylish family home combines a classic palette and finishes with a flexible floorplan

Just 55 minutes from Sydney, make this your creative getaway located in the majestic Hawkesbury region.


More than one fifth of Australians are cutting back on the number of people they socialise with
< 1 min
Australian social circles are shrinking as more people look for ways to keep a lid on spending, a new survey has found.
New research from Finder found more than one fifth of respondents had dropped a friend or reduced their social circle because they were unable to afford the same levels of social activity. The survey questioned 1,041 people about how increasing concerns about affordability were affecting their social lives. The results showed 6 percent had cut ties with a friend, 16 percent were going out with fewer people and 26 percent were going to fewer events.
Expensive events such as hens’ parties and weddings were among the activities people were looking to avoid, indicating younger people were those most feeling the brunt of cost of living pressures. According to Canstar, the average cost of a wedding in NSW was between $37,108 to $41,245 and marginally lower in Victoria at $36, 358 to $37,430.
But not all age groups are curbing their social circle. While the survey found that 10 percent of Gen Z respondents had cut off a friend, only 2 percent of Baby Boomers had done similar.
Money expert at Finder, Rebecca Pike, said many had no choice but to prioritise necessities like bills over discretionary activities.
“Unfortunately, for some, social activities have become a luxury they can no longer afford,” she said.
This stylish family home combines a classic palette and finishes with a flexible floorplan
Just 55 minutes from Sydney, make this your creative getaway located in the majestic Hawkesbury region.