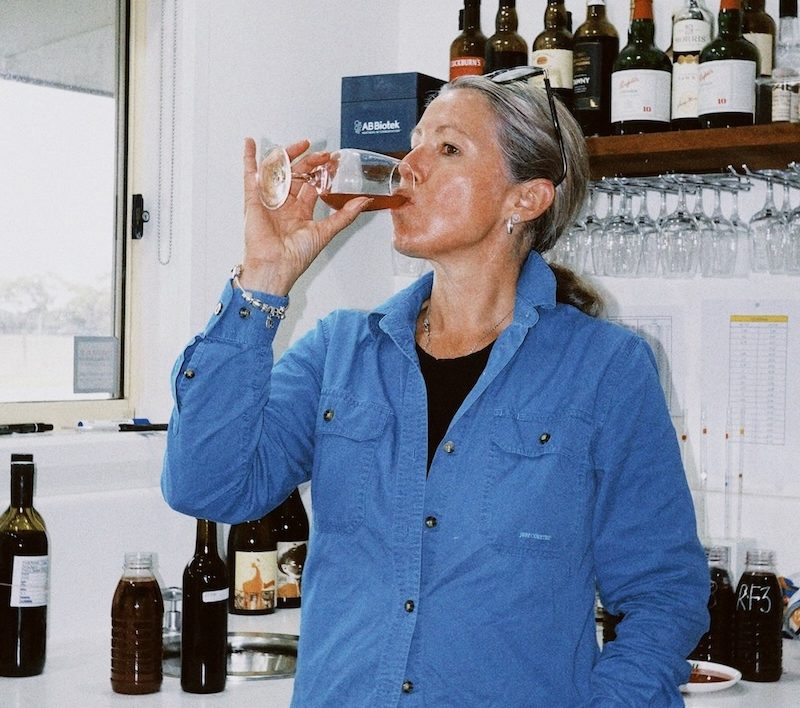
What it takes to be considered wealthy in Australia
Property price surges propelled Australia into third position in the world, wealth report reveals
 2 min
2 min
The amount of money needed to be among Australia’s top one percent has doubled over the past two years, a new report has revealed.
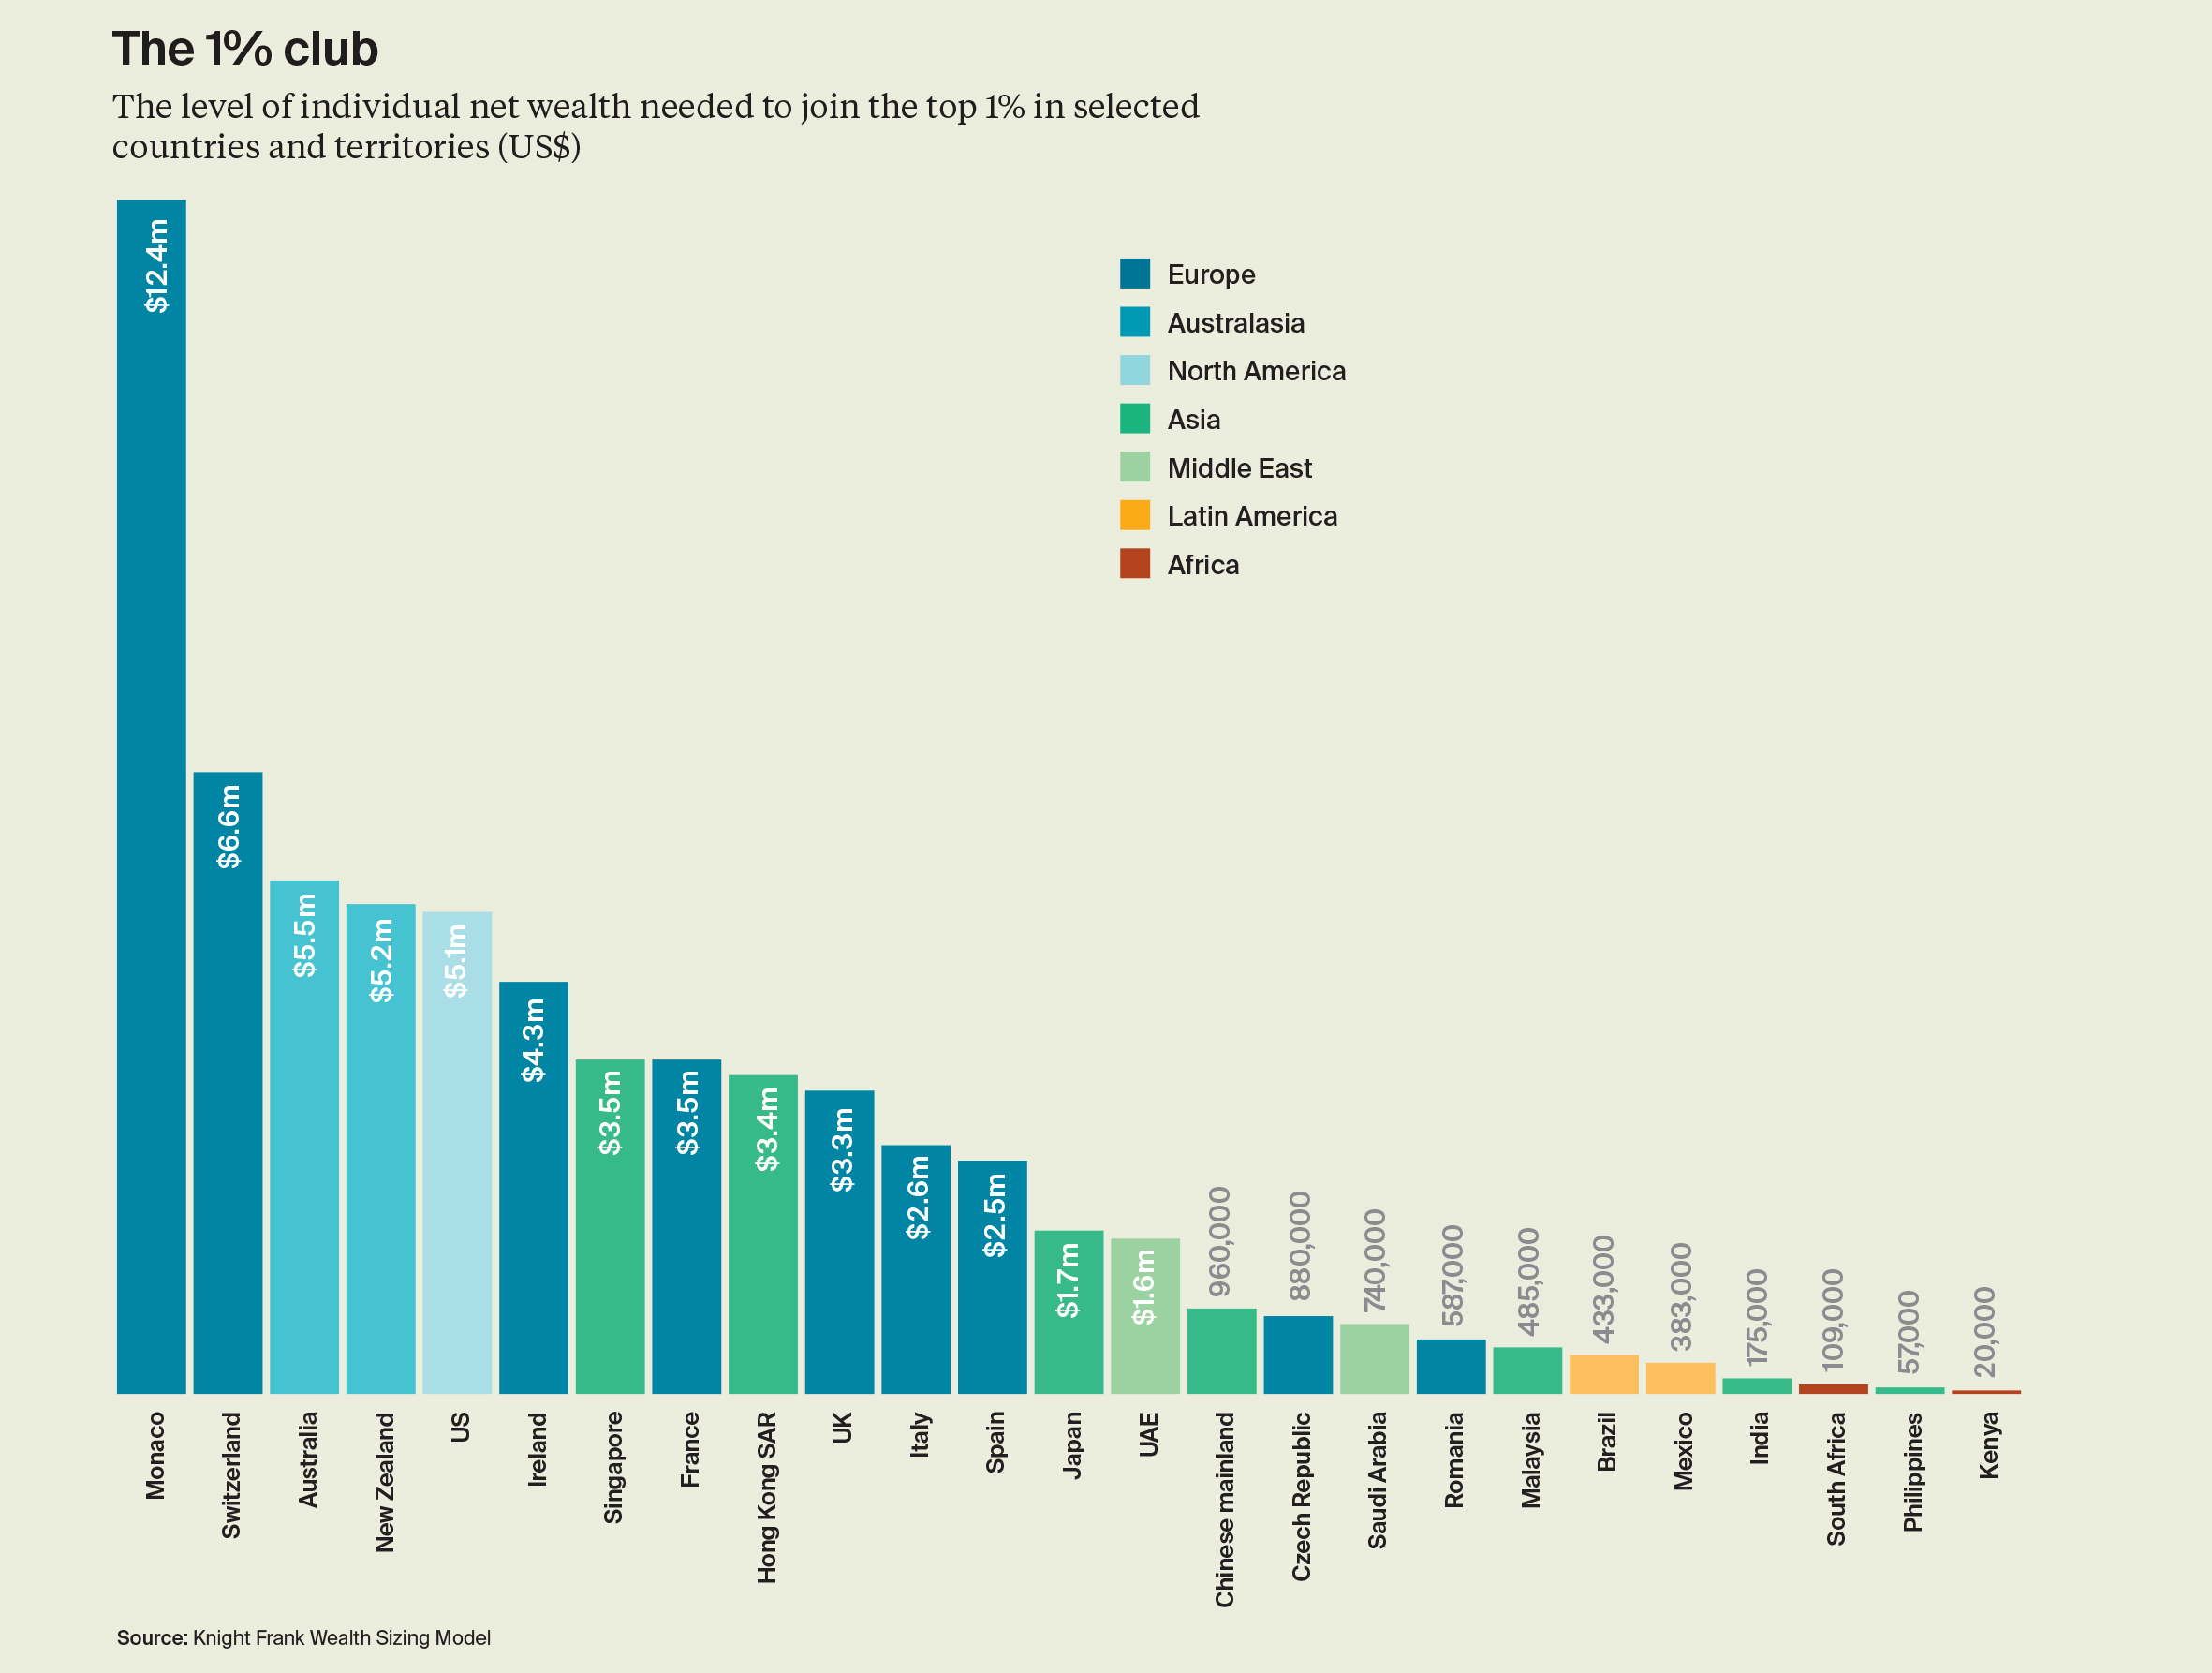
The Wealth Report 2023 released by Knight Frank today shows that to be amongst those in the country’s high net worth individuals in 2023, Australians require a minimum of US$5.5m, up from US$2.8m in 2021. The findings place Australia in third place, beyond Monaco and Switzerland in terms of the money required to be considered among the wealthiest in the country, up from seventh position just two years ago.
Based on current trends, that figure is set to rise significantly over the next five years, the report said, with the number of high net worth individuals set to rise by 71.1 percent and ultra high net worth individuals increasing by 40.9 percent.
To be counted among ultra high net worth individuals, according to Knight Frank, would require net wealth exceeding US$30m.
Knight Frank’s head of residential research Australia, Michelle Ciesielski property was a key driver of wealth in Australia.
“A large contributor to the top one percent wealth level doubling in Australia over the past two years has been prime residential property performance recording an upward trajectory, resilient despite the rising cost of finance, as we know 49 percent of this cohort tend to be cash buyers,” she said. “On average, the (ultra high net worth) UHNW population in Australia owns 2.9 homes, or equivalent to 36 percent of their total wealth is in primary and secondary homes.”
Ms Ciesielski cautioned that with more Australians struggling to get a foot on the property ladder and increasing attention on sustainability, assets held by high net worth individuals may come under greater scrutiny.
“It’s notable that the ongoing inequality of global wealth could see a greater focus on this group – particularly in terms of greater taxation on assets to support government spending throughout the pandemic, and even emissions as countries seek to develop sustainable strategies for the environment and society.”

Ophora Tallawong has launched its final release of quality apartments priced under $700,000.

From bushland greens to valley reds, the country’s most awarded designers are proving that the best colour palette was never on a swatch card; it was outside the window all along.


The federal budget has rattled property investors. But the biggest mistake isn’t the tax changes, it’s the conclusion many are drawing from them.
2 min
The recent budget has forced a reckoning for property investors.
Negative gearing now restricted to new residential builds, the CGT discount gone and on paper, the numbers look different.
And many investors are responding by pivoting toward yield, prioritising cash flow over capital growth in a way that property strategists say misses the point entirely.
“The debate has shifted to yield versus growth as if they are opposing forces,” says Abdullah Nouh, founder of Melbourne-based buyers’ agency Mecca Property Group. “But that framing is itself the mistake.”
Nouh, who works with high-net-worth families and investors on long-term acquisition strategy, argues that capital growth remains the primary driver of genuine wealth creation and that the post-budget environment has made quality assets more important, not less.
The numbers make his case plainly. An additional $500 per week in rental income is welcome. A prestige asset appreciating by $1 million over a market cycle is transformative.
These are not equivalent outcomes, and portfolios built around yield at the expense of location and land value tend to generate income while wealth stands largely still.
The more nuanced shift Nouh is seeing among sophisticated investors is a move toward assets where both outcomes can be engineered simultaneously – established homes on substantial land in quality locations, where the existing dwelling can be repositioned, rental returns improved, and the underlying land value compounds independent of what sits on it.
For investors with existing equity, commercial property is also entering the conversation in a more serious way.
Prestige industrial assets, medical centres and long-leased essential retail offer income profiles that residential property in most capital city markets cannot currently match: longer lease terms, tenants covering outgoings, and greater predictability than the residential tenancy cycle.
“The investors who build lasting wealth are rarely the ones who chased yield or growth exclusively,” says Nouh.
“They are the ones who built a strategy they could sustain – one that generated enough income to hold quality assets through multiple cycles while those assets compounded in value.”
The budget has changed the settings. It has not changed the fundamentals.

A survey of people with at least $1 million in investable assets found women in their 30s and 40s look nothing like older generations in terms of assets and priorities

The sports-car maker delivered 279,449 cars last year, down from 310,718 in 2024.