What You Should Know About Investing In Commodities
Recent strong performance has attracted a lot of neophytes. They may have much to learn.

 5 min
5 min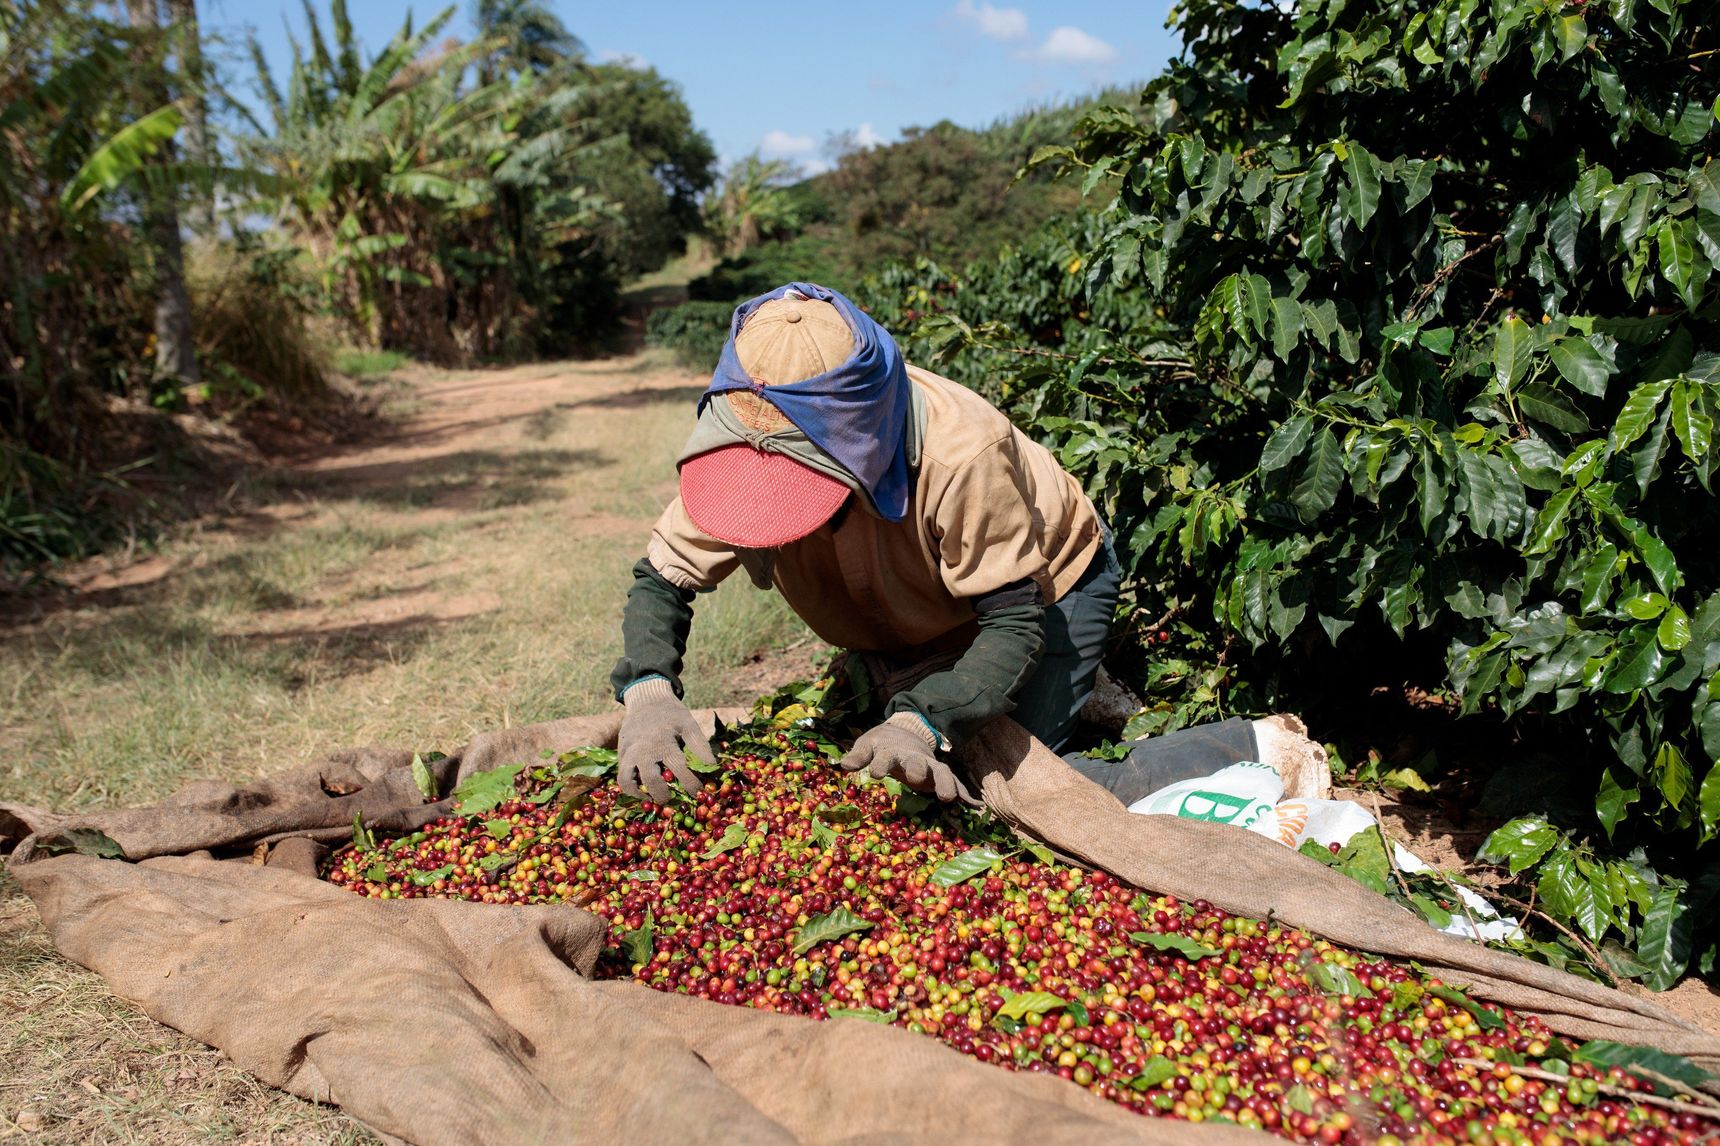
After years in the investing wilderness, commodities are hot again. And it looks as if the rally may continue for at least the foreseeable future, some analysts say.
The speed of the rally has been striking. The Refinitiv/CoreCommodity CRB Index, which tracks a basket of commodities selected to represent prices of futures contracts across the whole sector, doubled from April 2020 through mid-February.
That performance follows a yearslong period when the index trended lower. And the surge is now attracting investors of all types—from veterans to neophytes.
The latter would do well to understand some of the basics in how commodity investing works. Commodities typically get grouped into three broad buckets: energy, foodstuffs and materials. Each has endemic risks, including weather, local and geopolitics.
Each also offers the possibility of direct investment, in the commodities themselves, or indirect investment, through vehicles such as mutual funds and exchange-traded funds. For the relatively inexperienced, direct investing in commodities can be particularly challenging, in part because of additional costs and risks generally not found in other types of investing. We’ll get to those details in a moment.
What follows is a look at some of the basics of commodity investing.
Complicated economics
The price of each commodity gets determined by the supply and demand dynamics for that item. For instance, last year bad weather in Brazil hurt the coffee crop and pushed up the cost of beans. Likewise, an attack on an oil-refining plant in the Middle East will tend to disrupt supplies and spark an energy-market rally.
Commodity markets are global. What happens in one country can have an impact on commodity prices world-wide. Therefore, all commodity investors should keep an eye on what’s happening not just in the U.S. but around the world.
While even just the risk of war can send prices higher for commodities, particularly those that originate in the countries directly involved, actual invasion tends to send those prices even higher. That is exactly what happened with the conflict between Ukraine and Russia as both countries are leading exporters of foodstuffs. Although the invasion began on Feb. 24, prices were rising long before. A bushel of wheat is fetching $13.48, up 77% from $7.61 at the beginning of February on fears that global supplies would be disrupted. Likewise, corn prices have rallied 21% over the same period. Such surges added to those already happening in the commodity markets. Even before the war, unfavourable weather- and pandemic-related disruptions across the world were reducing supplies and sending prices higher when production couldn’t keep up with demand.
Sometimes a price change in one commodity causes the cost of another one to move as well. One typical example is in livestock farming. Farmers sometimes switch from feeding hogs or cattle with costly grain to less-pricey alternatives. They might decide to buy corn from arable farmers instead of wheat or vice versa depending on the relative prices. In turn, those prices change to reflect the new demand for each product. This phenomenon shouldn’t be too surprising. Imagine if the cost of aged blue Stilton increases at the supermarket; at least some people will likely switch to a less-expensive cheese.
Price swings
Unlike commodity traders and other professionals whose direct positions in oil or grain might change from second to second, average investors in commodities will have longer time frames in mind for their commodity-related holdings. But a simple buy-and-hold strategy here won’t help you accumulate wealth as it would in the stock market.
Commodity prices can frequently trend lower for decades. New technologies, such as better farming techniques or methods of mineral extraction, have allowed supplies to increase over time, depressing prices.
For instance, oil hit a record high of around $147 a barrel in 2008 versus the current price of $115.68. Likewise, Arabica coffee prices peaked at $3.35 a pound in 1977 versus $2.24 now. When these prices get adjusted for inflation, the declines look starker.
Thus, even for individual investors in commodity-related investments, timing in these markets can be critical. Whether you think of your investment as short term or long term, investors need to pay attention to buy at the right moment and sell at an auspicious one. Lean-hog prices tripled from 37 cents a pound in April 2020 to $1.20 in June 2021 before collapsing to 72 cents in October. Anyone not ready for such swings will be in for a shock and an emotional roller coaster.
Adding commodities to a larger balanced portfolio can also help reduce risks as commodity prices tend to have low correlation to other assets such as stocks and bonds. That means when the S&P 500 falls, commodity prices may go up, or down, or not move at all.
One more advantage to investing directly in commodities rather than commodity companies is that a layer of risk is removed. When investing in stock there is always the possibility that management may make mistakes even when the underlying sector economics are favorable.
The futures market
Commodity investors typically don’t operate in the cash market, meaning they don’t purchase physical materials such as metals, oil, or foodstuffs. Instead, traders mostly buy or sell futures contracts in the hope of benefiting from the increase or decrease in prices. These contracts are legally binding agreements to buy or sell a specific volume of a commodity on a specific date in the future.
Ultimately, the prices in the futures market and those in the cash market will tend to converge. That’s why commodity producers and consumers use futures to hedge the risks of market price movements.
No dividends
Most stocks pay dividends to investors, meaning you can make money even if the share prices don’t move. Pretty much the opposite is true for commodity investors. It costs money to own commodities. For example, a buyer of 100 ounces of gold bullion will need to cover the costs of storage and insurance for the metal. While such expenses can be low for precious metals, they can stack up faster for crude oil and grains such as wheat and corn as more extensive facilities are needed to hold the stuff.
Mutual funds & ETFs
For fund investors, there are many choices. More than 150 mutual funds and ETFs cover the sector. Unfortunately, that means much due diligence is required. In short, it’s essential to understand what the fund owns and what its strategy is.
Just as with stocks, there are both passive funds (those that track a benchmark index) and active ones (those that follow a discretionary investing strategy).
In the passive category, some track the price of single commodities, such as SPDR Gold Shares ETF (GLD) and Invesco DB Gold Fund (DGL), which track slightly different benchmarks. Likewise, there is an ETF for wheat, Teucrium Wheat (WEAT). There are also passive funds that are designed to track groups of commodities, such as Invesco DB Base Metals (DBB), or the whole sector, such as iShares S&P GSCI Commodity-Indexed Trust (GSG).
Actively managed funds, such as the active ETF First Trust Global Tactical Commodity Strategy Fund (FTGC), make decisions on what commodities to buy or sell.
A warning on leveraged funds
There are a couple of wrinkles to watch out for with all types of funds. First, average investors should avoid any fund that uses leverage to enhance performance. Such funds often promise to deliver two or three times the performance of a given commodity. While that means such funds can deliver multiplied profits, they also magnify losses.
Other funds claim that they’ll mimic an inverse performance so that if a commodity’s price falls, the fund will increase in value by a similar amount. This isn’t the same as a hedge against losses unless the trade is made specifically to diversify risk within a larger portfolio. Another problem with these funds is that there can be significant tracking errors. These funds are best left to sophisticated investors.
It’s also worth being cautious about exchange-traded notes, or ETNs. This type of investment can expose investors to the risk that the fund company goes bust. ETFs and mutual funds protect investors against such events.
As with all investing, investors should find funds with low expense ratios. Annual fund expenses mainly range from 0.5% to 1%. Leveraged funds tend to have expenses of 1% and more. These compare with costs of 0.09% for SPDR S&P 500 ETF, which tracks the S&P 500.
Riches and rags
Investing guru Jim Rogers famously made a boatload of money during the 1970s investing in the commodity markets while material prices and food costs jumped. And there will likely be other people who do similarly again.
However, even the most sophisticated investors sometimes come unstuck, such as the Hunt brothers. In 1980 they accumulated major positions in the silver futures market using borrowed money. But a change in exchange rules led to a price drop, and quickly the brothers couldn’t cover their obligations. In other words, be careful in the commodity markets.
 Copyright 2020, Dow Jones & Company, Inc. All Rights Reserved Worldwide. LEARN MORE


This stylish family home combines a classic palette and finishes with a flexible floorplan

Just 55 minutes from Sydney, make this your creative getaway located in the majestic Hawkesbury region.


Continued stagflation and cost of living pressures are causing couples to think twice about starting a family, new data has revealed, with long term impacts expected
2 min
Australia is in the midst of a ‘baby recession’ with preliminary estimates showing the number of births in 2023 fell by more than four percent to the lowest level since 2006, according to KPMG. The consultancy firm says this reflects the impact of cost-of-living pressures on the feasibility of younger Australians starting a family.
KPMG estimates that 289,100 babies were born in 2023. This compares to 300,684 babies in 2022 and 309,996 in 2021, according to the Australian Bureau of Statistics (ABS). KPMG urban economist Terry Rawnsley said weak economic growth often leads to a reduced number of births. In 2023, ABS data shows gross domestic product (GDP) fell to 1.5 percent. Despite the population growing by 2.5 percent in 2023, GDP on a per capita basis went into negative territory, down one percent over the 12 months.
“Birth rates provide insight into long-term population growth as well as the current confidence of Australian families,” said Mr Rawnsley. “We haven’t seen such a sharp drop in births in Australia since the period of economic stagflation in the 1970s, which coincided with the initial widespread adoption of the contraceptive pill.”
Mr Rawnsley said many Australian couples delayed starting a family while the pandemic played out in 2020. The number of births fell from 305,832 in 2019 to 294,369 in 2020. Then in 2021, strong employment and vast amounts of stimulus money, along with high household savings due to lockdowns, gave couples better financial means to have a baby. This led to a rebound in births.
However, the re-opening of the global economy in 2022 led to soaring inflation. By the start of 2023, the Australian consumer price index (CPI) had risen to its highest level since 1990 at 7.8 percent per annum. By that stage, the Reserve Bank had already commenced an aggressive rate-hiking strategy to fight inflation and had raised the cash rate every month between May and December 2022.
Five more rate hikes during 2023 put further pressure on couples with mortgages and put the brakes on family formation. “This combination of the pandemic and rapid economic changes explains the spike and subsequent sharp decline in birth rates we have observed over the past four years,” Mr Rawnsley said.
The impact of high costs of living on couples’ decision to have a baby is highlighted in births data for the capital cities. KPMG estimates there were 60,860 births in Sydney in 2023, down 8.6 percent from 2019. There were 56,270 births in Melbourne, down 7.3 percent. In Perth, there were 25,020 births, down 6 percent, while in Brisbane there were 30,250 births, down 4.3 percent. Canberra was the only capital city where there was no fall in the number of births in 2023 compared to 2019.
“CPI growth in Canberra has been slightly subdued compared to that in other major cities, and the economic outlook has remained strong,” Mr Rawnsley said. “This means families have not been hurting as much as those in other capital cities, and in turn, we’ve seen a stabilisation of births in the ACT.”
This stylish family home combines a classic palette and finishes with a flexible floorplan
Just 55 minutes from Sydney, make this your creative getaway located in the majestic Hawkesbury region.