Why ESG Investing Might Never Recover
The appeal of the moniker is waning, probably because it is trying to serve too many interests at once

 4 min
4 min
The ESG brand probably has its best days behind it.
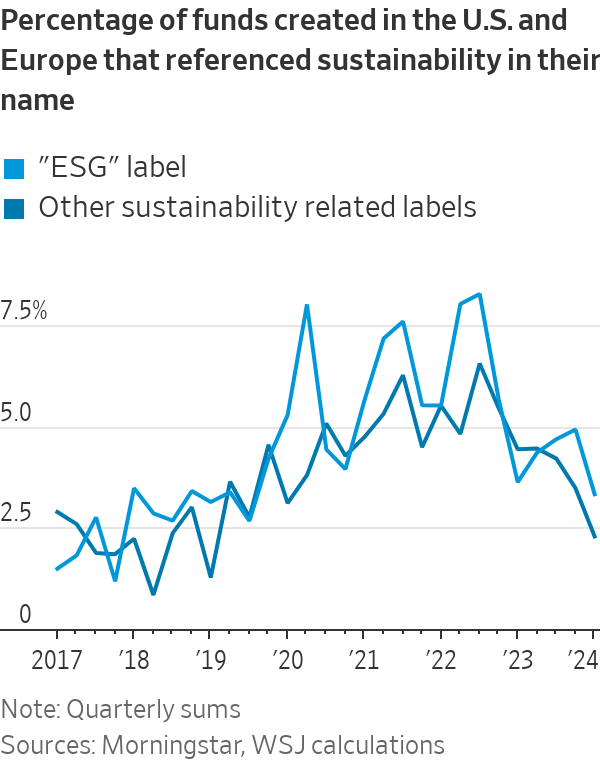
Following a three-year craze for investment products focused on environmental, social and corporate-governance concerns, the percentage of newly created funds in the U.S. and Europe with ESG in their name has fallen from a peak of 8.3% to just 3.3%, according to an analysis of quarterly data by Morningstar Direct.
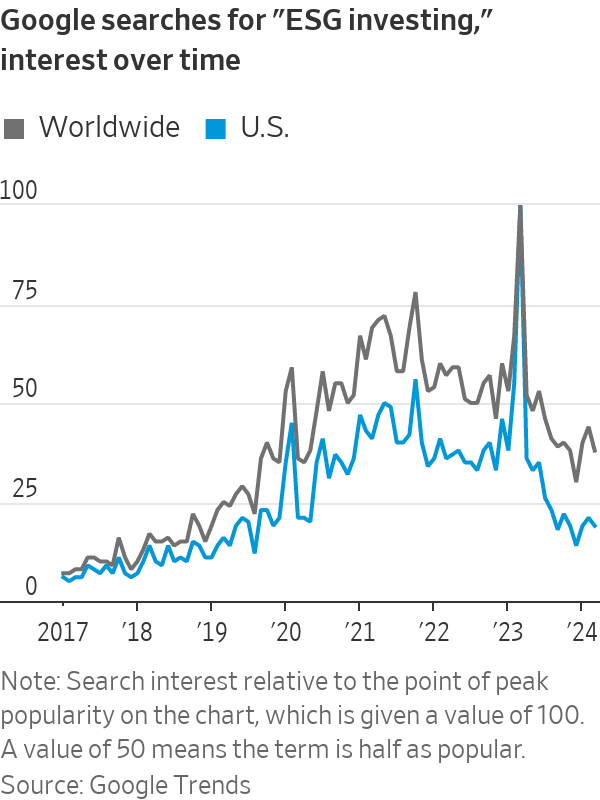
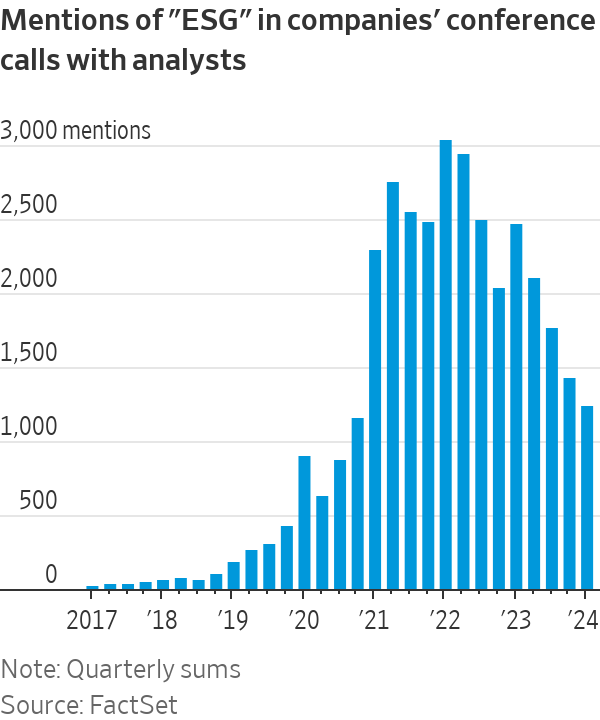
Likewise, online searches for “ESG investing” have plummeted back to mid-2019 levels, according to Google Trends. Mentions of the term in company analyst calls have dropped 59% from their quarterly peak in 2022, FactSet data suggest.
One explanation is the collapse of the clean-energy stocks most readily associated with the ESG movement. Flagging growth in electric-vehicle sales has hit sector behemoth Tesla . The S&P Global Clean Energy index, which lists solar-panel maker First Solar and Danish wind-turbine giant Vestas among its top constituents, has lost 31% since the start of 2023 as renewable-energy projects have been shelved. That compares with returns of 27% for global stocks.
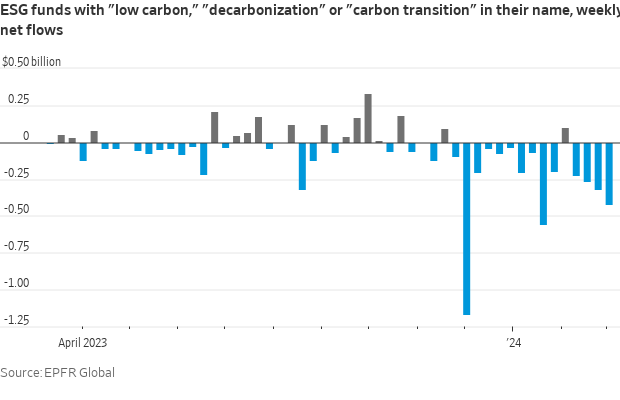
The rise of ESG investing between 2019 and 2022 coincided with a surge in clean-tech valuations, and now the reverse is happening. Investors have pulled $2.2 billion from funds dedicated to decarbonisation since the start of the year, according to EPFR, and the outflows are getting larger every week.
There is a risk that ESG was an investment fad rather than a financial revolution extending across all industries.
The term was the product of an uneasy three-way alliance. On one side were ethically driven investors, who are particularly widespread in Scandinavia and include pension funds, universities and religious organisations united in wanting to shun contentious firms. On another were institutions such as the United Nations that aimed to channel money to industries that benefit society. Finally, there were investors who wanted to profit from the green revolution.
Asset managers jumped at the chance to cater to all three simultaneously. ESG allowed them to differentiate their products, revitalise the case for active management and, at a time of declining fees, charge more for stock screens that often lead to only small changes in allocations . Among U.S. equity funds, ESG strategies have an asset-weighted average fee of 0.52%, compared with 0.33% overall, Morningstar Direct data shows.
But the confusion of motivations made for contradictions and a lot of doublespeak. Neither ethical objectives nor bets on decarbonisation square logically with fund managers’ claims that ESG is a broad path to higher, safer returns.
Yes, an ESG focus can help active managers account for risks such as a regulatory backlash or governance blow up, which in some cases might be highlighted by new company disclosures. This month the European Union cleared the way toward requiring firms to better report and address sustainability impacts.
However, the assumption that integrating ESG criteria into their screening will lead to better stock picking seems flawed . The very popularity of ESG makes it unlikely that the market is under appreciating the risks. The rush of money into firms like Vestas, whose stock hit a price-to-earnings ratio of 534 in 2022, illustrates the risk that shares with high sustainability scores can get too expensive, leading to lower returns.
Ethical investors might be fine with this, but that just shifts the focus to what counts as ethical. Tellingly, interest in ESG has dropped more in the U.S., where the politicisation of EVs and culture wars surrounding Bud Light beer show how easily corporations can become ideological battlegrounds.
ESG ratings aren’t much help in navigating these issues. Different providers give wildly different scores to the same companies, even within the specific “E,” “S” and “G” factors, according to a February paper by the Leibniz Institute SAFE. Researchers also found that environmental concerns tend to explain most of the overall score.
This is another hint that the ultimate driver of the pandemic-era ESG craze might have been a hunger for thematic investment. It has since found better sources of sustenance, as demonstrated by the breakneck growth of firms such as Global X, which is delivering increasingly granular offerings such as tracker funds for electric batteries, cloud computing and ageing populations.
Buyers of these products can be fickle and jump to the next theme—often too quickly for their own good, a Morningstar analysis showed last November. It is possible that the overly generic ESG brand will never recover its appeal, with the different parts of it eventually rebranded to suit their specific client bases. BlackRock , the world’s largest asset manager, has already dropped it and is now emphasising transition themes over ethical stewardship of companies.
Sustainable investing isn’t going anywhere. But a broad tent covering too many interests serves none of them well.
 Copyright 2020, Dow Jones & Company, Inc. All Rights Reserved Worldwide. LEARN MORE


From elevated skincare to handcrafted home pieces, this year’s most thoughtful gifts go beyond the expected.

A haven for hedge-fund titans and Hollywood grandees, Greenwich is one of the world’s most expensive residential enclaves, where eye-watering prices meet unapologetic grandeur.


The lunar flyby would be the deepest humans have traveled in space in decades.
4 min
It’s go time for the highest-stakes mission at NASA in more than 50 years.
On April 1, the agency is set to launch four astronauts around the moon, the deepest human spaceflight since the final Apollo lunar landing in 1972.
The launch window for Artemis II , as the mission is called, opens at 6:24 p.m. ET.
National Aeronautics and Space Administration teams have been preparing the vehicles to depart from Florida’s Kennedy Space Center on the planned roughly 10-day trip. Crew members have trained for years for this moment.
Reid Wiseman, the NASA astronaut serving as mission commander, said he doesn’t fear taking the voyage. A widower, he does worry at times about what he is putting his daughters through.
“I could have a very comfortable life for them,” Wiseman said in an interview last September.
“But I’m also a human, and I see the spirit in their eyes that is burning in my soul too. And so we’ve just got to never stop going.”
Wiseman’s crewmates on Artemis II are NASA’s Victor Glover and Christina Koch, as well as Canadian Space Agency astronaut Jeremy Hansen.

What are the goals for Artemis II?
The biggest one: Safely fly the crew on vehicles that have never carried astronauts before.
The towering Space Launch System rocket has the job of lofting a vehicle called Orion into space and on its way to the moon.
Orion is designed to carry the crew around the moon and back. Myriad systems on the ship—life support, communications, navigation—will be tested with the astronauts on board.
SLS and Orion don’t have much flight experience. The vehicles last flew in 2022, when the agency completed its uncrewed Artemis I mission .
How is the mission expected to unfold?
Artemis II will begin when SLS takes off from a launchpad in Florida with Orion stacked on top of it.
The so-called upper stage of SLS will later separate from the main part of the rocket with Orion attached, and use its engine to set up the latter vehicle for a push to the moon.
After Orion separates from the upper stage, it will conduct what is called a translunar injection—the engine firing that commits Orion to soaring out to the moon. It will fly to the moon over the course of a few days and travel around its far side.
Orion will face a tough return home after speeding through space. As it hits Earth’s atmosphere, Orion will be flying at 25,000 miles an hour and face temperatures of 5,000 degrees as it slows down. The capsule is designed to land under parachutes in the Pacific Ocean, not far from San Diego.

Is it possible Artemis II will be delayed?
Yes.
For safety reasons, the agency won’t launch if certain tough weather conditions roll through the Cape Canaveral, Fla., area. Delays caused by technical problems are possible, too. NASA has other dates identified for the mission if it doesn’t begin April 1.
Who are the astronauts flying on Artemis II?
The crew will be led by Wiseman, a retired Navy pilot who completed military deployments before joining NASA’s astronaut corps. He traveled to the International Space Station in 2014.
Two other astronauts will represent NASA during the mission: Glover, an experienced Navy pilot, and Koch, who began her career as an electrical engineer for the agency and once spent a year at a research station in the South Pole. Both have traveled to the space station before.
Hansen is a military pilot who joined Canada’s astronaut corps in 2009. He will be making his first trip to space.
Koch’s participation in Artemis II will mark the first time a woman has flown beyond orbits near Earth. Glover and Hansen will be the first African-American and non-American astronauts, respectively, to do the same.
What will the astronauts do during the flight?
The astronauts will evaluate how Orion flies, practice emergency procedures and capture images of the far side of the moon for scientific and exploration purposes (they may become the first humans to see parts of the far side of the lunar surface). Health-tracking projects of the astronauts are designed to inform future missions.
Those efforts will play out in Orion’s crew module, which has about two minivans worth of living area.
On board, the astronauts will spend about 30 minutes a day exercising, using a device that allows them to do dead lifts, rowing and more. Sleep will come in eight-hour stretches in hammocks.
There is a custom-made warmer for meals, with beef brisket and veggie quiche on the menu.
Each astronaut is permitted two flavored beverages a day, including coffee. The crew will hold one hourlong shared meal each day.
The Universal Waste Management System—that’s the toilet—uses air flow to pull fluid and solid waste away into containers.
What happens after Artemis II?
Assuming it goes well, NASA will march on to Artemis III, scheduled for next year. During that operation, NASA plans to launch Orion with crew members on board and have the ship practice docking with lunar-lander vehicles that Elon Musk’s SpaceX and Jeff Bezos’ Blue Origin have been developing. The rendezvous operations will occur relatively close to Earth.
NASA hopes that its contractors and the agency itself are ready to attempt one or more lunar landing missions in 2028. Many current and former spaceflight officials are skeptical that timeline is feasible.

The megamansion was built for Tony Pritzker, heir to the Hyatt Hotel fortune and brother of Illinois Gov. JB Pritzker.

From Tokyo backstreets to quiet coastal towns and off-grid cabins, top executives reveal where they holiday and why stepping away makes the grind worthwhile.