Why It’s Now Easier to Underestimate Your Expenses and Overspend
Many people are spending more than they think as inflation stays elevated

 3 min
3 min
Many people have a gap between what they think they spend and what they actually spend. This gap has widened recently as the financial and psychological effects of higher prices further strain people’s budgets.
Elevated inflation has rippled through American’s wallets for more than a year now. Some have cut back, while others have increased their spending to keep up. Credit-card balances were staying relatively flat for a while, but have jumped higher recently.
In the fourth quarter of 2022, the average household’s credit-card balance was $9,990, up 9% from in the fourth quarter of 2021, according to WalletHub, a consumer-finance website. Meanwhile, the average credit-card interest rate rose to a record high of about 20% last week, according to Bankrate.
Financial advisers say the larger amount of credit-card debt while rates are higher is one indication that some Americans are spending more than they think they are. This type of spending can reduce people’s ability to pay for important items down the road, such as college for a child or even fund their own retirement. More immediately, it will put people in costlier debt.
“If people spend too much on credit, they could end up trapped in a cycle of debt,” said Courtney Alev, consumer financial advocate at Credit Karma.
Spending less isn’t always possible when everything from groceries to travel is generally more expensive. Still, people can find ways to cut back if they understand more about why they are overspending and take a closer look at their finances.
Inflation on top of inflation
The power of compounding is a boon to investors, but not to shoppers.
Money grows much faster than most people expect because interest is earned on interest, said Michael Liersch, head of Wells Fargo & Co.’s advice and planning centre. A similar concept applies to inflation: Prices rise, and if inflation remains high, prices continue to grow on top of already-inflated prices, leaving people off guard.
“People get constantly surprised that their money isn’t going as far as they thought it would,” he said.
The cost of eating out and going for drinks continues to take Dina Lyon aback. Even though the 36-year-old married mother of one is dining out and ordering in far less than she did a year ago, some prices still give her sticker shock.
“The difference between cooking at home—about $10 for nice pasta and quick sauce from canned tomatoes—versus Italian takeout of $50 is astronomical,” said Ms. Lyon, who lives in Brooklyn, N.Y.
Outdated budgets
People tend to underestimate their future spending in large part because they base their predictions on typical expenses that come to mind easily, said Abigail Sussman, a professor of marketing at the University of Chicago Booth School of Business.
She and other researchers found that when people are coming up with predictions, they tend to think about what they usually spend money on—such as groceries, rent and gas—and base their predictions primarily on these expenses. They are less likely to consider atypical expenses, such as car repairs or birthday presents, the researchers found.
This pattern is particularly problematic when inflation is high, said Prof. Sussman. When the price of the same basket of items rises, people might not account for these price increases in their future budgets, she said.
Further, times of stress cause people to be less intentional about tracking their money, said Mr. Liersch. They might also spend more than they know they can afford to soothe feelings including anxiety and depression.
According to a recent survey by Credit Karma, 39% of Americans identify as emotional spenders (defined by the study as someone who spends money to cope with emotional highs and lows.)
Take control
You have a better chance of staying under budget if you become more aware of your spending instead of sticking your head in the sand, financial advisers said.
One thing Adam Alter, a professor of marketing at New York University’s Stern School of Business, does is create a line item in his monthly budget for one-off expenses, such as an unexpected medical bill. This gives him a cushion in his budget and enables him to more fully examine how much he is spending each month, said Prof. Alter, who has studied overspending.
People might also wish to include an escalating buffer into their budgets of say, 2% to 5% a year, to account for inflation, he said.
Jay Zigmont, a financial planner in Water Valley, Miss., looks at clients’ total take-home income from the year, subtracts everything they must spend money on such as their mortgage and how much they saved. The remaining number is how much they spent on discretionary spending.
In most cases, clients are surprised they spent so much, he said.
Once people know how much they spend, Britta Koepf, a financial planner in Independence, Ohio, suggests they practice mindful spending. Before any purchase, ask yourself if you really want or need what you are buying. Frequently, the answer is yes, but sometimes waiting five seconds will prevent you from overspending, she said.
You can also practice mindfulness by delaying purchases further.
“A lot of the time, if I tell myself that I will purchase it next week, I find that I am no longer interested a week later,” she said.
 Copyright 2020, Dow Jones & Company, Inc. All Rights Reserved Worldwide. LEARN MORE


Automobili Lamborghini and Babolat have expanded their collaboration with five new colourways for the ultra-exclusive BL.001 racket, limited to just 50 pieces worldwide.
As housing drives wealth and policy debate, the real risk is an economy hooked on growth without productivity to sustain it.


As housing drives wealth and policy debate, the real risk is an economy hooked on growth without productivity to sustain it.
3 minFor decades, Australia has leaned into its reputation as the lucky country. But luck, as it turns out, is not an economic strategy.
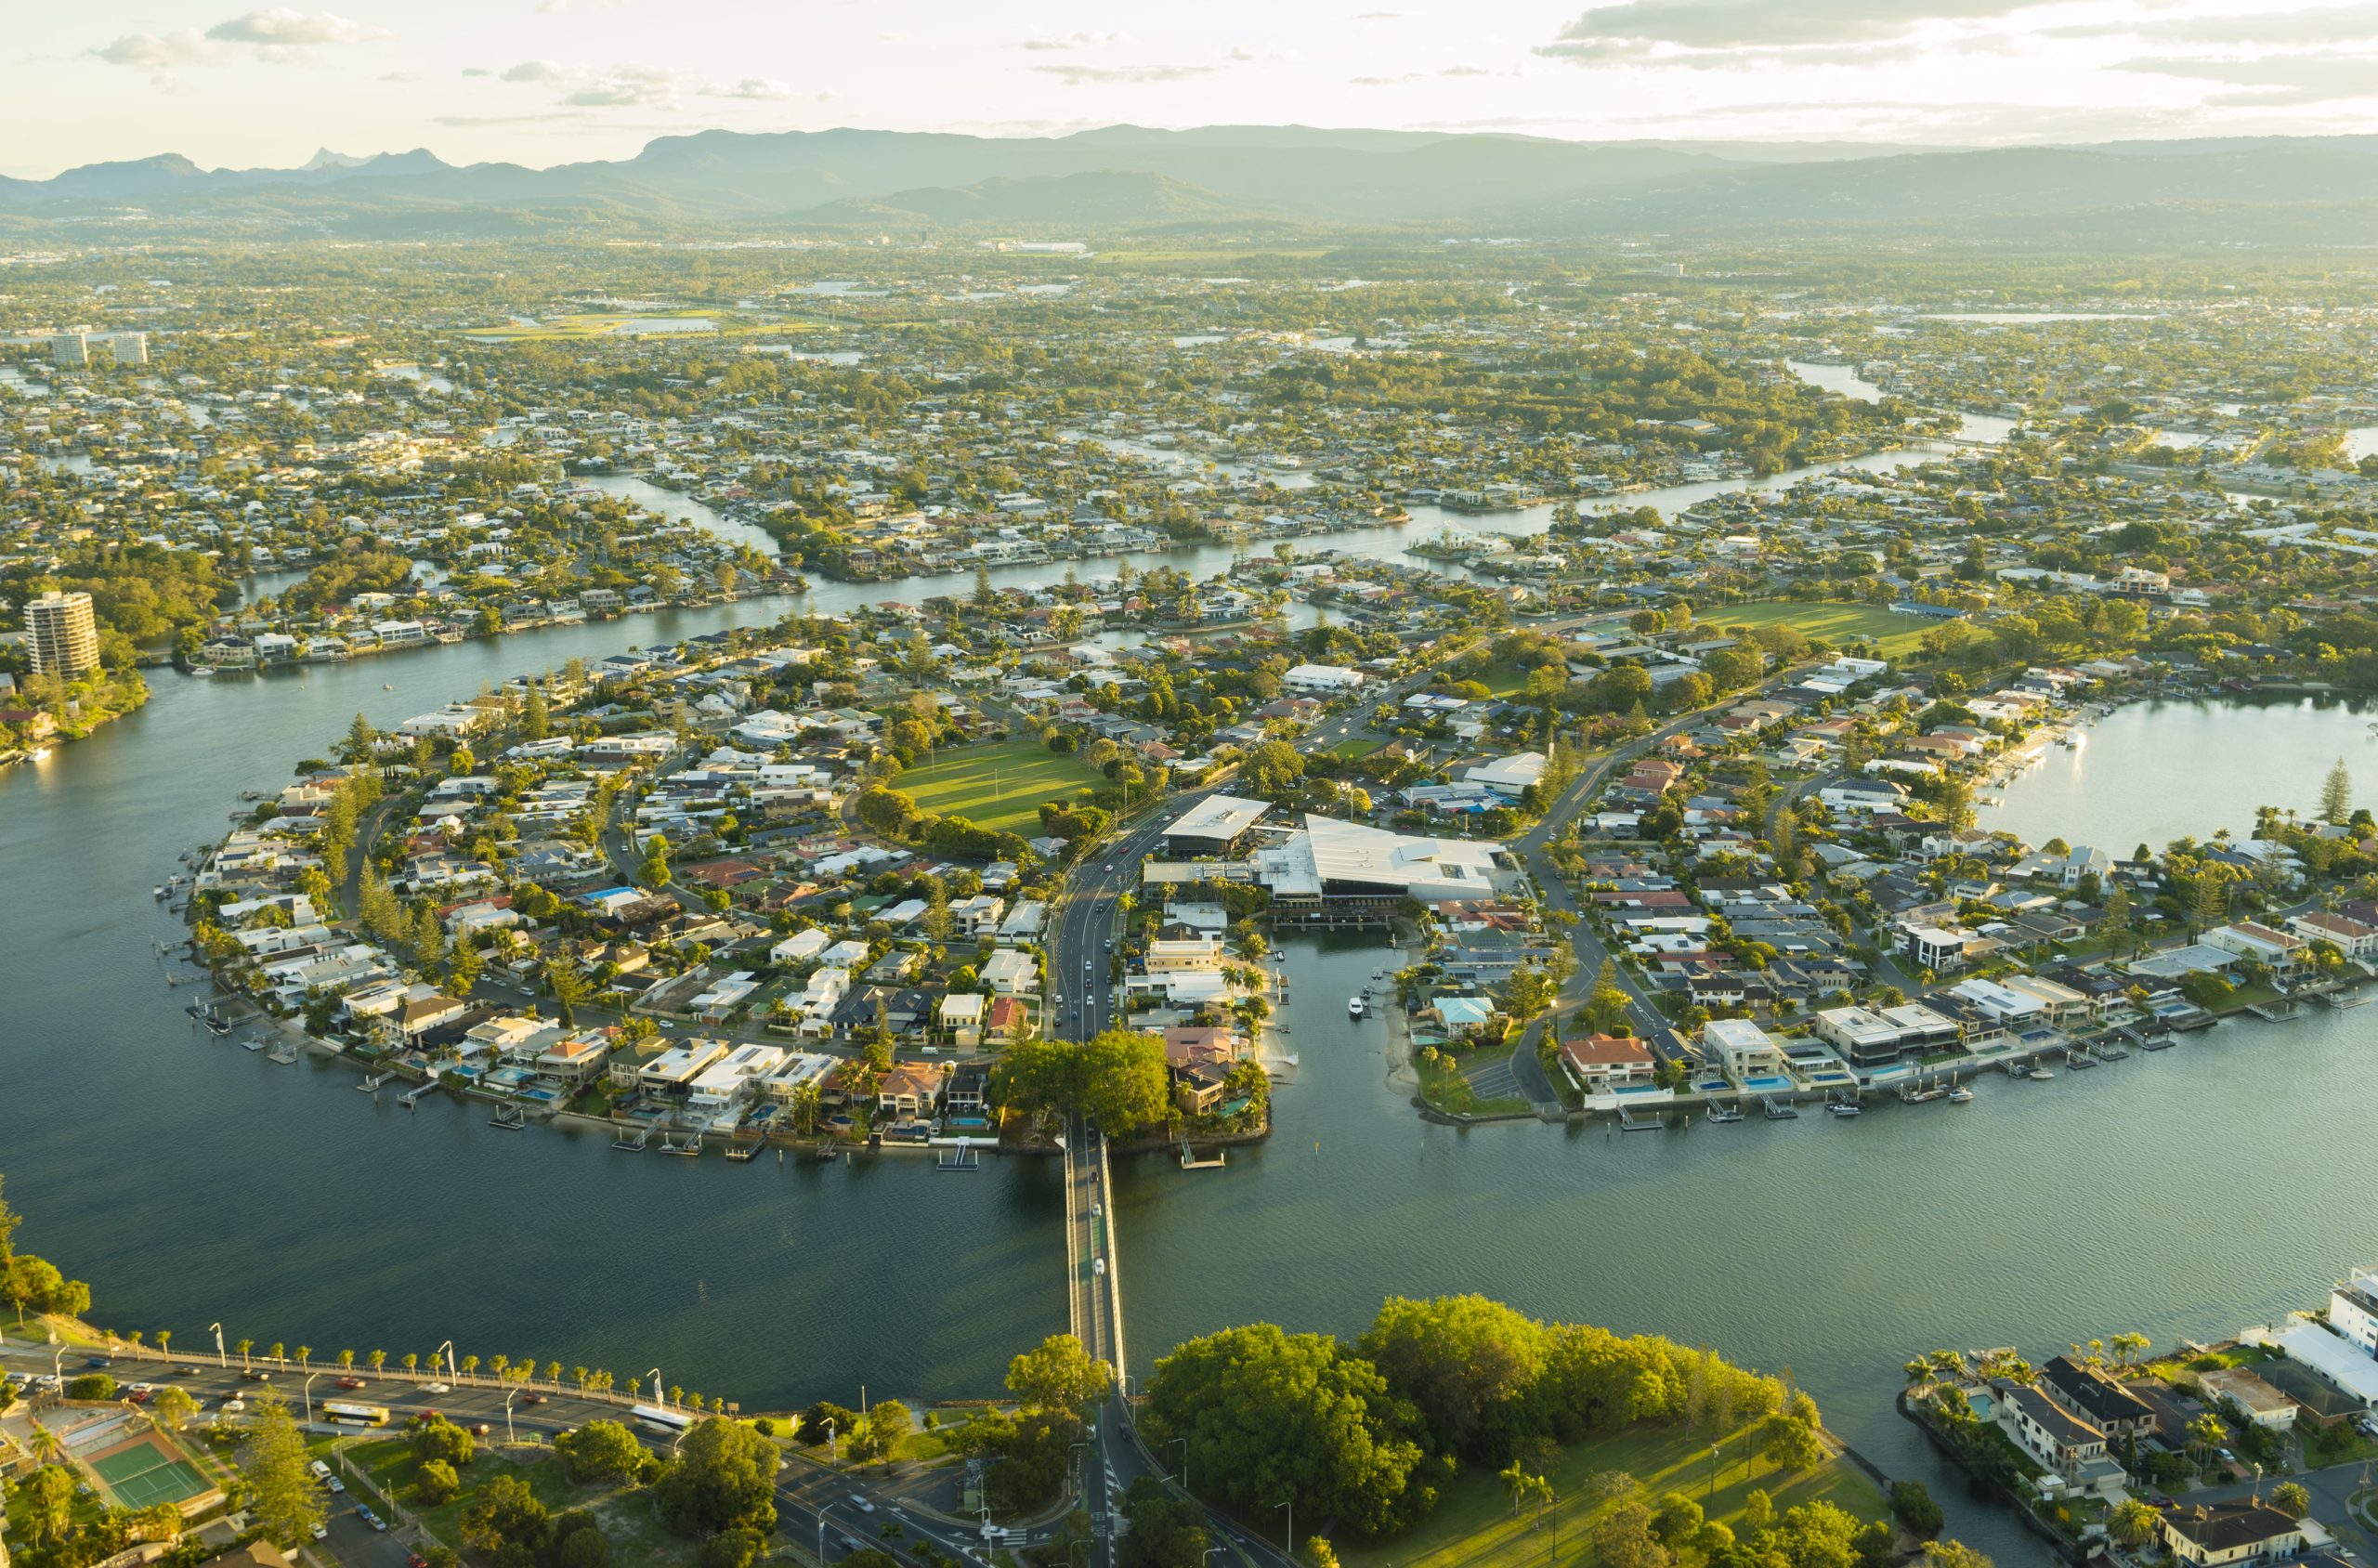
What once looked like resilience now appears increasingly fragile. Beneath the surface of rising property values and steady headline growth, the Australian economy is showing signs of strain that can no longer be ignored.
Recent data paints a sobering picture. Australia has recorded one of the largest declines in real household disposable income per capita among advanced economies.
Wages have failed to keep pace with inflation, meaning many Australians are working harder for less. On a per capita basis, income growth has stalled and, at times, reversed.
And yet, on paper, things still look relatively solid. GDP is growing. Unemployment remains low. But that growth is increasingly being driven by population expansion rather than productivity.
More people are contributing to output, but not necessarily improving living standards.
That distinction matters.
For years, Australia’s economic success rested on a powerful combination: a once-in-a-generation mining boom, a credit-fuelled housing market, strong migration and a property sector that rarely faltered. Between 1991 and 2020, the country avoided recession entirely, building enormous wealth in the process.
But much of that wealth is tied to property. Around two-thirds of household wealth sits in real estate, inflated by leverage and sustained by demand. It has worked, until now.
The problem is the supply side of the economy has not kept up.
Housing supply is falling behind population growth. Rental vacancies are near record lows.
Construction firms are collapsing at an elevated rate. At the same time, massive infrastructure pipelines are competing with residential projects for labour and materials, pushing costs higher and delaying delivery.
The result is a system under pressure from all angles.
Despite near full employment, productivity growth has stagnated for years. In simple terms, Australians are putting in more hours without generating more output per hour. The economy is running faster, butgoing nowhere.
Meanwhile, government spending continues to expand. Public debt is approaching $1 trillion, with spending now accounting for a record share of GDP.
The gap between spending and revenue has been filled by borrowing for decades, adding further pressure to an already stretched system.
This is where the uncomfortable question emerges.
Has Australia become too reliant on a model driven by rising property values, expanding credit and population growth?
As asset prices rise, households feel wealthier and borrow more. Banks lend more. Governments collect more revenue. Migration fuels demand. The cycle reinforces itself.
But when productivity stalls and debt outpaces real income, the system begins to depend on constant expansion just to stay stable.
It is not a collapse scenario. But it is not particularly stable either.
Nowhere is this more evident than in housing.
The National Housing Accord targets 1.2 million new homes over five years, yet current completion rates are well below that pace. With approvals falling and construction costs rising, the gap between supply and demand is widening, not narrowing.
Housing is also one of the largest contributors to inflation, with costs rising sharply across rents, construction and utilities. Yet the private sector, from small investors to major developers, is struggling to make projects stack up in the current environment.
This brings the policy debate into sharper focus.
Tax settings such as negative gearing and capital gains concessions have undoubtedly boosted demand over the past two decades. But they have also supported supply. Removing them may ease prices briefly, but risks deepening the supply shortage over time.
That is the paradox.
Policies designed to make housing more affordable can, in practice, make the shortage worse if they discourage development. The optics may appeal, but the economics are far less forgiving.
It is also worth remembering that most property investors are not institutional players. The majority own just one investment property. They are, in many cases, ordinary Australians using real estate as their primary wealth-building tool.
Undermining that system without replacing it with a viable alternative risks unintended consequences, from reduced supply to higher rents and increased inflation.
So where does that leave Australia?
At a crossroads.
The country can continue to rely on population growth and rising asset prices to drive economic activity. Or it can shift towards a model built on productivity, innovation and sustainable growth.
The latter is harder. It requires structural reform, long-term thinking and political discipline.
But it is also the only path that leads to genuine, lasting prosperity.
The question is no longer whether Australia has been lucky.
It is whether it can evolve before that luck runs out.
Paul Miron is the Co-Founder & Fund Manager of Msquared Capital.

Warmer minimalism, tactile materials and wellness focused layouts are redefining luxury interiors as homeowners design for comfort, connection and lasting appeal.

Rugged coastal drives and fireside drams define a slow, indulgent journey through Scotland’s far north.