


Why No One Wants to Pay for the Green Transition
Investors and consumers balk at costs of replacing fossil fuels with renewable energy, highlighting painful economics of climate mitigation

 4 min
4 min
In the past few years, Washington and Wall Street started fantasising that the transition to net-zero carbon emissions could be an economic bonanza. “When I think climate change, I think jobs,” President Biden said. When Wall Street heard green energy, it saw profits. As Ford Motor launched an electric Mustang and pickup truck, its market value topped $100 billion for the first time.
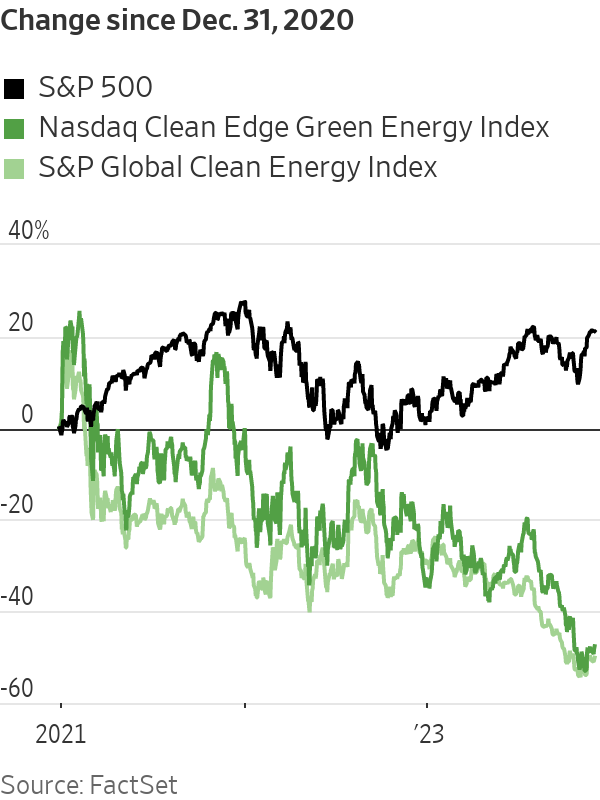
This year the fantasy ended. With electric vehicle demand falling short of expectations, manufacturers are dialling back production and buying back stock instead. Offshore wind developers have canceled projects. The S&P Global Clean Energy Index has fallen 30% this year. Ford’s market cap is down to $42 billion.
This doesn’t mean the transition to net zero is over. Officials meeting this week at the United Nations climate conference are just as worried about climate change. Renewable energy continues to expand. In the very long run, it is still the case that economic welfare will be higher with less global warming.
But the economics of getting to net zero remain, fundamentally, dismal: Someone has to pay for it, and shareholders and consumers decided this year it wouldn’t be them.
Politicians and the public tend to think all investment is good for growth, an error that leads to all sorts of muddled thinking about climate.
Technological transformations are positive supply shocks: a new, more efficient technology comes along, and investment naturally gravitates toward this new technology because it is profitable.
By contrast, the green transition is driven by public policy. It is “a negative supply shock, with an accompanying need to finance investments whose profitability cannot be taken for granted,” French economist Jean Pisani-Ferry wrote in a report commissioned by the French prime minister and released in English in November. “By putting a price—financial or implicit—on a free resource (the climate), the transition increases production costs, with no guarantee that the reduction in energy costs will eventually offset them, while the investments it calls for do not increase productive capacity but must nevertheless be financed.”
Pisani-Ferry, who is affiliated with the Bruegel think tank in Europe and the Peterson Institute for International Economics in Washington, is an uncommonly clear thinker on this issue.
He notes the transition involves hefty capital spending today to replace fossil-fuel consumption in the future. Pisani-Ferry estimates a middle-class French family would spend 44% of annual disposable income for a heat pump, and 120% for an electric car. These investments boost demand, but don’t leave families better off since they simply do the same thing as what they replace. And if taxes rise to pay for these investments, families will be worse off, financially.
“It would take an incredible act of blindness to fail to recognise that climate change is happening, that it is—and will increasingly become—severely damaging,” he writes. “It would also be incredibly flippant to claim that this urgent and imperative action will have no economic cost by 2030.”
The most efficient way to redirect consumption and investment from fossil fuels to zero-emissions energy is a carbon tax, or a cap-and-trade system. Europe has adopted such a system plus ever more stringent goals, especially after Russia cut off natural-gas supplies following its 2022 invasion of Ukraine. But as the cost has grown, so has public discontent, from France’s “yellow vest” protests in 2018 to last week’s first-place finish in Dutch elections by the far-right Freedom Party, which wants to ditch all climate regulations.
U.S. leaders have rejected any federal tax or fee on carbon. Biden’s solution is to not ask consumers to pay for the green transition; his Inflation Reduction Act pours, by some estimates, roughly $1 trillion into electric vehicles, renewable energy, hydrogen and other zero-emissions technology.
Subsidies can play a vital role by giving green energy time to scale up and innovate until it is competitive with fossil fuels. But the IRA has been undermined by extraneous conditions such as made-in-America requirements, and by green tech inflation—a byproduct of the IRA itself, which helped fuel demand.
Finally, Biden’s investment agenda was designed for the pre pandemic era when low interest rates flattered the financial profile of renewable energy investment and federal budget deficits were less likely to crowd out private investment. Those assumptions no longer apply.
For years, the cost of wind and solar plummeted, but since 2021 they have risen, according to investment bank Lazard. Interest rates are an important factor, which Lazard estimates affect offshore wind and solar more than natural gas.
Many developers can no longer economically supply power at the rates previously agreed to. Denmark’s Orsted, the world’s largest wind developer, took a $4 billion charge in early November for pulling out of two projects off New Jersey. The company today is worth 75% less than in early 2021.
ClearView Energy Partners estimates about 30% of state-contracted offshore wind capacity has been canceled, and another 25% may be rebid. ClearView analyst Timothy Fox noted lawmakers often mandate increased renewables, but utility regulators must approve the contracts, and one of their primary considerations is cost to ratepayers.
“I am an unapologetic economic regulator,” Diane Burman, a member of the New York state Public Service Commission, said in October as the commission refused to pay wind developers more. De carbonisation and grid improvement must proceed “with costs in mind.”
The financial appeal of EVs has similarly faded. Tesla proved making them can be profitable, but so far it looks like an outlier. Tesla captured the lion’s share of early adopters—drivers willing to put up with the cost and recharging hassle of an EV in return for performance and green credentials. For most drivers, the trade off still doesn’t work—even with subsidies.
True, the IRA has spurred a boom in EV and battery factories. But a successful green transition requires that those factories be profitable, and Detroit’s automakers are still losing money on every EV they sell.
EVs should eventually require less labor and thus be cheaper to build than gasoline-powered vehicles. But auto workers are no more willing to pay for the green transition than consumers or investors. In its recent strike, the United Auto Workers extracted commitments that make it even harder for Detroit to make money on EVs.
In a sobering report this week, Morgan Stanley auto analysts estimated the average non financial company in the S&P 500 spends its market cap in capital expenditure and research and development in about 50 years. GM and Ford spend theirs in 1.9 and 2.6 years, respectively. “This cannot continue, in our view.”
The green transition remains critical, but its path will be fraught until someone agrees to pay for it.
 Copyright 2020, Dow Jones & Company, Inc. All Rights Reserved Worldwide. LEARN MORE


A record-breaking $11 million sale at The Centennial Collection has set a new benchmark for luxury apartment living in Bondi Junction.

As interest rates, inflation and market sentiment fluctuate, investors are being urged to focus on data, not panic.


The Federal Budget may have softened some of its proposed tax reforms, but it has exposed a bigger issue: too many families are relying on wealth structures that no longer reflect the realities of modern life.
3 min
For many Australians, the 2026 Federal Budget initially felt like a direct challenge to the way wealth is created, held and transferred between generations.
The headlines were immediate: changes to capital gains tax, reforms to discretionary trusts, restrictions on negative gearing and increased scrutiny of investment structures. Unsurprisingly, affluent families, business owners and investors began asking the same question:
Is the way we hold our wealth still fit for purpose?
In recent days, the government has announced several significant amendments following industry consultation and public feedback, including exempting testamentary trusts from the proposed 30 per cent minimum tax and expanding capital gains tax concessions for small businesses.
The backdown is welcome. But it also highlights something much bigger.
This Budget has accelerated a conversation that many Australian families have been postponing for years.
The conversation is not really about tax. It is about wealth stewardship.
For decades, Australians have built wealth through businesses, property, investments and careful long-term planning. Yet many families have not revisited the legal structures surrounding those assets in years, sometimes decades.
We often see clients who have spent years building significant wealth, only to discover their legal arrangements no longer reflect their current circumstances.
Their children are now adults. They may own multiple properties.
They may have sold a business, entered a second marriage, become grandparents or accumulated digital assets that did not exist when their original estate plans were prepared.
The trust that distributes income may need to be reconsidered. The bucket company may no longer be so attractive.
The Budget has simply exposed a reality that already existed: wealth structures cannot remain static while life continues to evolve.
Importantly, trusts themselves are not the issue.
Trusts are legitimate planning tools that provide flexibility, protection and continuity. When used appropriately, they allow families to adapt to changing circumstances over time.
And neither is tax the issue, really. Getting the fundamentals right is more important for long-term, sustainable wealth than a few favourable tax treatments around the edges.

The real issue is complacency.
Too often, families create structures and assume the job is done. It isn’t.
Estate planning is no longer a document you sign once and file away in a drawer. It is an ongoing process that should evolve alongside your life.
We are also seeing a broader shift in how Australians define wealth itself. It is no longer just the family home and an investment portfolio.
Modern wealth includes businesses, digital assets, cryptocurrency, intellectual property, frequent flyer points and increasingly complex family arrangements.
At the same time, Australians are living longer than ever before, meaning wealth may need to support multiple generations simultaneously. This creates new responsibilities and new risks.
How do you help your children enter the property market without exposing family wealth to relationship breakdowns?
How do you structure wealth so that it remains a source of opportunity rather than future conflict?
These are the questions families should be asking now.
The recent debate surrounding testamentary trusts also serves as an important reminder that policy decisions can have unintended consequences for vulnerable Australians. It is encouraging that the government has listened to feedback and clarified its position.
But the lesson remains: the wealth landscape is changing.
Increasingly, governments, regulators and tax authorities are paying closer attention to how wealth is held and transferred. That means families cannot afford to adopt a “set-and-forget” approach to their structures.
The families who will be best placed for the future are not necessarily those with the greatest wealth.
They are the families with the greatest clarity. Clarity around ownership, succession and governance. And clarity around how wealth will transition from one generation to the next.
Ultimately, preserving wealth is not about avoiding change.
It is about preparing for it.
Because the greatest risk is not change itself.
It is losing the ability to respond to it.
Anthony Hunt is Co-Founder of Wealth Lawyers and former COO of Westpac Private Bank. He advises business owners, investors and affluent Australian families on wealth protection, succession planning and intergenerational wealth transfer

Three-Michelin-starred chef Massimiliano Alajmo will host an intimate Mediterranean sailing aboard Crystal Serenity, redefining fine dining at sea.

Many of the most-important events have slipped from our collective memories. But their impacts live on.


