


China’s Overcapacity Is Already Backfiring
Excess investment in industry isn’t made up by trading partners, and it has domestic consequences

 2 min
2 min
In the “ China Shock 2.0 ” narrative, not only is China a security threat and a low-end factory competitor, but it is also angling to swamp the West with cut-rate high-tech goods. There has been less focus on the downsides of such a strategy for China itself.
China’s first-quarter growth beat most estimates , rising 5.3% on the year—thanks mostly to strong industrial output and exports. But the economic data released Tuesday also showed that excess capacity is very real, and could be damaging to China itself.
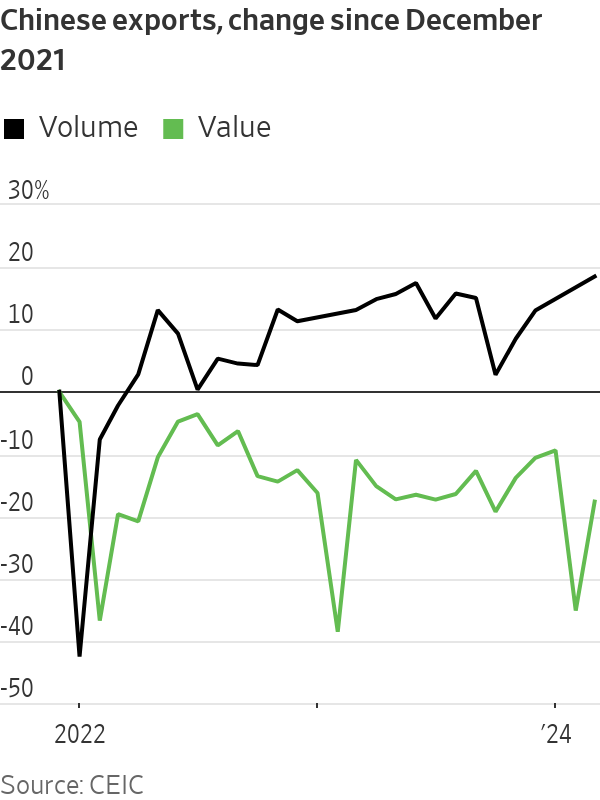
While China’s industrial engine revved up in January and February , it downshifted again in March: output rose just 4.5% on the year, down sharply from January and February’s 7%. More tellingly, manufacturing capacity utilisation plummeted to 73.8% in the first quarter—its weakest, excluding the pandemic-affected first quarter of 2020, since at least 2015. In volume terms, China’s exports hit a nearly 10-year high in March. But in value terms they were barely above where they sat in October.
In other words, firms’ pricing power both at home and abroad is weakening and margin pressure is probably mounting: The March industrial financial data, which will be released later this month, will be worth watching.
So will private investment in manufacturing. If external demand, in value terms, doesn’t find a stronger footing soon and China’s domestic economy remains weak, then eventually such investment will need to slow. Otherwise the government, or state-owned banks, will have to start absorbing the cost of too many loans to industry more directly, as they already have with real estate and infrastructure .
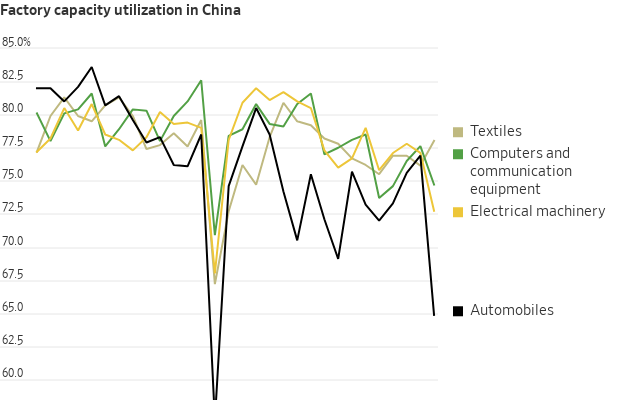
Particularly interesting is the breakdown of that capacity utilisation data itself. Falling run rates were especially obvious in Beijing’s favourite sectors like automobiles and electrical equipment—the so-called “new productive forces,” including electric vehicles, chips and solar panels, which policymakers have highlighted in recent speeches and have been stalking Western politicians’ nightmares. Automobile manufacturing utilisation rates fell below 65% in the first quarter: well below their previous low (excluding the first quarter of 2020) of 69.1% in mid-2016.
China’s traditional export sectors, on the other hand, have actually held up relatively well. Textiles utilisation rose in the first quarter, while run rates for computer and communication gear fell, but much less sharply.
Meanwhile, economy wide borrowing—excluding government bond issuance—weakened further in March, despite bond yields and interest rates near multiyear lows. If margin pressure starts to force some “new productive forces” to start slowing investment, fiscal policy would need to step in to prop up growth.
Alternatively, China can keep funnelling its excess savings into new manufacturing overcapacity—but Chinese banks and Beijing, not just China’s trade partners, will eventually end up footing the bill.
 Copyright 2020, Dow Jones & Company, Inc. All Rights Reserved Worldwide. LEARN MORE


This stylish family home combines a classic palette and finishes with a flexible floorplan

Just 55 minutes from Sydney, make this your creative getaway located in the majestic Hawkesbury region.


A study suggests that when jobs are hard to come by, the best workers are more available—and stay longer
2 min
Could a recession be the best time to launch a tech startup?
A recent study suggests that is the case. The authors found that tech startups that began operations during the 2007-09 recession—and received their first patent in that time—tended to last longer than tech startups founded a few years before or after. And those recession-era companies also tended to be more innovative than the rest.
“The effect of macroeconomic trends is not always intuitive,” says Daniel Bias , an assistant professor of finance at Vanderbilt University’s Owen Graduate School of Management, who co-wrote the paper with Alexander Ljungqvist, Stefan Persson Family Chair in Entrepreneurial Finance at the Stockholm School of Economics.
Drawing on data from the U.S. Patent and Trademark Office, the authors examined a sample of 6,946 tech startups that launched and received their first patent approval between 2002 and 2012.
One group—about 5,734 companies—launched and got their patent outside of the 2007-09 recession. Of those, about 70% made it to their seventh year. But the startups that launched and got their first patent during the recession—about 1,212 companies—were 12% more likely to be in business in their seventh year.
These recession-era firms were also more likely to file a novel and influential patent after their first one. (That is, a patent the researchers determined was dissimilar to patents in the same niche that came before it, but similar to ones that came after it.)
So, why did these recession-era firms outperform their peers? Labor markets played a big role.
A widespread lack of available jobs meant that the startups were able to land more productive and innovative employees, especially in their research and development groups, and then hold on to them. More important, the tight labor markets also meant that the founding inventors—the people named on the very first patent—were more likely to stick around rather than try for opportunities elsewhere.
For startups started during the 2007-09 recession, founding inventors were 25 percentage points less likely to leave their company within the first three years. On average, about 43% of founding inventors in the entire sample left their startup within the first three years.
“Our study really highlights the importance of labor retention for young innovative startups. Retaining founding inventors cannot only help them survive, but also thrive,” Bias says.
This stylish family home combines a classic palette and finishes with a flexible floorplan
Just 55 minutes from Sydney, make this your creative getaway located in the majestic Hawkesbury region.