Slowly but surely, inflation moves in the right direction
It’s proven stubbornly sticky to shift but latest figures show inflation is on its way down
 < 1 min
It’s a happy new year for mortgage holders following the release of data on the Consumer Price Index today. The CPI rose to 4.3 percent in the 12 months to November last year, down from 4.9 percent in October, taking pressure off the RBA for another rate rise.
“This month’s annual increase of 4.3 per cent is down from the 4.9 per cent rise in October and is the smallest annual increase since January 2022,” said Michelle Marquardt, ABS head of prices statistics.
The results make a further rise in the cash rate unlikely when the RBA Board meets in February, the first meeting of the year. December inflation is expected to follow a similar pathway, further reducing the chances of another interest rate hike.
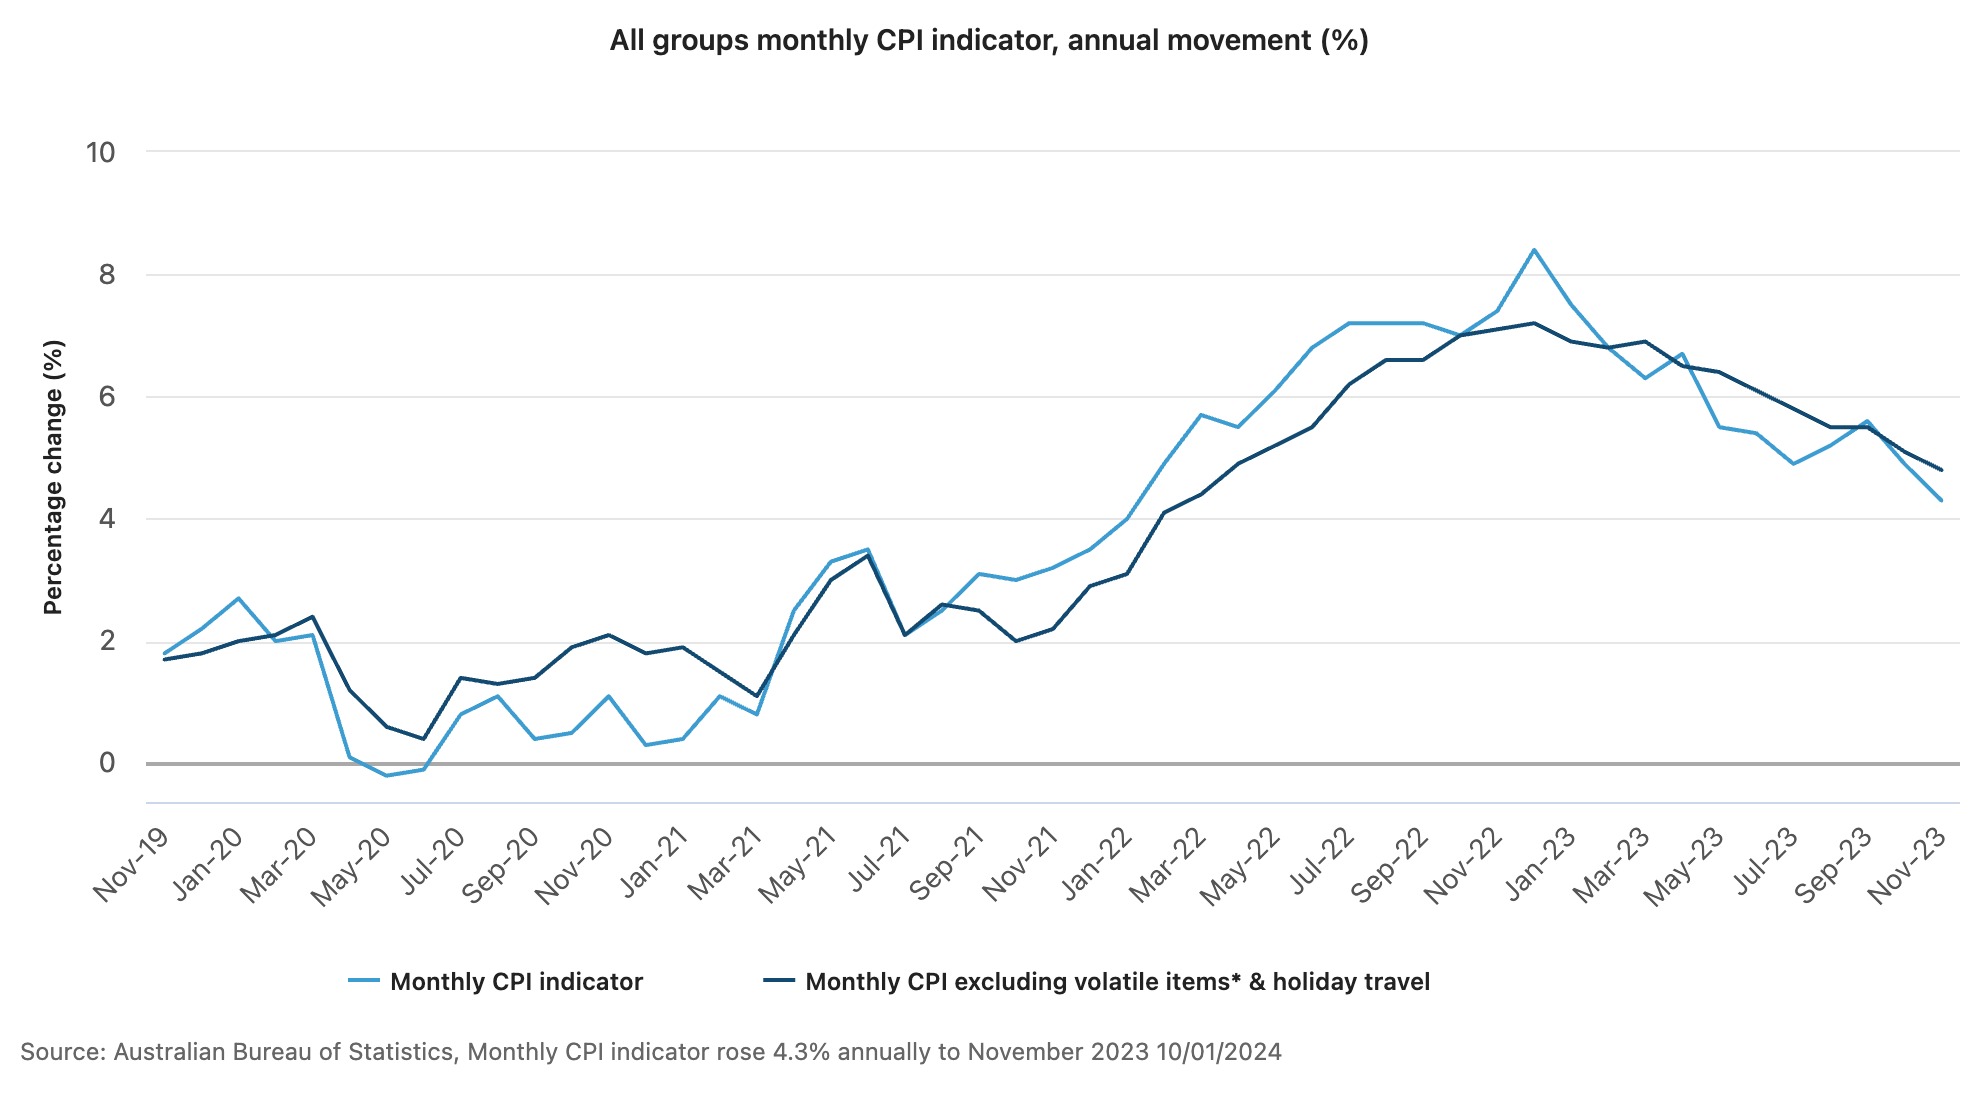
Once again, housing, insurance and food and beverages placed the strongest pressure on prices, although there are signs that services inflation, which has remained stubbornly high, is finally starting to dip, down from 5 percent in October to 4.7 percent.
It’s welcome news for mortgage holders who shouldered significant rate rises over the past 18 months as the official interest rate rose to 4.35 percent. Some experts are so optimistic about the news that they have predicted the possibility of cuts as early as May. However, the country’s largest mortgage lender, the Commonwealth Bank, anticipates September 2024 as the most likely time for the first fall in rates.

From snow-dusted valleys to festival-filled autumns, Bhutan reveals itself as a rare destination where culture, nature and spirituality unfold year-round.

Odd Culture Group brings a new kind of after-dark energy to the CBD, where daiquiris, disco and design collide beneath the city streets.


The lunar flyby would be the deepest humans have traveled in space in decades.
4 min
It’s go time for the highest-stakes mission at NASA in more than 50 years.
On April 1, the agency is set to launch four astronauts around the moon, the deepest human spaceflight since the final Apollo lunar landing in 1972.
The launch window for Artemis II , as the mission is called, opens at 6:24 p.m. ET.
National Aeronautics and Space Administration teams have been preparing the vehicles to depart from Florida’s Kennedy Space Center on the planned roughly 10-day trip. Crew members have trained for years for this moment.
Reid Wiseman, the NASA astronaut serving as mission commander, said he doesn’t fear taking the voyage. A widower, he does worry at times about what he is putting his daughters through.
“I could have a very comfortable life for them,” Wiseman said in an interview last September.
“But I’m also a human, and I see the spirit in their eyes that is burning in my soul too. And so we’ve just got to never stop going.”
Wiseman’s crewmates on Artemis II are NASA’s Victor Glover and Christina Koch, as well as Canadian Space Agency astronaut Jeremy Hansen.

What are the goals for Artemis II?
The biggest one: Safely fly the crew on vehicles that have never carried astronauts before.
The towering Space Launch System rocket has the job of lofting a vehicle called Orion into space and on its way to the moon.
Orion is designed to carry the crew around the moon and back. Myriad systems on the ship—life support, communications, navigation—will be tested with the astronauts on board.
SLS and Orion don’t have much flight experience. The vehicles last flew in 2022, when the agency completed its uncrewed Artemis I mission .
How is the mission expected to unfold?
Artemis II will begin when SLS takes off from a launchpad in Florida with Orion stacked on top of it.
The so-called upper stage of SLS will later separate from the main part of the rocket with Orion attached, and use its engine to set up the latter vehicle for a push to the moon.
After Orion separates from the upper stage, it will conduct what is called a translunar injection—the engine firing that commits Orion to soaring out to the moon. It will fly to the moon over the course of a few days and travel around its far side.
Orion will face a tough return home after speeding through space. As it hits Earth’s atmosphere, Orion will be flying at 25,000 miles an hour and face temperatures of 5,000 degrees as it slows down. The capsule is designed to land under parachutes in the Pacific Ocean, not far from San Diego.

Is it possible Artemis II will be delayed?
Yes.
For safety reasons, the agency won’t launch if certain tough weather conditions roll through the Cape Canaveral, Fla., area. Delays caused by technical problems are possible, too. NASA has other dates identified for the mission if it doesn’t begin April 1.
Who are the astronauts flying on Artemis II?
The crew will be led by Wiseman, a retired Navy pilot who completed military deployments before joining NASA’s astronaut corps. He traveled to the International Space Station in 2014.
Two other astronauts will represent NASA during the mission: Glover, an experienced Navy pilot, and Koch, who began her career as an electrical engineer for the agency and once spent a year at a research station in the South Pole. Both have traveled to the space station before.
Hansen is a military pilot who joined Canada’s astronaut corps in 2009. He will be making his first trip to space.
Koch’s participation in Artemis II will mark the first time a woman has flown beyond orbits near Earth. Glover and Hansen will be the first African-American and non-American astronauts, respectively, to do the same.
What will the astronauts do during the flight?
The astronauts will evaluate how Orion flies, practice emergency procedures and capture images of the far side of the moon for scientific and exploration purposes (they may become the first humans to see parts of the far side of the lunar surface). Health-tracking projects of the astronauts are designed to inform future missions.
Those efforts will play out in Orion’s crew module, which has about two minivans worth of living area.
On board, the astronauts will spend about 30 minutes a day exercising, using a device that allows them to do dead lifts, rowing and more. Sleep will come in eight-hour stretches in hammocks.
There is a custom-made warmer for meals, with beef brisket and veggie quiche on the menu.
Each astronaut is permitted two flavored beverages a day, including coffee. The crew will hold one hourlong shared meal each day.
The Universal Waste Management System—that’s the toilet—uses air flow to pull fluid and solid waste away into containers.
What happens after Artemis II?
Assuming it goes well, NASA will march on to Artemis III, scheduled for next year. During that operation, NASA plans to launch Orion with crew members on board and have the ship practice docking with lunar-lander vehicles that Elon Musk’s SpaceX and Jeff Bezos’ Blue Origin have been developing. The rendezvous operations will occur relatively close to Earth.
NASA hopes that its contractors and the agency itself are ready to attempt one or more lunar landing missions in 2028. Many current and former spaceflight officials are skeptical that timeline is feasible.

Two coming 2027 models – the first of the “Neue Klasse” cars coming to the U.S. early next year – have been revealed.

A&K Sanctuary unveils Kitirua Plains Lodge, a sustainability-focused luxury property shaped by landscape, local craft and contemporary safari architecture.