Banks Earn Billions Thanks To Higher Interest Rates
ANZ, NAB and Westpac all reported higher interest income in FY23
 2 min
2 min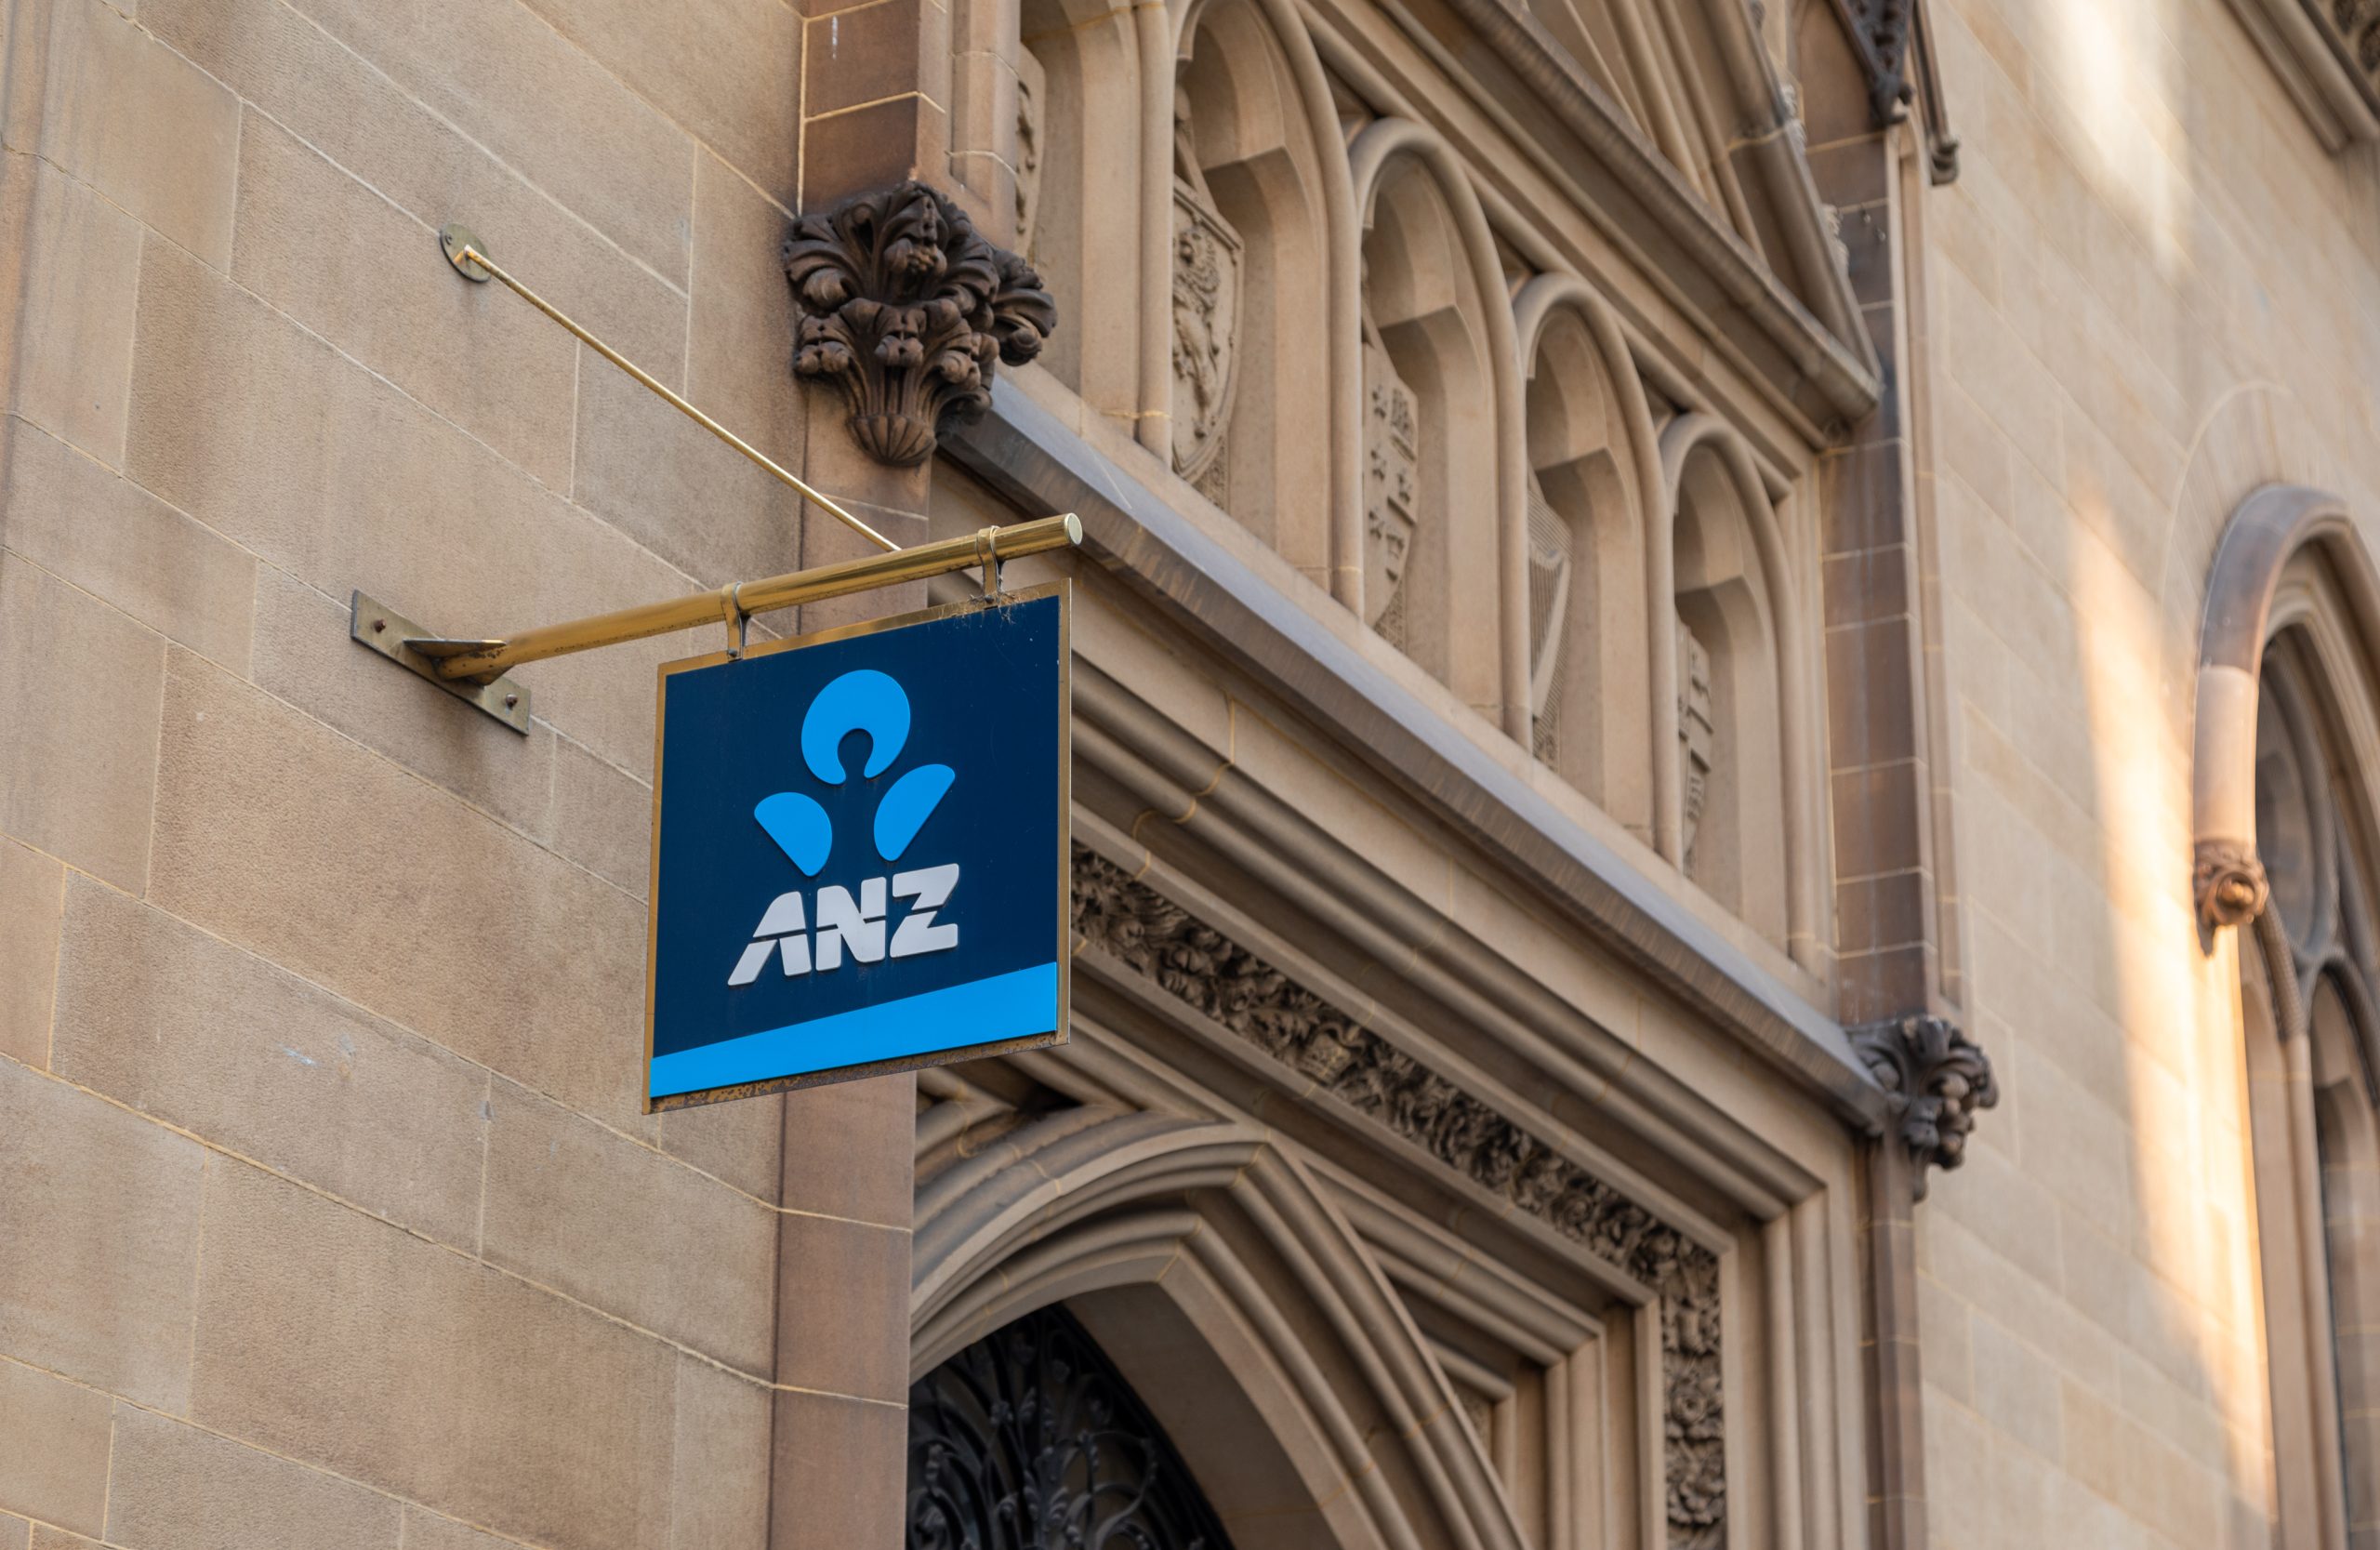
Westpac, ANZ and National Australia Bank have reported their full-year results over the past fortnight, delivering billions in profits and splashing out boosted dividends to their shareholders.
Following 13 interest rate rises from the Reserve Bank since May 2022, all three of the big four banks reported a lift in their net interest income, which is the difference between the interest income they earned on loans less the interest they paid on customers’ savings deposits.
Rising interest rates mean the banks can charge more interest on existing and new loans. But they also have to pay higher interest on their wholesale funding to fund new loans, plus they have to pay a higher interest rate to customers with savings accounts. So, the Reserve Bank’s 13 rate rises did not go wholly and directly to the banks’ bottom lines.
In fact, all three banks reported that their business and institutional divisions produced the best results in FY23 – not their home loan divisions. But this is cold comfort to the millions of Australians whose home loan repayments have gone up exponentially over the past two years.
Here is a review of each bank’s full-year results for the 12 months ending 30 September.
Westpac
Westpac reported a 7% increase in net interest income to $18,317 million and a 26% increase in statutory net profit after tax (NPAT) to $7,195 million. The bank declared a final fully franked dividend of 72 cents per share, bringing its full-year dividend to 142 cents per share, up 14% on FY22. Westpac also announced a $1.5 billion share buyback.
National Australia Bank
NAB reported a 13.2% increase in net interest income to $16,807 million and a 7.6% boost to NPAT at $7.414 million. The bank announced a fully franked final dividend of 84 cents per share, which brought its full-year dividend to 167 cents per share, up 11% on FY22.
ANZ
ANZ reported net interest income of $16,581 million, up 11%, and statutory NPAT of $7,098 million, down 0.3%. The bank declared a final dividend of 94 cents per share, comprising 81 cents with 65% franking and a one-off unfranked dividend of 13 cents. This brought its full-year dividend to 175 cents per share, up 20% on FY22.
The Commonwealth Bank reports on a different cycle to the three smaller players within Australia’s ‘big four’.

Ophora Tallawong has launched its final release of quality apartments priced under $700,000.

From bushland greens to valley reds, the country’s most awarded designers are proving that the best colour palette was never on a swatch card; it was outside the window all along.


The federal budget has rattled property investors. But the biggest mistake isn’t the tax changes, it’s the conclusion many are drawing from them.
2 min
The recent budget has forced a reckoning for property investors.
Negative gearing now restricted to new residential builds, the CGT discount gone and on paper, the numbers look different.
And many investors are responding by pivoting toward yield, prioritising cash flow over capital growth in a way that property strategists say misses the point entirely.
“The debate has shifted to yield versus growth as if they are opposing forces,” says Abdullah Nouh, founder of Melbourne-based buyers’ agency Mecca Property Group. “But that framing is itself the mistake.”
Nouh, who works with high-net-worth families and investors on long-term acquisition strategy, argues that capital growth remains the primary driver of genuine wealth creation and that the post-budget environment has made quality assets more important, not less.
The numbers make his case plainly. An additional $500 per week in rental income is welcome. A prestige asset appreciating by $1 million over a market cycle is transformative.
These are not equivalent outcomes, and portfolios built around yield at the expense of location and land value tend to generate income while wealth stands largely still.
The more nuanced shift Nouh is seeing among sophisticated investors is a move toward assets where both outcomes can be engineered simultaneously – established homes on substantial land in quality locations, where the existing dwelling can be repositioned, rental returns improved, and the underlying land value compounds independent of what sits on it.
For investors with existing equity, commercial property is also entering the conversation in a more serious way.
Prestige industrial assets, medical centres and long-leased essential retail offer income profiles that residential property in most capital city markets cannot currently match: longer lease terms, tenants covering outgoings, and greater predictability than the residential tenancy cycle.
“The investors who build lasting wealth are rarely the ones who chased yield or growth exclusively,” says Nouh.
“They are the ones who built a strategy they could sustain – one that generated enough income to hold quality assets through multiple cycles while those assets compounded in value.”
The budget has changed the settings. It has not changed the fundamentals.
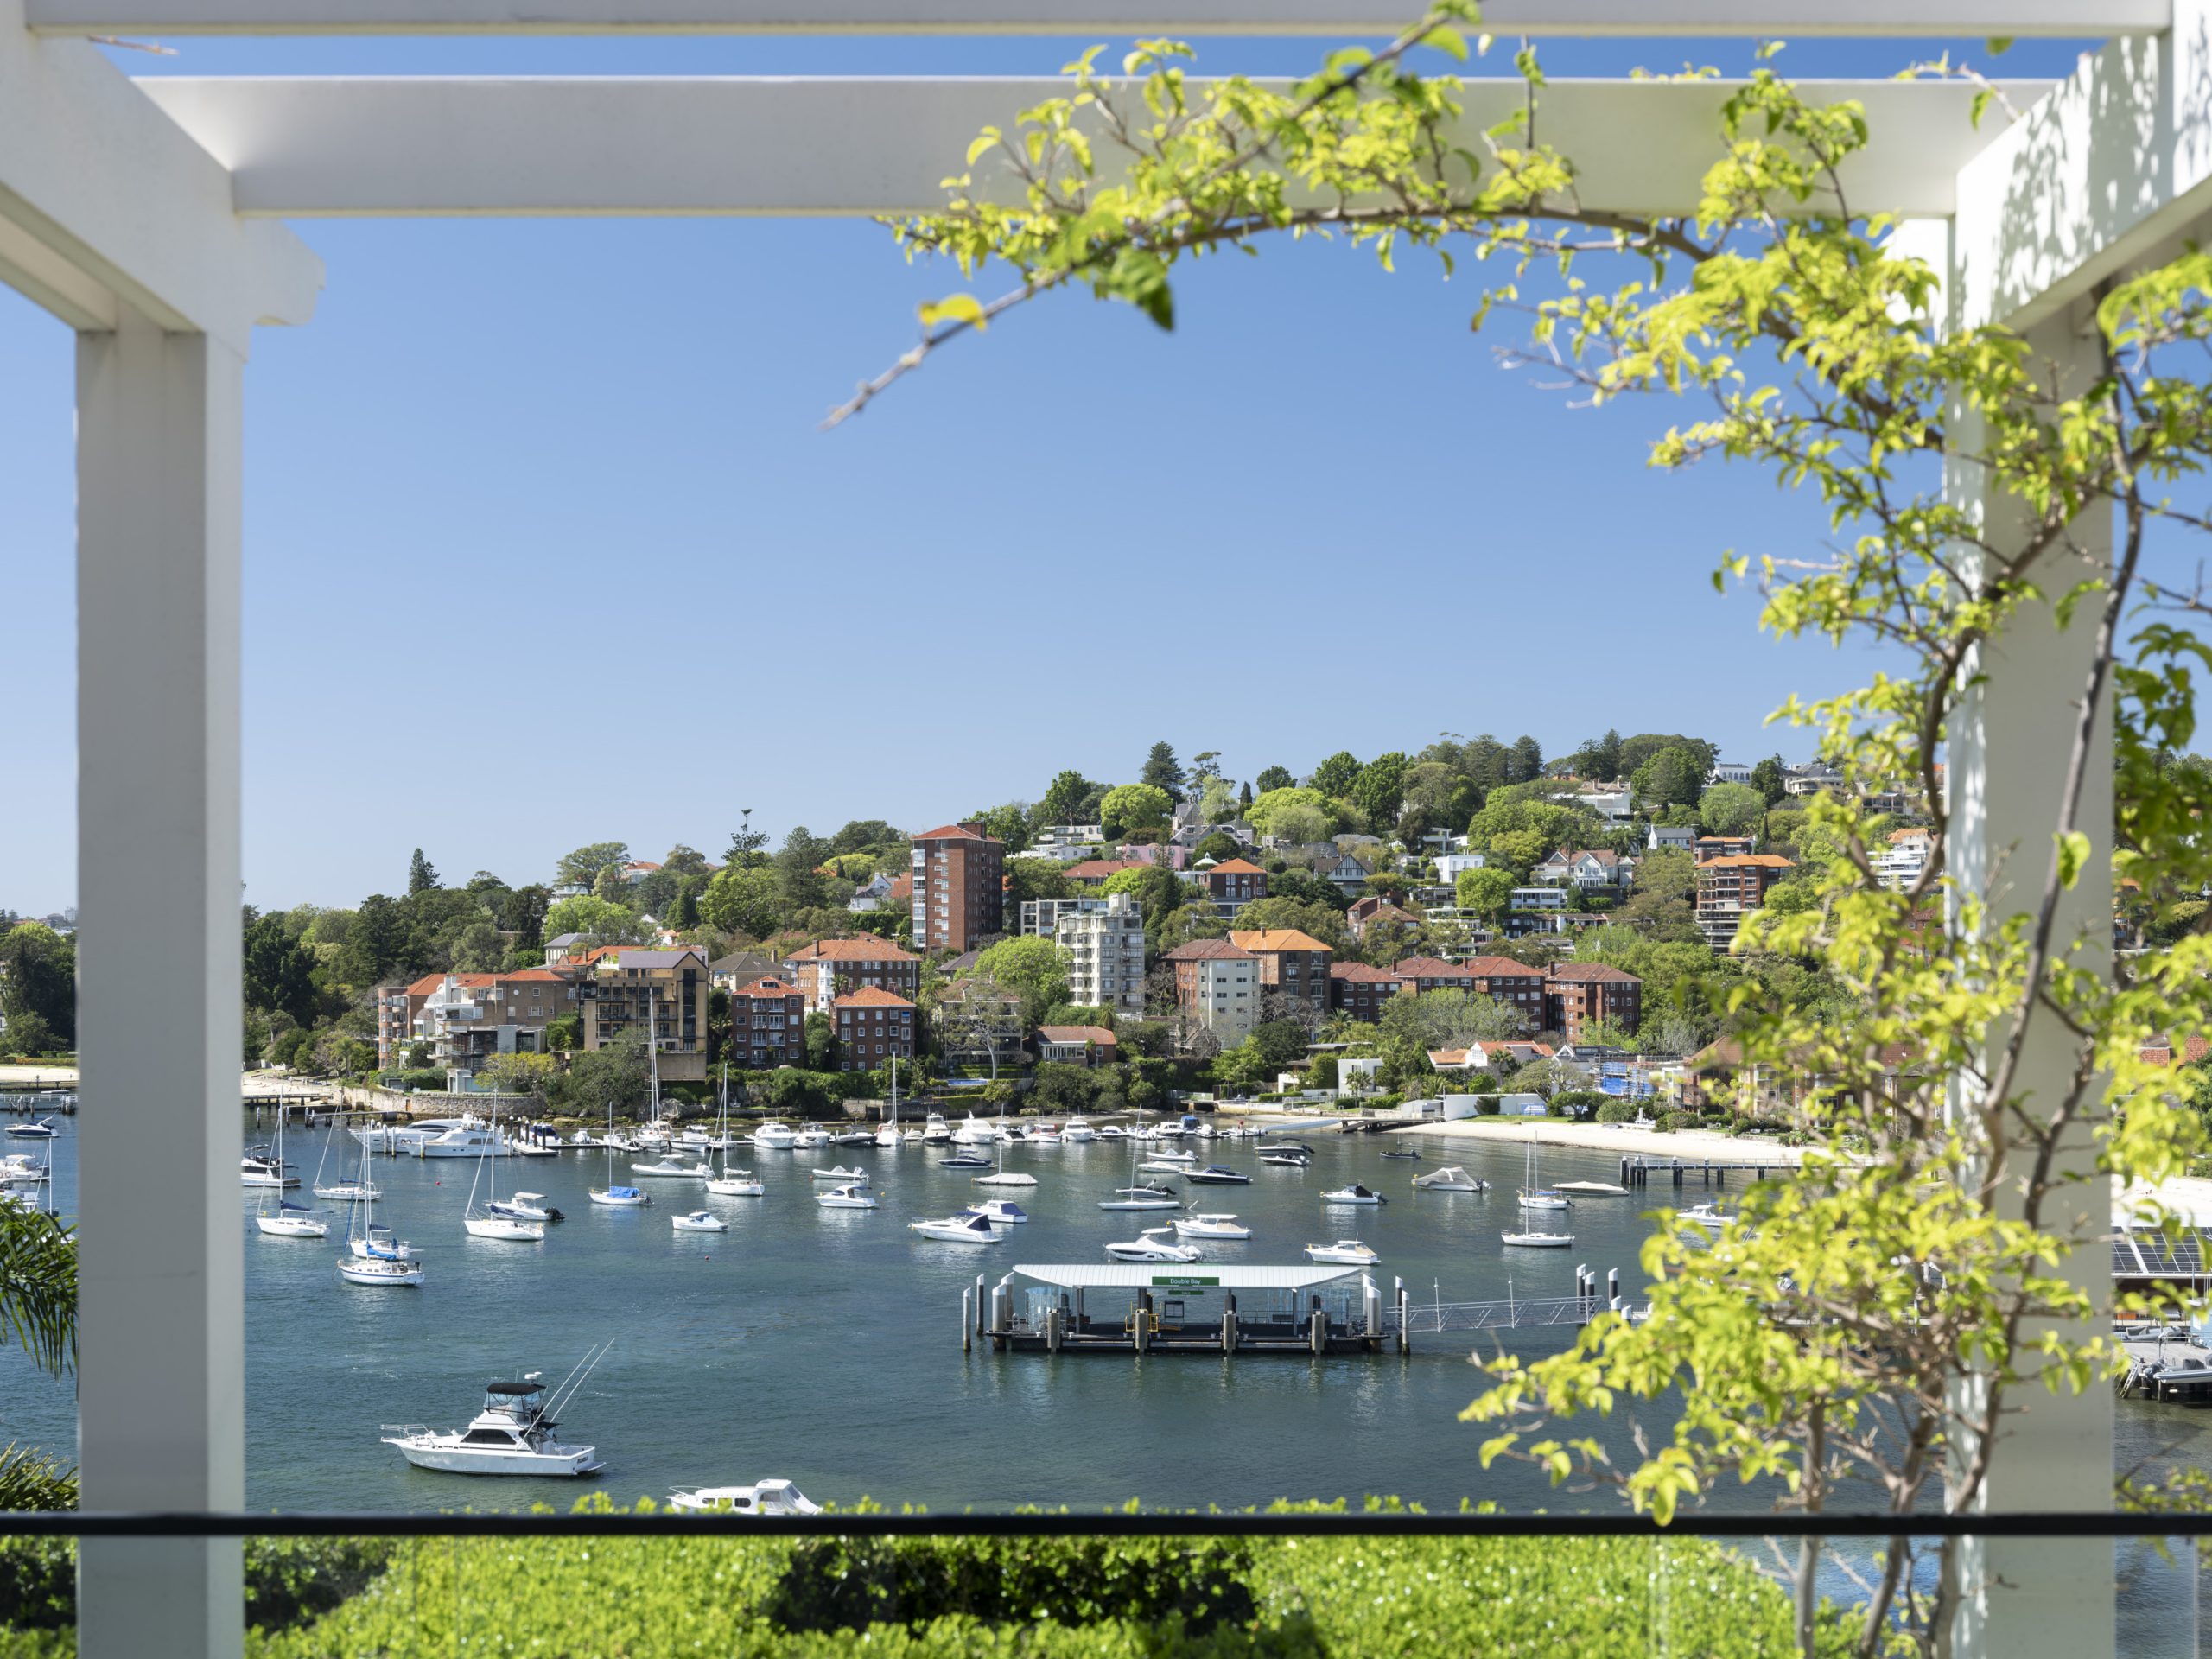
The grand harbourside residence combines sweeping Sydney Heads views, resort-style entertaining and refined designer finishes with a reported $36 million price guide.

Three-Michelin-starred chef Massimiliano Alajmo will host an intimate Mediterranean sailing aboard Crystal Serenity, redefining fine dining at sea.